
WTI prices moved significantly higher in the latest sessions, capturing new multi-year high levels. The current week has been extremely favorable for Oil prices and the accompanied volatility seems to excite traders and market participants. This report can be used as a brief update of the Oil market, presenting the principal subjects that are motivating traders in the current moment. Through this Oil report we aim to provide clear and detailed information creating awareness among traders but also identifying important technical price levels.
We make a start with the weekly Oil market data from the US which is monitored by traders due to the fact that it can produce great opportunities. On the 1st of March the American Petroleum Institute inventory levels displayed a significant drawdown of -6.1M barrels. Upon release and in the next few minutes, WTI jumped approximately $0.6 and continued to ascend in the next hour. On the following day the 2nd of March the Energy Information Administration’s (EIA) Crude Oil inventories indicated a considerable drawdown of -2.6M barrels. Upon release WTI gained approximately $0.90 in the next few minutes. The market reaction on both occasions seems to provide evidence that traders remain prepared in anticipation of the releases and take action accordingly. In this case the drawdowns have traditionally supported Oil prices thus the outcome may have been somewhat foreseeable. On the other hand, during the past Friday the Baker Hughes Oil rig count showed an increase of 2 Oil rigs with the total number now reaching 522 active Oil rigs. Very interesting is the fact that some of the biggest Oil companies in the US, have decided to keep limited their production growth this year despite Oil prices sky rocketing and making it worth the risk. US firms seem to remain disciplined after a series of unprofitable years.
Yesterday the 26th OPEC and non-OPEC Ministerial Meeting took place and was also in the market’s focus with very low expectations for a change, however. The OPEC plus group remains dedicated to its conservative stance and the decision to adjust upward the monthly overall production by 0.4 mb/d for the month of April 2022 was confirmed.
On a separate note as a non-OPEC member, Russia’s military attacks on Ukraine are currently a great contributor to the recent Oil market volatility. With the ongoing tensions Oil traders are constantly following developments, as Russia remains a great Oil and Gas exporter to the world but especially to Europe. On Wednesday various media sources like Reuters noted that after excluding Russia from the SWIFT payment system, the US is now targeting Russia’s Oil industry. According to the report the US is putting pressure on Russia through its refining sector with new export curbs and targeted Belarus with sweeping new export restrictions. Russia remains among the top world producers and exporters of Oil to global markets. Regardless of the tensions in Ukraine, Oil demand continues to be on the rise. We do not see demand for Oil being reduced but rather the opposite. In this case, if Russia’s Oil trade is limited to the market due to restrictions, Oil prices may continue to be on the rise.
Finally, in the past days the International Energy Agency announced the coordinated effort to release 60 million barrels of Oil from their emergency stockpiles. The International Energy Agency is a Paris-based group that includes the U.S., Japan and much of Europe. This action could be indirectly sending a message that Russia’s restrictions to global Oil supply can be overcome with alternative sources.
Technical Analysis
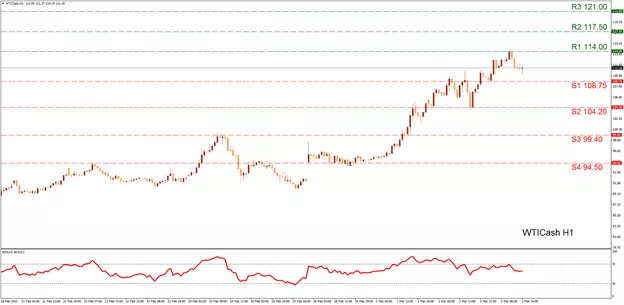
WTI H1
At the moment, WTI is retreating after testing the (R1) 114.00 resistance during today’s early European session. The (R1) is currently the multiyear high level for WTI and a possible breach above it can be a signal of a strong bullish interest. In this case traders could be searching for a target higher which can easily be the (R2) 117.50 level. However, if the bullish interest is extended abruptly then it may be more beneficial to focus on the (R3) 121.00 resistance hurdle. On the contrary, if the selling interest is increased then the (S1) 108.75 support level could be tested first as it was used in the past sessions as both a resistance and a support proving its relevance to recent price action. In an even more intense selling scenario we could see the (S2) 104.20 which was a distinctive support level tested yesterday. If the selling orders continue to reel in then the (S3) 99.40 could also be engaged. In our opinion, at this stage a breach below $100 per barrel could signal a selling interest with sideways tendencies. Very important is also the range between the (S3) 99.40 support and the (S4) 94.50 which was used broadly in the current week. The RSI indicator below our H1 chart seems to be in a decline for now, yet as the market continues to make new highs our personal bias remains bullish.


