
Summary
The circumstances surrounding the Russian invasion of Ukraine and resulting military confrontation continue to evolve quickly, and at times in unexpected ways. The conflict between Ukraine and Russia is occurring not only in the eastern part of Ukraine, but also in major cities around the country. In response, the United States, European countries, and other western allies have imposed a range of severe economic sanctions on Russia. While the negative economic effects will clearly be most heavily felt in Russia itself, there is potential for a moderate negative impact on other economies through various economic channels. In this report we examine some possible growth and inflation implications to assess how key economies could be impacted if the Russia/Ukraine crisis persists, or even intensifies.
Ukraine Crisis: A Modest Hit to Global Economic Growth…
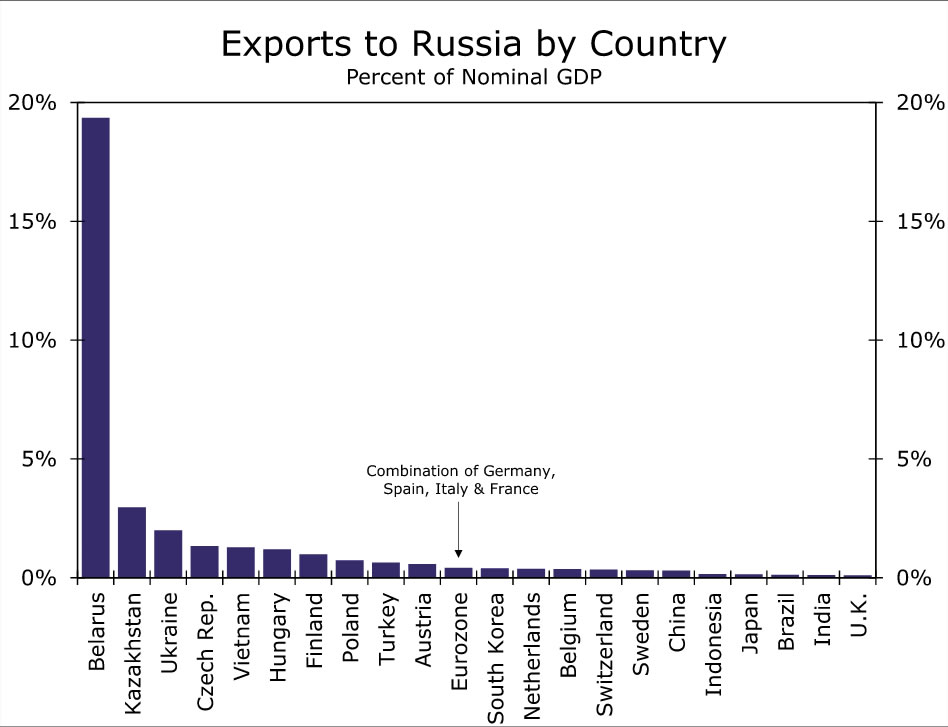
As we have noted in a series of reports on the Russia/Ukraine conflict, we expect the Russia/Ukraine crisis is likely to only have a moderately negative impact on global GDP growth. One channel this negative influence should be felt is through direct trade linkages between Russia and its various trading partners. Figure 1 below shows exports by country to Russia, as a proportion of that respective country’s GDP. Overall, we expect the hit to global growth through this trade linkage channel to not be significant. Even for countries where the trade exposures are largest (for example, Eastern European countries), exports to Russia account for only 2%-3% of GDP for Ukraine and Kazakhstan, and approximately 1.25% of GDP for the Czech Republic and Hungary. Eurozone economies will also likely experience a modest negative impact through the trade channel, with exports to Russia for the region’s largest economies accounting for just 0.4% of their GDP. Belarus has the most exposure to Russian demand, exporting goods worth almost 20% of GDP to Russia; however, Belarus’ role in global economic output is negligible. Meanwhile, for other western economies the trade effect should have negligible influence. As examples, exports to Russia account for just 0.1% of GDP for the United Kingdom and Japan, while trade exposures for many Southeast Asian economies as well as China are also low.
An alternative channel that could have somewhat more significant growth implications is the potential for a sustained spike in oil prices. An oil price shock could and should have different effects on economies based on whether each country is a net oil producer and net oil consumer. The Russia/Ukraine crisis has generated concern about possible supply disruptions for oil in particular, but as well as for some other key commodities. While the outlook for the oil market is inherently uncertain, and even more so when a major producer is involved in military conflict, concerns over oil supply disruption could continue to see oil prices move higher. In this environment, countries that are net oil producers or exporters would likely see economic growth positively impacted due to a boost from higher oil prices. In contrast, net oil consumers or importers would likely see economic growth weighed down by higher oil prices. We examine this energy-related channel by looking at oil production and consumption data for the 2019 calendar year from the Energy Information Agency. This is the most recent year for which both widespread oil production and consumption figures are available for several countries. In addition, the 2019 data of course represent production and consumption patterns that prevailed prior to the onset of the COVID-19 pandemic and should be considered more “normal.”
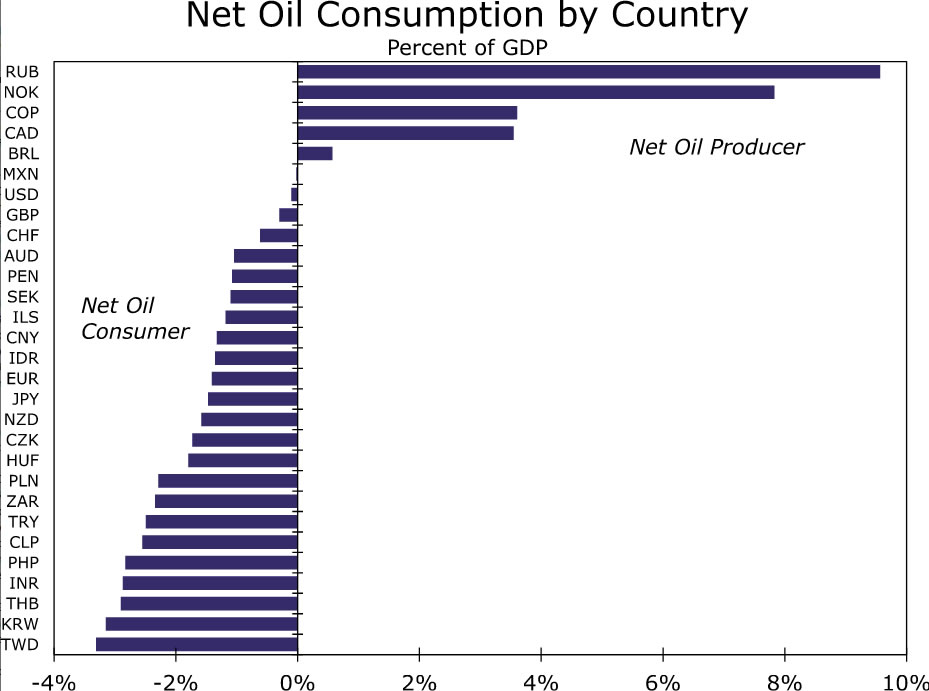
The results are shown below (Figure 2). While Russia is a very significant net oil producer (that is, production exceeds consumption) to the tune of 9.6% of its GDP, the country may not be able to reap the full benefits given the push back on purchasing Russian produced oil. Instead, looking at some other countries that are also significant net oil producers (Norway at 7.8% of GDP, Colombia 3.6% and Canada 3.5%, and to a lesser extent Brazil), these economies could be reasonably well insulated from spillover tied to the Russia/Ukraine crisis. These countries could conceivably see a modest positive benefit to their respective economies. The United States, United Kingdom and Mexico are essentially close to balance in terms oil production versus consumption and, as a result, should feel only moderate negative effects from higher oil prices. China and the Eurozone are only moderate net oil consumers to the tune of around 1.5% of their respective GDPs. Thus, the Chinese and Eurozone economies could be weighed down a bit more. However, the negative economic impact is likely to be felt most acutely in several emerging Asian economies (including Taiwan, South Korea, Thailand, India, Philippines), where net oil consumptions accounts for around 2.75% to 3.25% of those countries’ economies.
To wrap up, we expect the direct trade exposure channel and the oil price channel could see the Russia/Ukraine crisis lower global GDP growth by around 0.25% for 2022. Should that transpire we would lower our 2022 global growth forecast from 4.0% to 3.75%.
…A Slightly Larger Boost to Global Inflation
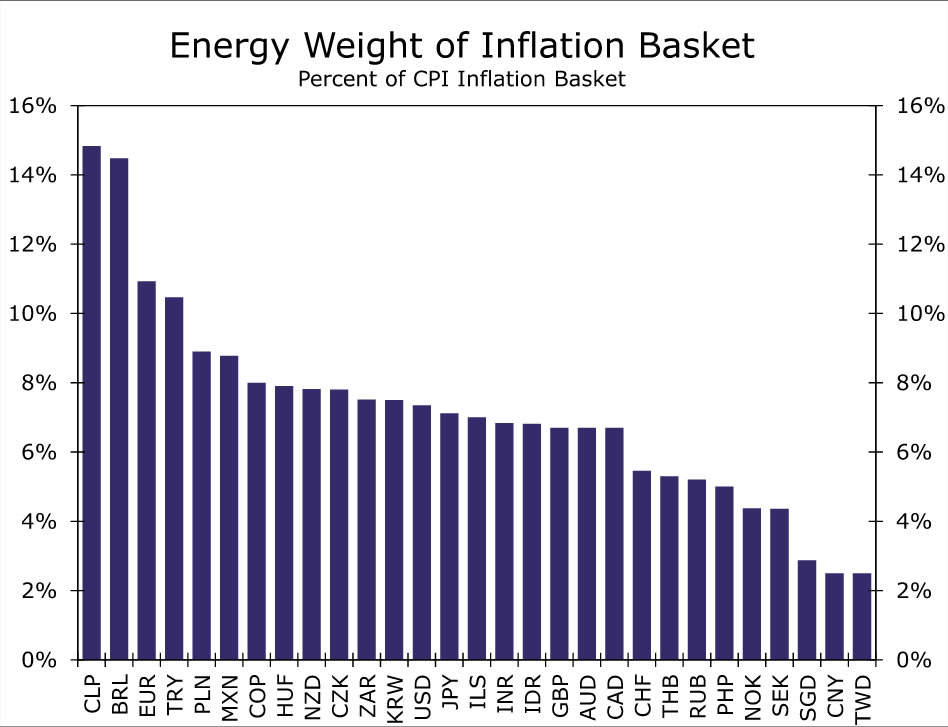
While we only expect modest negative effects to global growth, the Russia/Ukraine crisis could have a more pronounced impact on global inflation. Inflation is likely to be impacted through higher energy prices, but also food prices as well as select precious metal prices. Given most of the commodity shock has hit oil prices, we looked at energy’s share of the Consumer Price Inflation (CPI) basket for the same range of countries. The results vary across region and by country. Of the countries we analyzed, energy prices make up the largest share of the CPI basket in Latin America as well as the Europe, Middle East & Africa (EMEA) region (Figure 3). To that point, energy prices account for around 15% of the CPI basket in Chile and Brazil, notable outliers as far as energy’s share of their inflation basket. Also in Latin America, Mexico and Peru weight fuel prices at around 9% of their respective CPI indices, while Colombia is not far behind at 8%. In EMEA, almost 11% of the Eurozone CPI basket is weighted toward energy prices. We have highlighted in the past how sensitive the Eurozone is to the current surge in energy prices, while also noted how the Eurozone imports the majority of its oil, coal and natural gas directly from Russia. At the same time, given the Eurozone does not include all owner occuppied housing costs in its CPI, it is possible the energy weight could be slightly inflated. Elsewhere, emerging European countries could also be at risk of an additional boost to local inflationary pressures. Turkey, Poland, Hungary, the Czech Republic, South Africa all have energy represent about 8% of their inflation basket, while Israel’s CPI has about a 7.5% weight toward energy. And finally, we highlighted Asia as a country that could experience negative growth repercussions from higher energy prices; however, with the exception of India and Indonesia, energy prices do not represent a significant portion of inflation baskets across the region. In the case of India and Indonesia, energy represents around 7% of the CPI, a relatively large percentage, and 4.5% in Thailand and the Philippines. Singapore, China and Taiwan are less exposed as energy accounts for only 2%-2.5% of their CPIs.
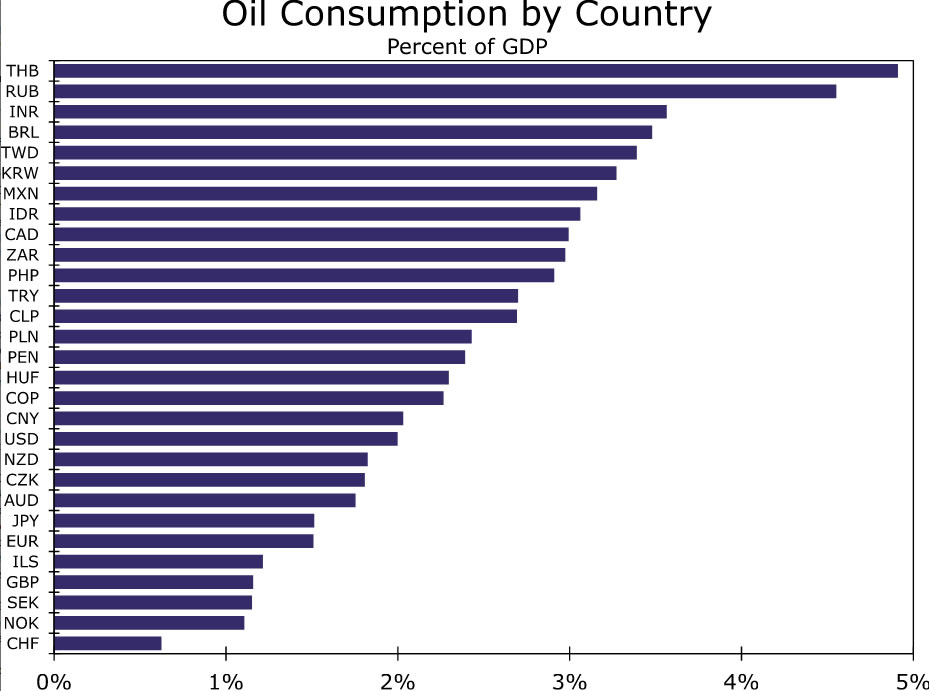
Of course, the actual consumption of oil plays in a role in whether inflation will be affected as well. In that sense, emerging Asia is a bit more exposed given the relatively high levels of consumption across the region. According to 2019 EIA data, Thailand, as a share of its economy, is a large consumer of oil as the population consumes oil worth around 5% of its economy (Figure 4). India, Taiwan as well as South Korea also consume a relatively large amount of oil, close to 4% of their respective economies, leaving these countries CPIs exposed to higher oil prices. As far as China, similar to the weight in the CPI basket, China does not appear to be particularly exposed as oil consumption is lower at only 2.5% of GDP. Latin America is sensitive to energy price swings via the CPI basket; however, Latin American countries are also exposed through the consumption channel as well. In fact, Latin America may be the most sensitive, from an inflation perspective, of any region in the world. Brazil and Mexico are large consumers of oil, while Chile, Peru and Colombia are not far behind. Given the large weight of energy in the inflation basket and relatively high level of overall oil consumption, we would expect inflationary pressures across Latin America to rise as a result of the Russia/Ukraine conflict. Europe, both developed and emerging, are not large consumers of oil. Turkey and South Africa seem to consume the largest amount of oil in the EMEA region, while the rest of EMEA’s oil consumption is more modest. G10 countries, on balance, are lower on the list of oil consumers. In terms of the Eurozone, the region consumes oil worth only 1.5% of economic output. Within the G10, the United States is among the larger consumers of oil; however, oil consumption is only worth around 2.5% of GDP.
The takeaway from these data is that we expect broad inflationary pressures to build as an aftershock of the war in Ukraine. Latin America and emerging Asia are most exposed, and we would expect a pick up in most country-specific CPIs across both regions. In the G10, we also expect price pressures to build; however, likely at differing magnitudes. When we add all this up, we believe the inflationary impact will outpace the growth effects. In that sense, our global CPI forecast could rise to 5.75% from 5.0% by the end of this year.
What About External Linkages?
One final perspective we consider is how higher oil and energy prices might interact with a country’s external balance. As far as external balances, we refer to a nation’s trade and current account balance, which for most countries, can be heavily influenced by commodity price swings. Large swings in the external balance could potentially lead to capital outflows, and eventually follow through to currency weakness. Vulnerable economies include significant oil importers which are already running large current account deficits. These countries could see their respective external balances deteriorate even further, potentially pressuring their currencies.
In this context, we again highlight countries across emerging Asia. As of the latest update, the IMF forecasts India to run a current account deficit of close to 1.5% of GDP and for Indonesia to run a current account deficit of over 1% of GDP. Also, the Philippines has an external deficit closer to 2% of GDP and could see its external balance move further into deficit as energy prices move higher. In that sense, the rupee, rupiah and Philippine peso could experience the largest capital outflows in emerging Asia and could see weaker currencies. Thailand on the other hand has a healthy current account surplus, worth over 2% of GDP according to IMF forecasts. In this scenario, we would expect the Thai economy to potential experience less significant capital outflows and for the baht to be more protected given the existing surplus. The same can be said for South Korea. While Korea is a large consumer of energy and we would expect the current account to suffer as a result, a 4% external surplus could give the country a bit of cover and protect the won from excess volatility. Aside from Asia, select EMEA countries could be at risk as well. We choose to particularly highlight Turkey and South Africa as both countries are large net importers of oil. Despite a weaker Turkish lira, Turkey’s external balance is still in deficit. Higher oil prices should push the current account deeper into deficit and should place pressure on capital outflows in Turkey. While we already forecast a significantly weaker Turkish lira over time, higher oil prices and a deteriorating current account balance could place added pressure on the lira going forward. South Africa’s current account has moved closer to balance lately; however, with net oil consumption of around 2.5% of GDP, the rand could experience depreciation pressure as a result of potentially pending capital outflows. We also forecast the rand to underperform relative to peer emerging market currencies; but similar to Turkey, higher oil prices could be a new source of depreciation pressure on the South African rand.
On the other hand, Latin American currencies could experience some support and be considered “winners” of the Russia/Ukraine conflict. Most of Latin America are net oil exporters, or at least close to neutral (i.e: Brazil, Colombia and Mexico) and could see their existing current account balances improve. As current account balances improve, Latin America could experience capital inflows and support could build for the Brazilian real and Colombian peso in particular. We would note, however, that while higher oil prices can help the Brazilian real and Colombian peso over the course of the crisis, we are not ready to reverse course and forecast stronger currencies over the entirety of our forecast horizon. Local politics in both countries are precarious ahead of presidential elections this year, and if inflation pressures build as we expect, diminished purchasing power could result in elevated political risk ahead of those elections.


