
U.S. Highlights
- Congress passes a deal to suspend the debt limit, averting the “worst case scenario” of a default.
- Today’s Nonfarm Payrolls Report featured a big jobs gain (+339k) and a pop in the unemployment rate (+0.3 percentage points).
- The health in the labor market is consistent with our view that policy easing won’t come until at least the first quarter of next year.
Canadian Highlights
- First quarter GDP growth expanded at an impressive 3.1% quarter-on-quarter (q/q) annualized pace, above consensus and the Bank of Canada’s April projection. Growth was powered by a surge in household spending.
- Monthly GDP growth was also better-than-expected in March, while Statcan’s preliminary estimate for April pointed to a surprisingly strong 0.2% month-on-month gain. Still, this leaves second quarter growth on track to slow to around 1% (q/q).
- The hotter-than-expected GDP print, alongside earlier indications of persistent inflation and labour market strength, signals that further action on rates by the Bank of Canada could be in the cards.
U.S. – Labor Market Stays Hot Despite Rising Unemployment Rate
With Congress passing a deal to suspend the debt limit and avoiding a default, all eyes were focused on this morning’s non-farm payrolls report. Hiring rose by a robust +339k, which came in well above the consensus forecast of 195k. Looking forward, markets are now expecting the Fed will have to keep rates higher for longer to cool the economy and inflation.
Turning to the specifics of debt ceiling deal, Congress passed the Fiscal Responsibility Act of 2023 which will suspend the debt ceiling for two years and avert a default on U.S. debt. The deal caps discretionary spending for 2024-2025 and will have a modest effect on reducing the deficit over that time horizon. Moreover, the overall impact on the economy should be modest with the peak impact coming in 2024 and the possibility of shaving 0.1% off GDP growth.
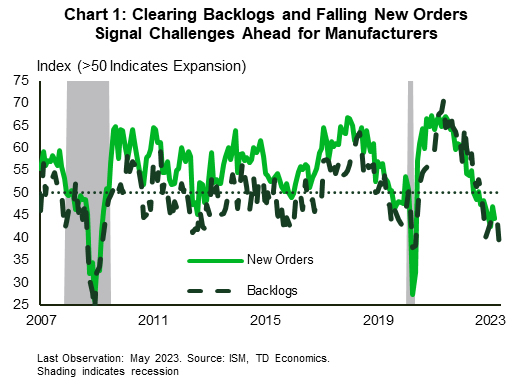
The economic data out this week showed U.S. manufacturing activity continues to feel the pinch from higher rates and a pullback in demand. The ISM manufacturing index registered a 46.9 reading – well short of the 50 print indicating growth. This is now the seventh consecutive month of contraction for the sector and the outlook in the coming months is decidedly gloomy. New orders contracted again (at a faster pace than the month prior) and the backlogs in business that have helped keep factories humming cleared at their fastest pace since the Global Financial Crisis (Chart 1). There was a silver lining to the report as the transportation sector did report an expansion for the month of May – helping it continue its recovery amid ongoing tight supplies. Indeed, despite vehicle sales in May coming in slightly below expectations (15.1 million annualized vs. the 15.3 million annualized expected) the details of the report show that pent-up demand is still being cleared and the industry remains undersupplied.
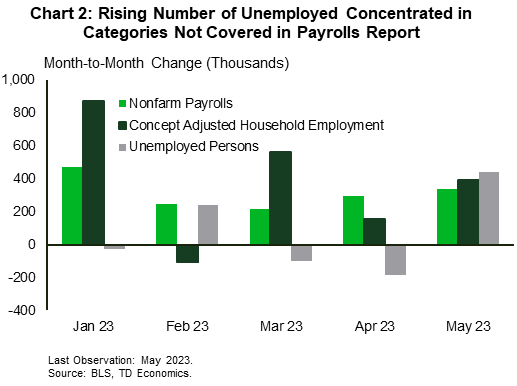
The weakness in the manufacturing sector was expected and stands in stark contrast to what’s happening across the rest of labor market. Nonfarm payrolls grew by 339k position in May, blowing past expectations for a more modest expansion of 195k. The bulk of the growth came from the services side – adding 257k positions in May – though construction (+25k) and government (+56k) all chipped in with healthy gains. However, this blowout print was accompanied by a 440k increase in the number of unemployed in the household survey – lifting the unemployment rate 30 basis points to 3.7%. Excluding the lockdown phase of the pandemic, this is the steepest rise in the jobless rate since November 2010. However, take the rise with a grain of salt, as the concept adjusted household employment that excludes categories like agricultural and household workers and adds in multiple job holders to make it comparable to the payrolls numbers, showed a still healthy 394k gain (Chart 2).
With this backdrop markets are as bracing for the possibility of another Fed hike by mid-summer and a delayed start to rate cuts. The need for rates to remain in restrictive territory for longer is in line with our view that policy easing won’t come until 2024Q1.
Canada – Hot GDP Report Adds to Case for a Rate Hike
Even with the significant tailwind of a new U.S. debt ceiling deal, Canadian equities were tracking lower (as of writing). Oil was an important part of this story. Indeed, the benchmark WTI oil price slid lower for much of the week (at one point pushing below $70/barrel), as Russia has made little progress on pledged output cuts and Chinese growth concerns continued to swirl. However, it did retrace a large portion of these losses at the end of the week on the strength of the debt ceiling pact.
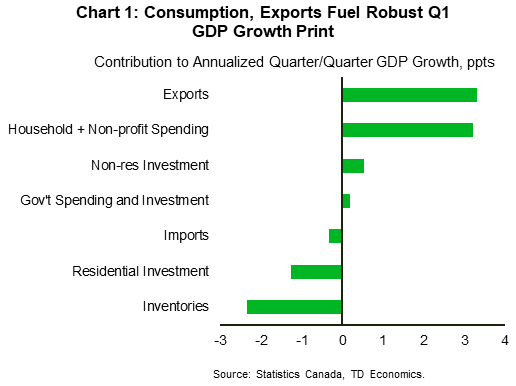
A hotter-than-anticipated Canadian first quarter GDP report was the main data event of the week. GDP expanded at a 3.1% quarter-on-quarter annualized (q/q) pace – well above the 2.3% q/q rate for potential output growth estimated by the Bank of Canada in their latest Monetary Policy Report. This implies that the economy moved even further into excess demand in the early part of the year.
In the first quarter, the economy received a big helping hand from consumption, which vaulted higher by nearly 6% q/q. Passenger car sales surged, as rising auto production (amid improving global supply chains) fed pent-up demand for cars. Importantly, several expenditure categories identified by the Bank of Canada in past research as being sensitive to interest rates (like furniture, transportation services, food beverage/accommodation services, and communications spending) had solid performances.
The other big growth contributor was exports. Here too, the impact of better-functioning auto supply chains showed, as shipments of motor vehicles and parts soared 71% annualized, although gains across other categories were relatively broad-based. Elsewhere, positive contributions came from non-residential spending categories, although residential investment contracted significantly (Chart 1). The latter category is poised to turn from weighing on growth to adding to it in the second quarter, as both housing starts and home sales grew robustly in April.
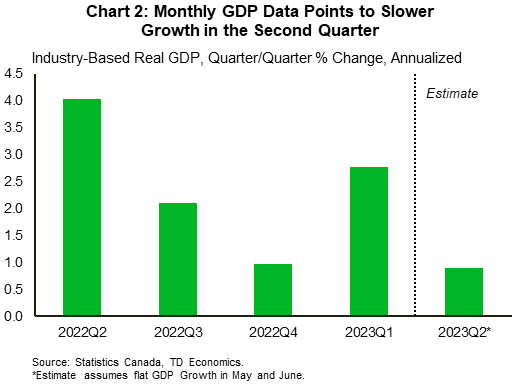
The other important part of the GDP report was the monthly, industry-based GDP data. In March, GDP growth was flat, which was better-than-the early estimate calling for a small dip. Meanwhile, Statcan’s preliminary estimate is that GDP expanded by 0.2% month-on-month in April – a positive surprise given the significant growth hit coming from the public sector workers strike that month. This data would point to second quarter growth slowing to around 1% q/q (Chart 2), which is more consistent with the Bank of Canada’s latest projection.
Earlier in the month we received data indicating that inflation is showing more persistence than anticipated, while strength in the labour market just won’t quit. Along with these data points, the hotter-than-expected GDP report swings the pendulum further towards action on rates by the Bank of Canada. Although it may be too early for policymakers to pull the trigger on another rate hike at next week’s meeting (especially with another reading on the country’s employment situation due out just a few days after), if the data keep coming in hot, another move sometime this year is certainly on the table.


. Oil was an important part of this story. Indeed, the benchmark WTI oil price slid lower for much of the week (at one point pushing below $70/barrel), as Russia has made little progress on pledged output cuts and Chinese growth concerns continued to swirl. However, it did retrace a large portion of these losses at the end of the week on the strength of the debt ceiling pact.)