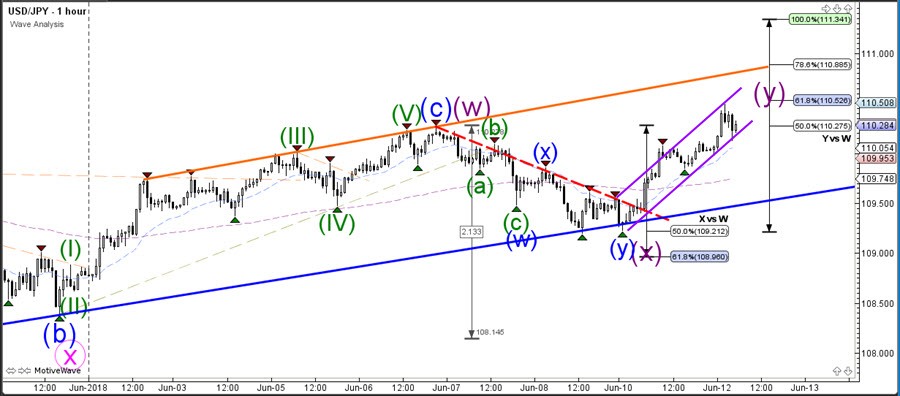
The USD/JPY broke above the key resistance trend line (dotted orange), which could confirm a bullish wave Y (purple) that is aiming for 111.50– 112.50.
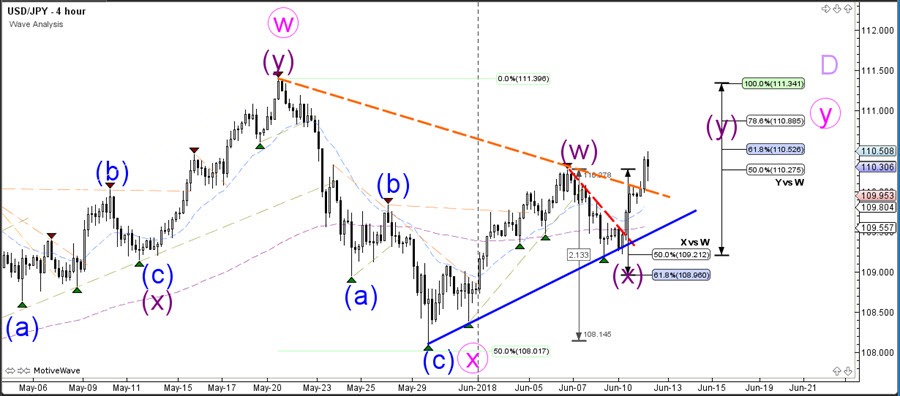
The USD/JPY is probably building a WXY (purple) correction within a larger triangle pattern from the daily chart (wave D purple).
The USD/JPY remains rooted in an smaller bullish channel (purple) of a larger uptrend channel. Price could be developing a potential ABC correction within wave Y (purple) so any bearish pullback could see a bounce at the bottom of the channel.