
The EUR/USD currency pair
Technical indicators of the currency pair:
Prev Open: 1.13678
Open: 1.13827
% chg. over the last day: +0.24
Day’s range: 1.13748 – 1.13838
52 wk range: 1.1299 – 1.2557
The technical pattern on the EUR/USD currency pair is ambiguous. Quotes are in a sideways trend. Investors expect the G20 summit. Currently, the local support and resistance levels are 1.13700 and 1.14000, respectively. Positions should be opened from these marks. Quotes have the potential for further growth.
The news feed on 30.11.2018:
Consumer price index in the Eurozone at 12:00 (GMT+2:00).
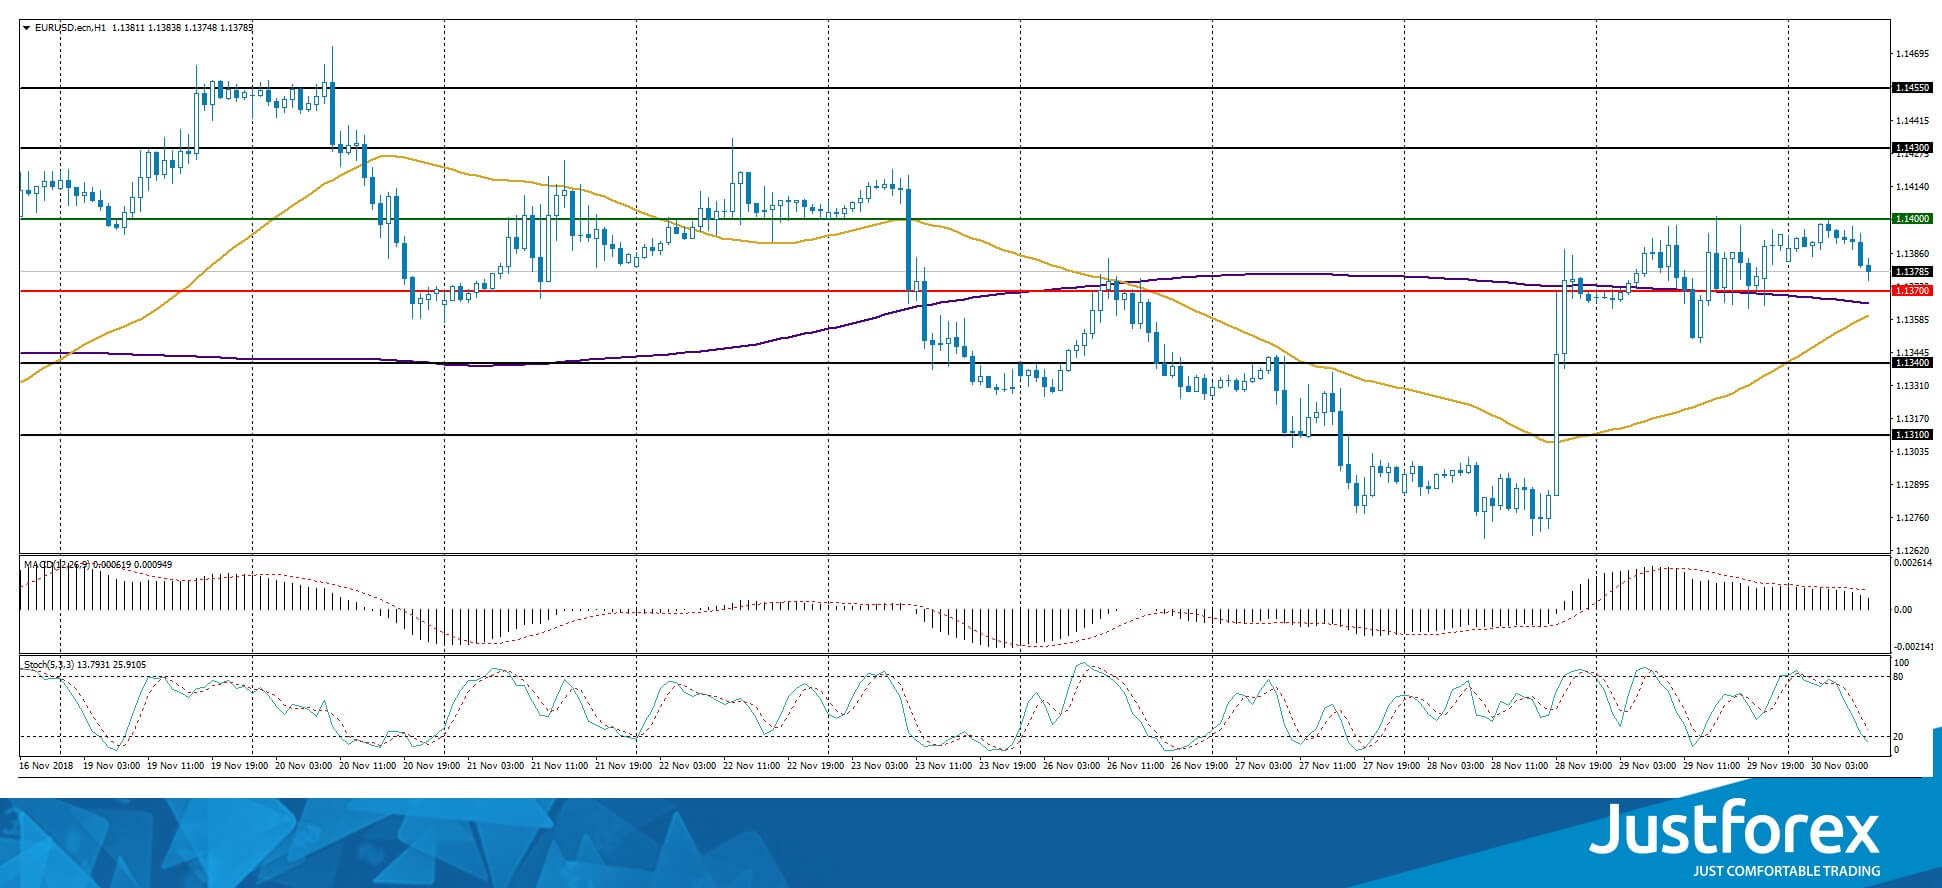
Indicators point to the power of buyers: the price has fixed above 50 MA and 200 MA.
The MACD histogram is in the positive zone, but below the signal line, which gives a strong signal to buy EUR/USD.
Stochastic Oscillator is located near the oversold zone, the %K line is below the %D line, which gives a weak signal to sell EUR/USD.
Trading recommendations
Support levels: 1.13700, 1.13400, 1.13100
Resistance levels: 1.14000, 1.14300, 1.14550
If the price fixes above the round level of 1.14000, the EUR/USD quotes are expected to grow. The movement is tending to 1.14300-1.14550.
An alternative may be a decrease in the EUR/USD currency pair to the level of 1.13400-1.13100.
The GBP/USD currency pair
Technical indicators of the currency pair:
Prev Open: 1.28235
Open: 1.27821
% chg. over the last day: -0.30
Day’s range: 1.27790 – 1.28345
52 wk range: 1.2662 – 1.4378
The technical pattern on the GBP/USD currency pair is ambiguous. The trading instrument is moving in a flat. Financial market participants expect additional drivers. At the moment, the key support and resistance levels are 1.27750 and 1.28100. Positions should be opened from these marks. We recommend following the current information regarding the Brexit process.
Today the publication of important economic reports from the UK is not planned.
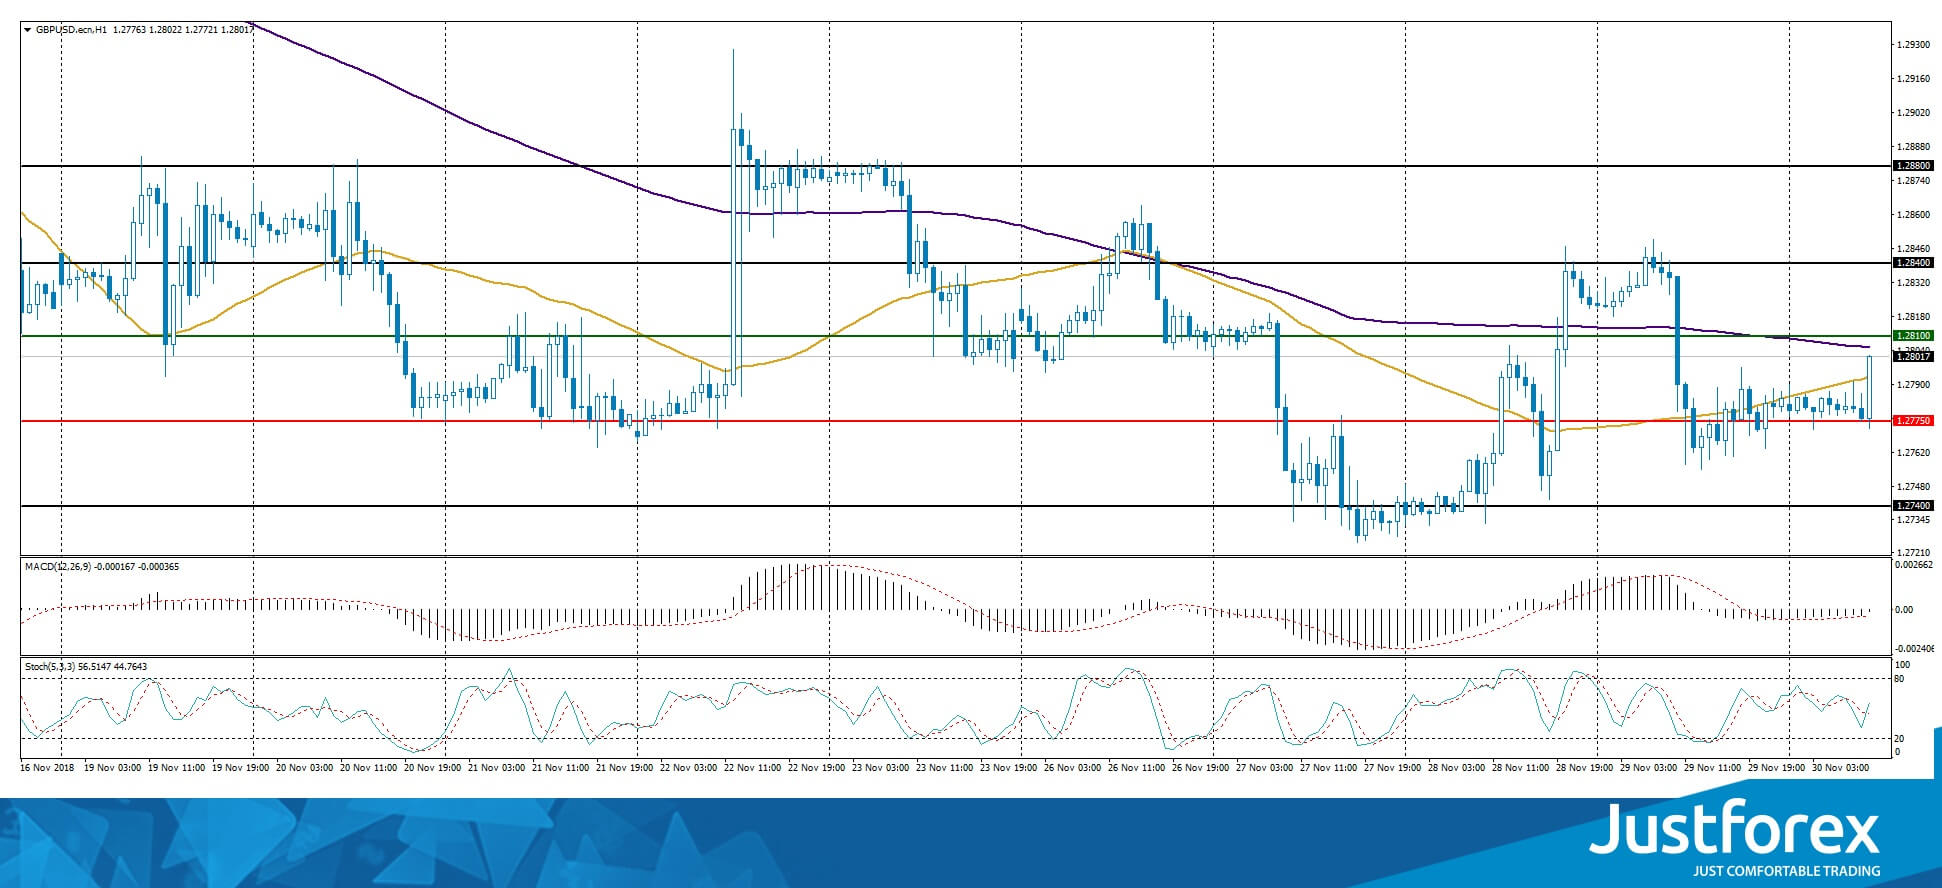
Indicators do not send accurate signals: the price has crossed 50 MA and 200 MA.
The MACD histogram is near the 0 mark.
Stochastic Oscillator is in the neutral zone, the %K line has crossed the %D line. There are no signals.
Trading recommendations
Support levels: 1.27750, 1.27400
Resistance levels: 1.28100, 1.28400, 1.28800
If the price fixes below the support level of 1.27750, the GBP/USD quotes are expected to decline. The movement is tending to 1.27400-1.27000.
An alternative may be the GBP/USD currency pair growth to 1.28400-1.28800.
The USD/CAD currency pair
Technical indicators of the currency pair:
Prev Open: 1.32725
Open: 1.32793
% chg. over the last day: -0.00
Day’s range: 1.32959 – 1.33069
52 wk range: 1.2248 – 1.3387
Yesterday, there was a variety of trends on the USD/CAD currency pair. At the moment, the technical pattern is ambiguous. Investors expect additional drivers. Local support and resistance levels are 1.32850 and 1.33150, respectively. Positions should be opened from these marks. We recommend paying attention to important economic data from Canada.
At 15:30 (GMT+2:00), the GDP data will be published in Canada.
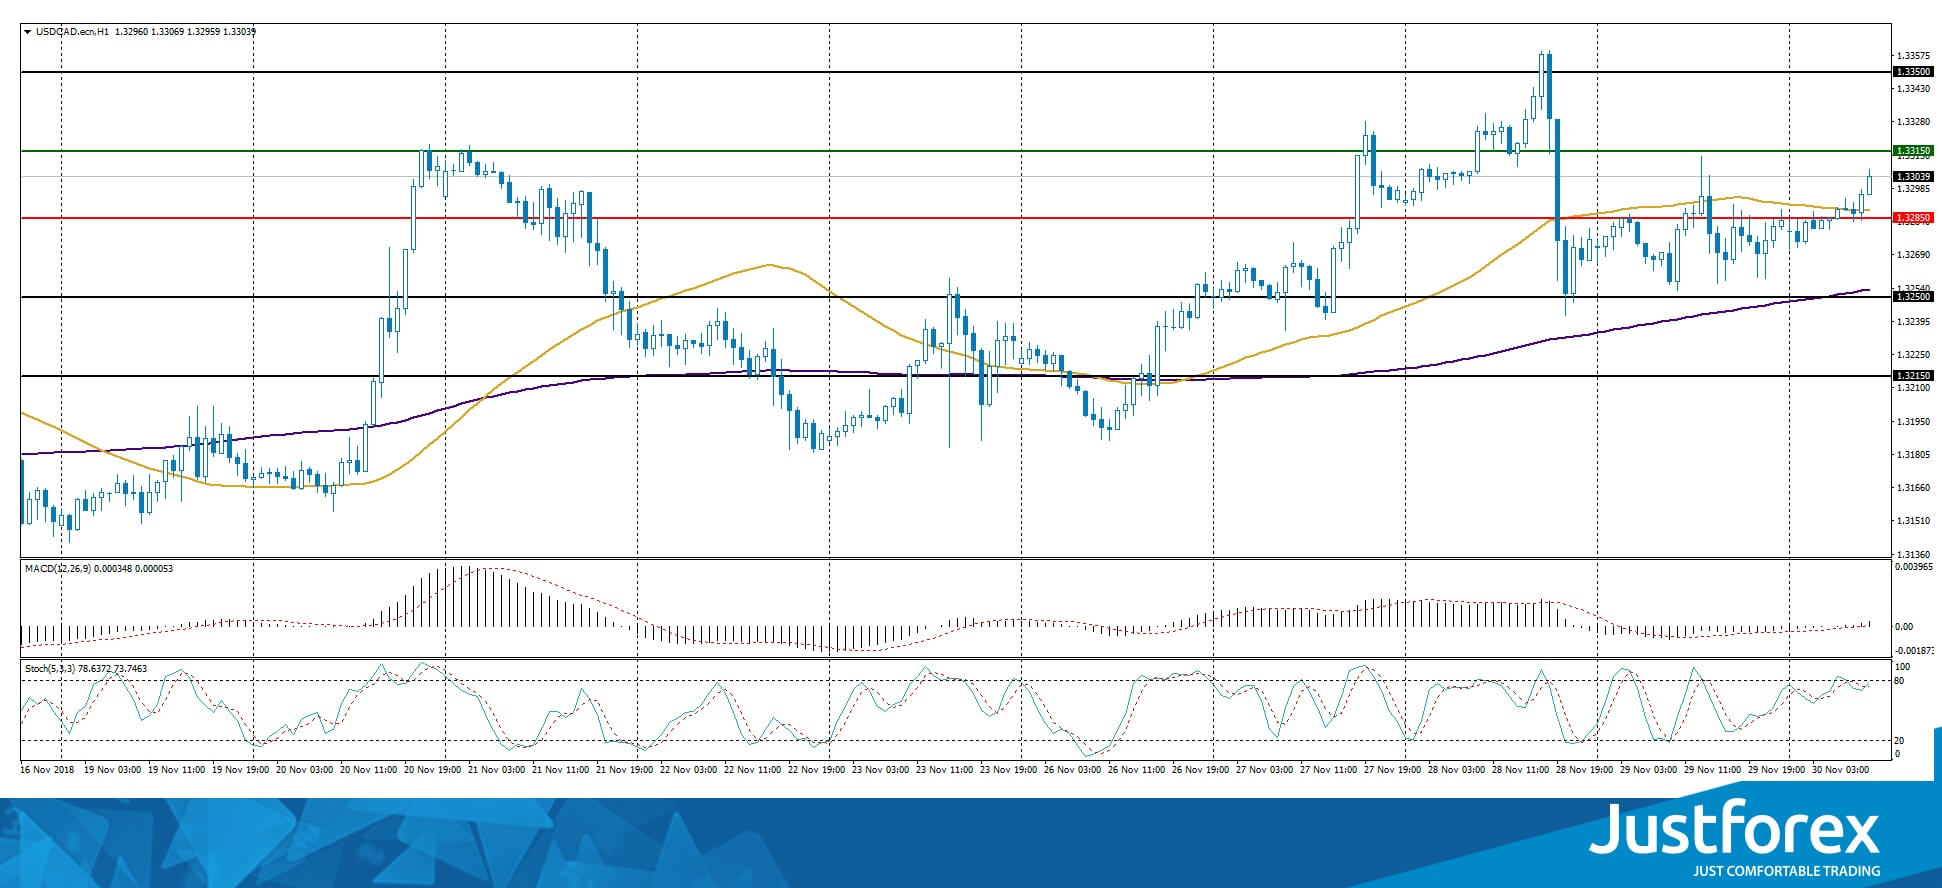
The price is being traded above 50 MA and 200 MA, which indicates the power of buyers.
The MACD histogram is near the 0 mark. There are no signals.
The Stochastic Oscillator is located near the overbought zone, the %K line has crossed the %D line. There are no signals at the moment.
Trading recommendations
Support levels: 1.32850, 1.32500, 1.32150
Resistance levels: 1.33150, 1.33500
If the price fixes below the support level of 1.32850, it is necessary to consider sales of USD/CAD. The movement is tending to 1.32500-1.32150.
Alternative option. If the price fixes above the 1.33150 mark, we recommend looking for entry points to the market to open long positions. The movement is tending to 1.33500-1.33700.
The USD/JPY currency pair
Technical indicators of the currency pair:
Prev Open: 113.672
Open: 113.479
% chg. over the last day: -0.25
Day’s range: 113.417 – 113.425
52 wk range: 104.56 – 114.74
The USD/JPY currency pair is consolidating. The unidirectional trend is not observed. At the moment, the local support and resistance levels are 113.250 and 113.500, respectively. Positions should be opened from these marks. The USD/JPY quotes have the potential for further correction. We recommend paying attention to the 10-year US government bonds yield.
The news feed on the economy of Japan is calm.
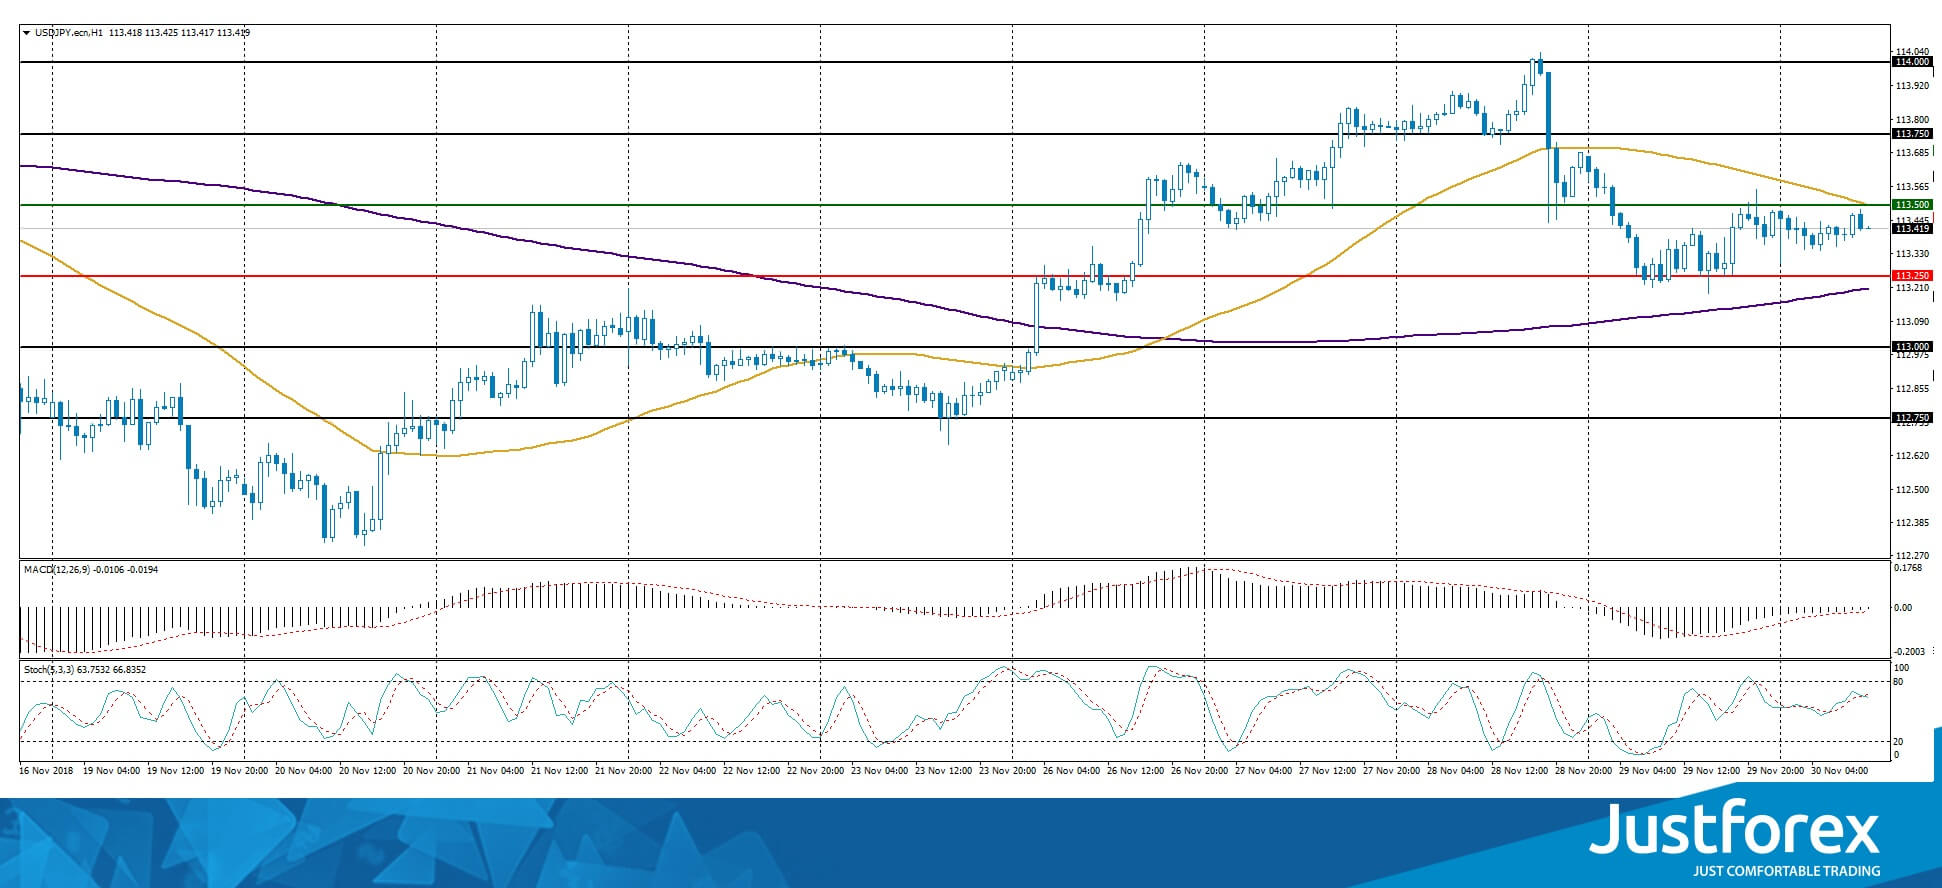
Indicators do not send accurate signals: the price has fixed between 50 MA and 200 MA.
The MACD histogram is near the 0 mark.
Stochastic Oscillator is in the neutral zone, the %K line has crossed the %D line. There are no accurate signals.
Trading recommendations
Support levels: 113.250, 113.000, 112.750
Resistance levels: 113.500, 113.750, 114.000
If the price fixes below the local support of 113.250, the USD/JPY currency pair correction is expected. The movement is tending to 113.000-112.750.
An alternative may be the USD/JPY quotes growth to 113.750-114.000.


