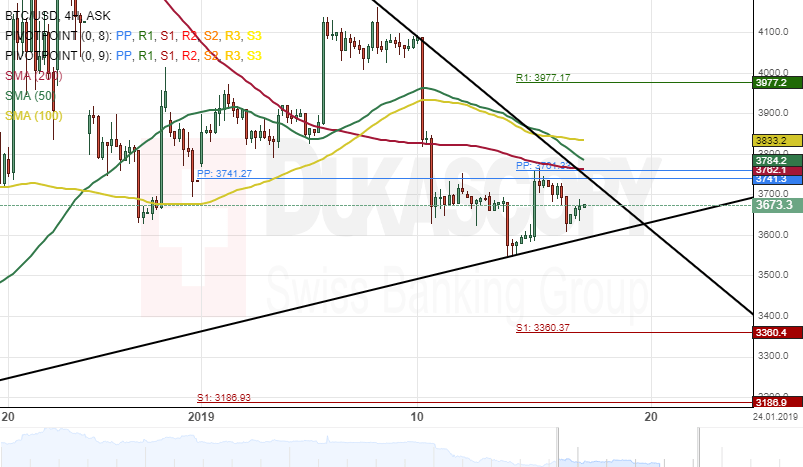
The Bitcoin cryptocurrency has declined about 13.04% against the US Dollar since last week Thursday. The pair began depreciating after hitting the $4100 mark on January 10.
The BTC/USD pair tested a resistance cluster formed by the combination of the weekly and the monthly PPs at 3792.0 during the previous trading session.
Most likely, it is expected that the blockchain continues its decline during the following trading sessions, and potentially targeting a support level at 3360.3.
However, a support line formed by the lower boundary of an ascending trendline at 3600.0 could provide support for the pair today.