
The EUR/USD currency pair
Technical indicators of the currency pair:
Prev Open: 1.13923
Open: 1.13912
% chg. over the last day: -0.07
Day’s range: 1.13824 – 1.13985
52 wk range: 1.1214 – 1.2557
EUR/USD is still showing an ambiguous technical picture. The quotes are moving sideways. Yesterday the EU and the US published important economic reports. The consumer price index grew by 1.6%, as expected. The PMI by the Federal Reserve of Philadelphia grew to 17 in January, while the experts expected 9.7. The local support and resistance levels are 1.13850 and 1.14100. Positions should be opened from these levels.
The Economic News Feed for 18.01.2019:
Consumer Mood Index by the Michigan University (US) – 17:00 (GMT+2:00);
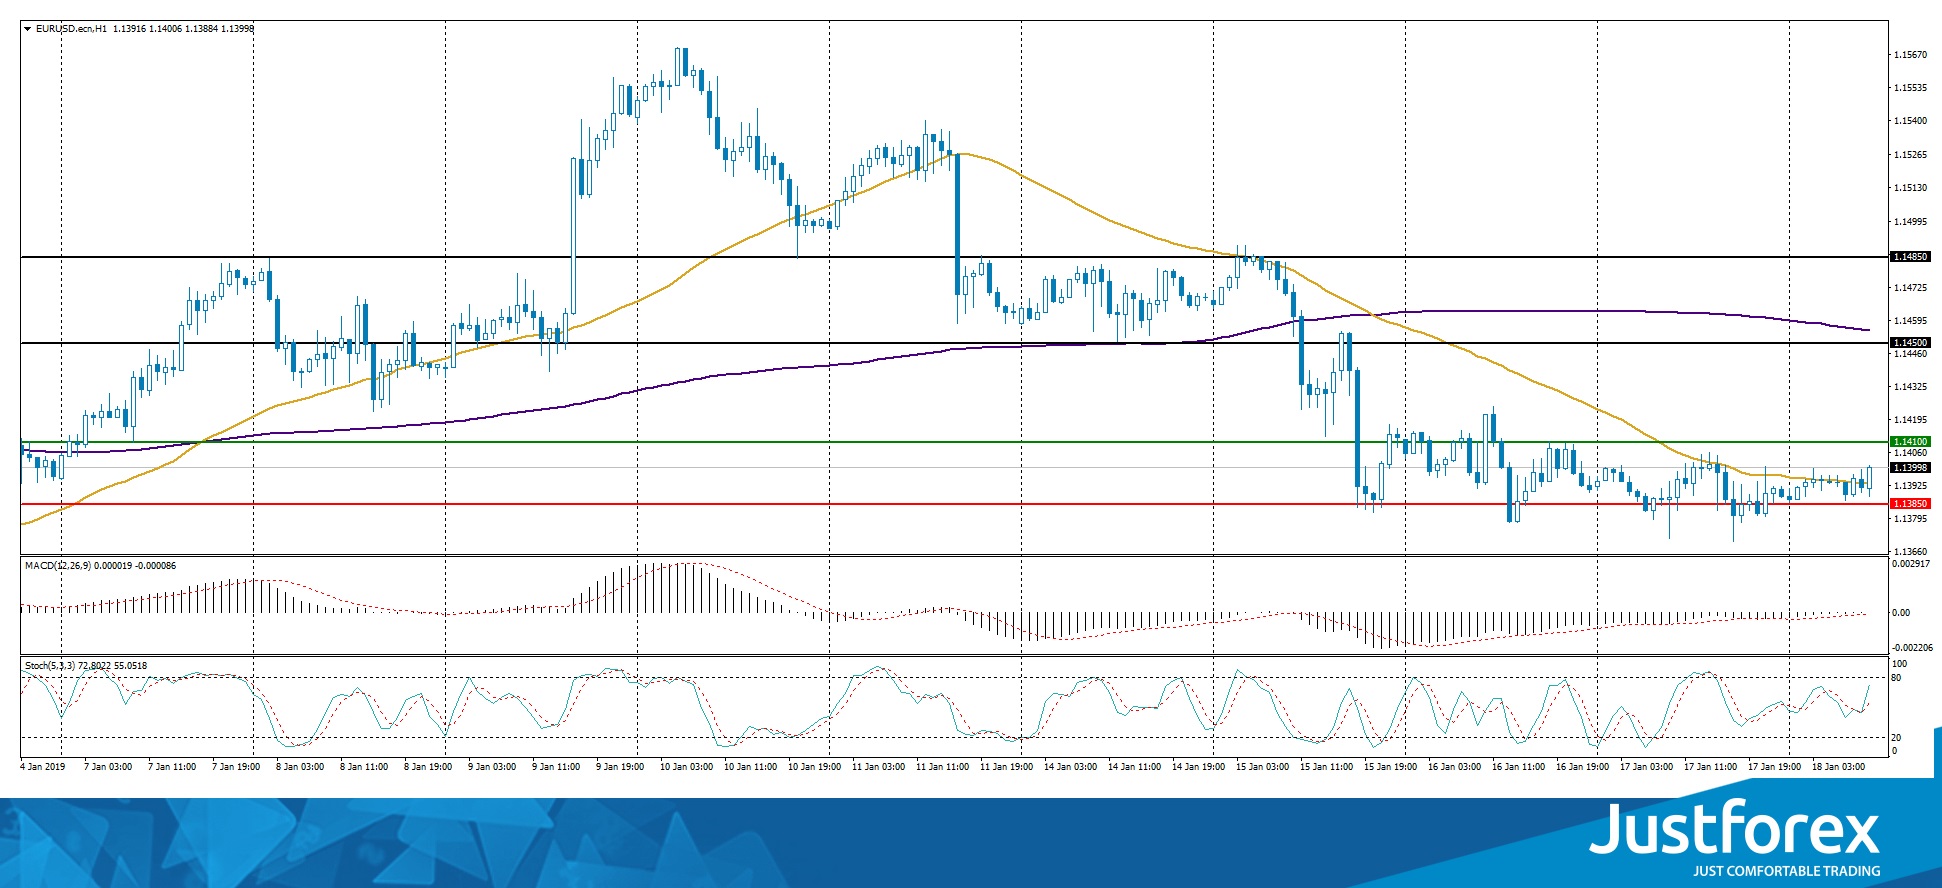
The indicators do not provide precise signals, the price is testing 50 MA.
The MACD histogram is close to 0.
The Stochastic Oscillator is in the neutral zone, the %K line is crossing the %D line. There are no precise signals.
Trading recommendations
Support levels: 1.13850, 1.13500
Resistance levels: 1.14100, 1.14500, 1.14850
If the price fixes above 1.14100 expect the quotes to grow toward 1.14500-1.14700.
Alternatively the quotes can fall toward 1.13500-1.13300.
The GBP/USD currency pair
Technical indicators of the currency pair:
Prev Open: 1.28775
Open: 1.29845
% chg. over the last day: +0.78
Day’s range: 1.29368 – 1.29473
52 wk range: 1.2438 – 1.4378
Yesterday the GBP/USD was in a bullish mood. The quotes grew by more than 100 points. Right now the quotes started to correct. The key levels are 1.29200 and 1.29700, you should open positions from these levels. The trading instrument has a tendency to descend.
The Economic News Feed for 18.01.2019:
Retail Sales Volume Report (UK) – 11:30 (GMT+2:00);
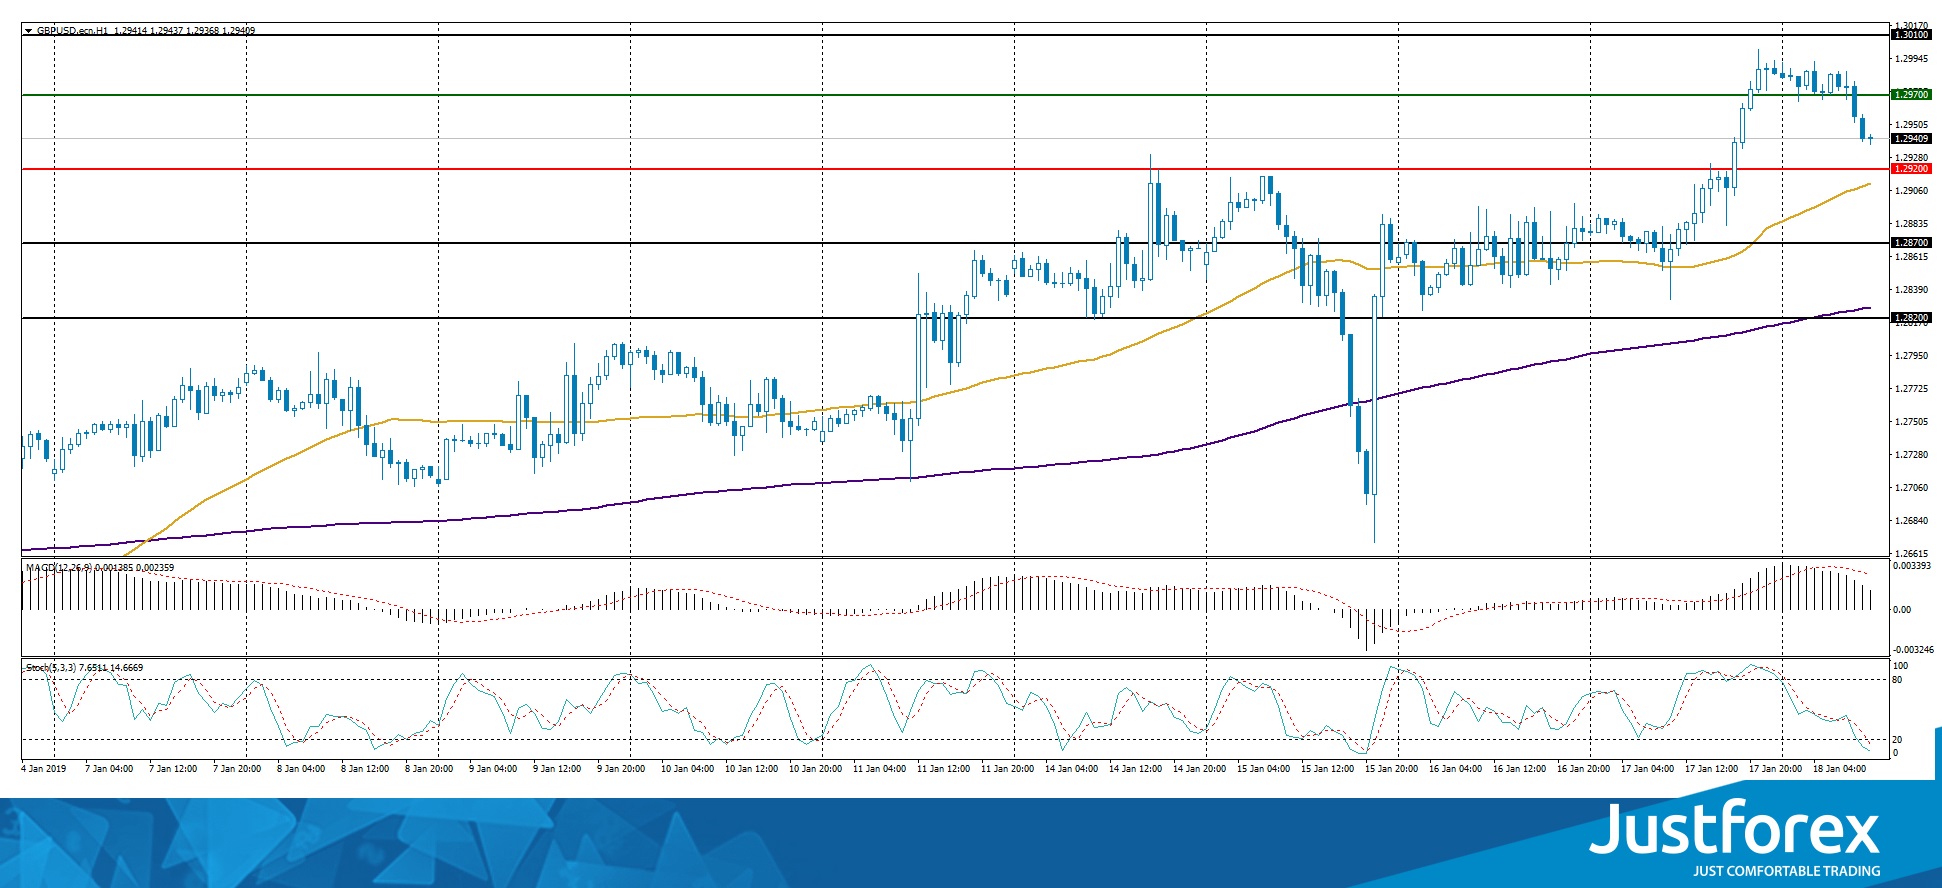
The price fixed above 50 and 200 MA which points to the power of the buyers.
The MACD histogram is in the positive zone but below the signal line, which gives a weak signal to buy GBP/USD.
The Stochastic Oscillator is in the oversold zone, the %K line is below the %D line, which points toward a bearish mood.
Trading recommendations
Support levels: 1.29200, 1.28700, 1.28200
Resistance levels: 1.29700, 1.30100
If the price fixes above 1.29700 you should look for the market entry points to open long positions. The movement will tend toward 1.30100-1.30300.
Alternatively the quote can fall toward 1.28700-1.28500.
The USD/CAD currency pair
Technical indicators of the currency pair:
Prev Open: 1.32530
Open: 1.32740
% chg. over the last day: +0.20
Day’s range: 1.32769 – 1.32880
52 wk range: 1.2248 – 1.3664
USD/CAD currently has a variety of trends. Investors are waiting for additional drivers. The key levels are 1.32500 and 1.32850. You should open positions from these levels. Keep in mind the US News Feed.
The Economic News Feed for 18.01.2019:
Basic Cusomer Price Index (CAD) – 15:30 (GMT+2:00);
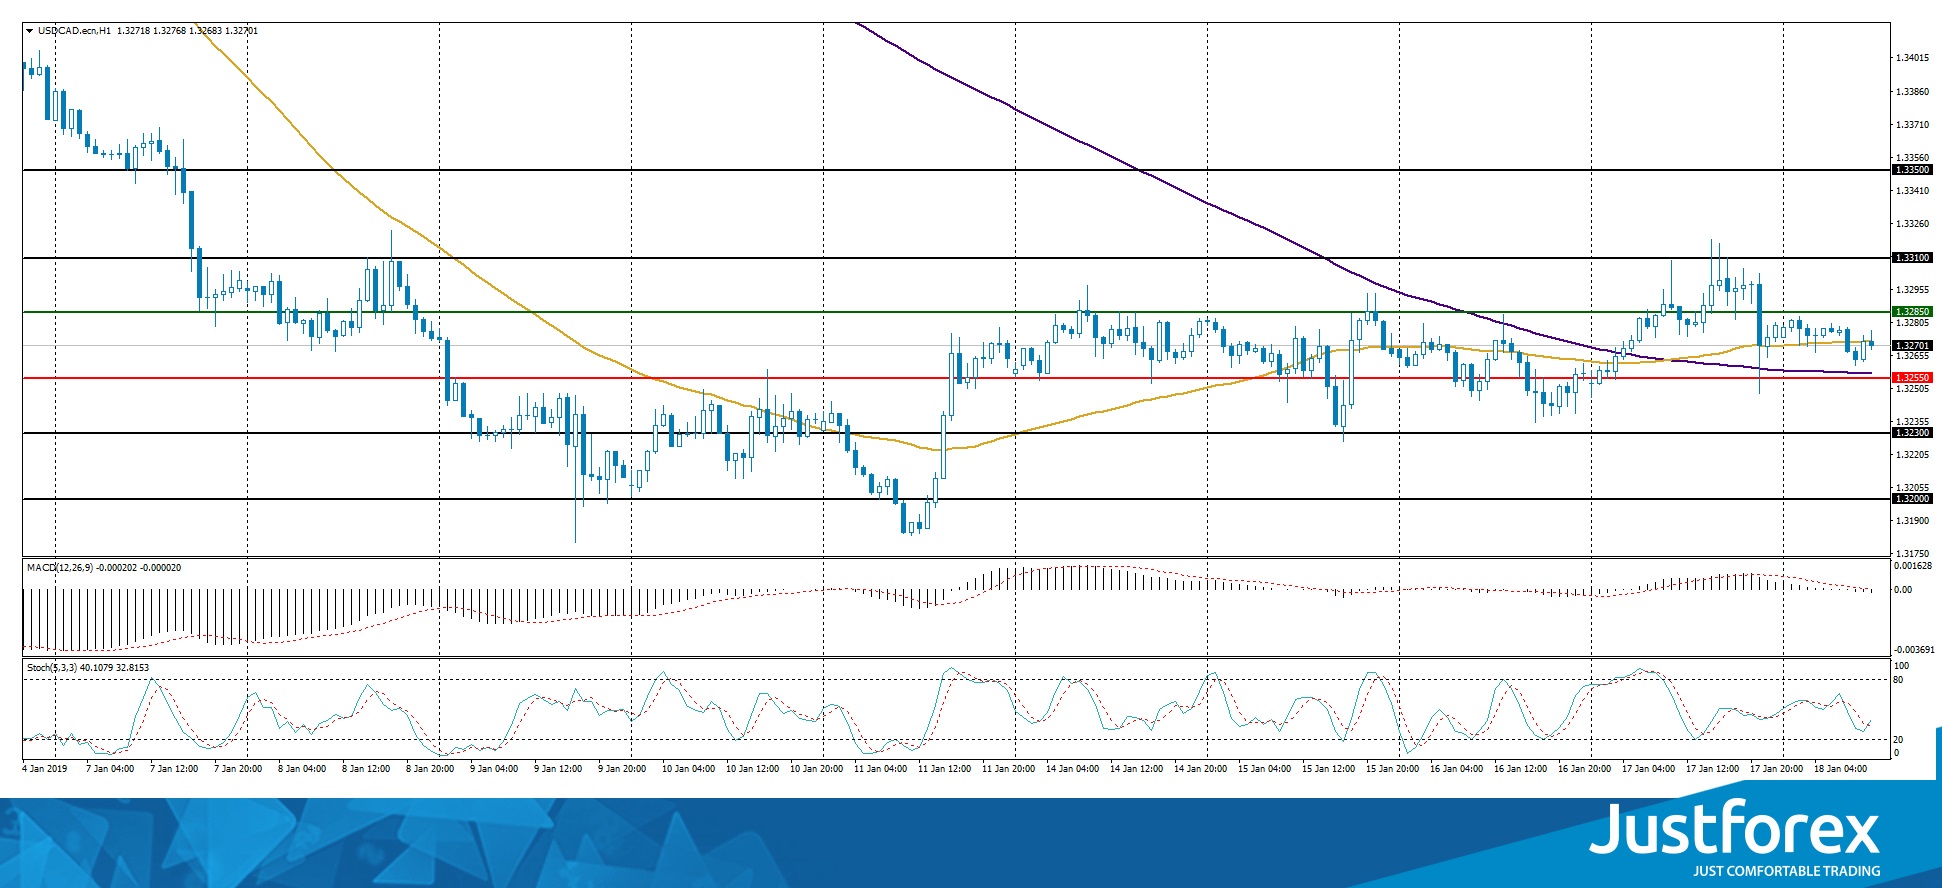
The indicators do not provide precise signals, the price is testing 50 MA.
The MACD histogram is close to 0.
The Stochastic Oscillator is in the neutral zone, the %K line is crossing the %D line. There are no precise signals.
Trading recommendations
Support levels: 1.32550, 1.32300, 1.32000
Resistance levels: 1.32850, 1.33100, 1.33500
If the price fixes above 1.32850 expect the quotes to grow toward 1.33100-1.33300.
Alternatively the quotes can fall toward 1.32300-1.32000.
The USD/JPY currency pair
Technical indicators of the currency pair:
Prev Open: 109.102
Open: 109.212
% chg. over the last day: +0.05
Day’s range: 109.462 – 109.596
52 wk range: 104.56 – 114.56
USD/JPY is in a bullish mood. During the last two days the quotes grew by 70 points. Right now the key levels are 109.350 and 109.650. You should open positions from these leves. A technical correction is possible soon.
The Economic News Feed for 18.01.2019 is calm.
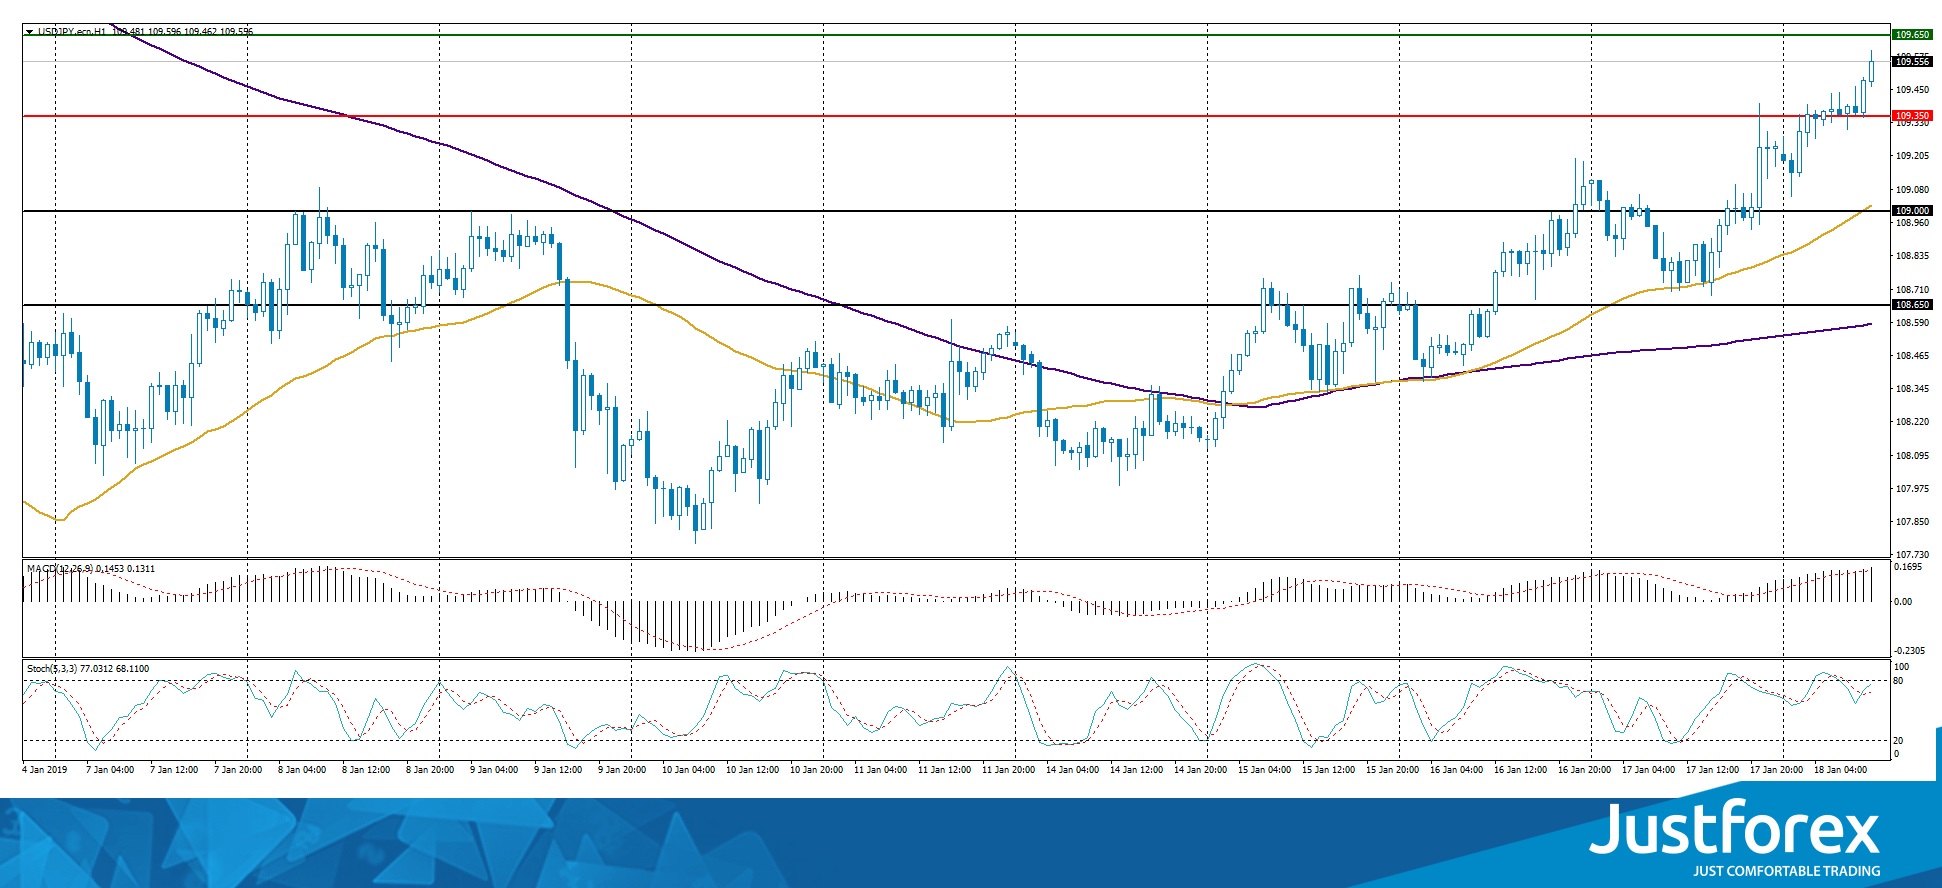
The price fixes above 50 MA and 200 MA which points to the power of the buyers.
The MACD histogram is in the positive zone above the signal line, which gives a strong signal to buy USD/JPY.
The Stochastic Oscillator is in the neutral zone, the %K line is crossing the %D line. There are no signals.
Trading recommendations
Support levels: 109.350, 109.000, 108.650
Resistance levels: 109.650, 110.00
If the price fixes below 109.350 expect the quotes to correct toward 109.000-108.650.
Alternatively the quotes can grow toward the round 110.000.


