
The EUR/USD currency pair
Technical indicators of the currency pair:
Prev Open: 1.14511
Open: 1.14355
% chg. over the last day: -0.17
Day’s range: 1.14121 – 1.14405
52 wk range: 1.1214 – 1.2557
EUR/USD is in a bearish mood. The USD is supported by the positive bond yield dynamics. The quotes are testing 1.14100 local support with 1.14400 acting as a mirror resistance. The trading instrument has prospects for further growth. Investors are waiting for an array of reports. You should open positions from the key levels.
The Economic News Feed for 05.02.2019:
Business Activity Report (EU) – 11:00 (GMT+2:00);
Non-Industrial PMI by ISM (US) – 17:00 (GMT+2:00);
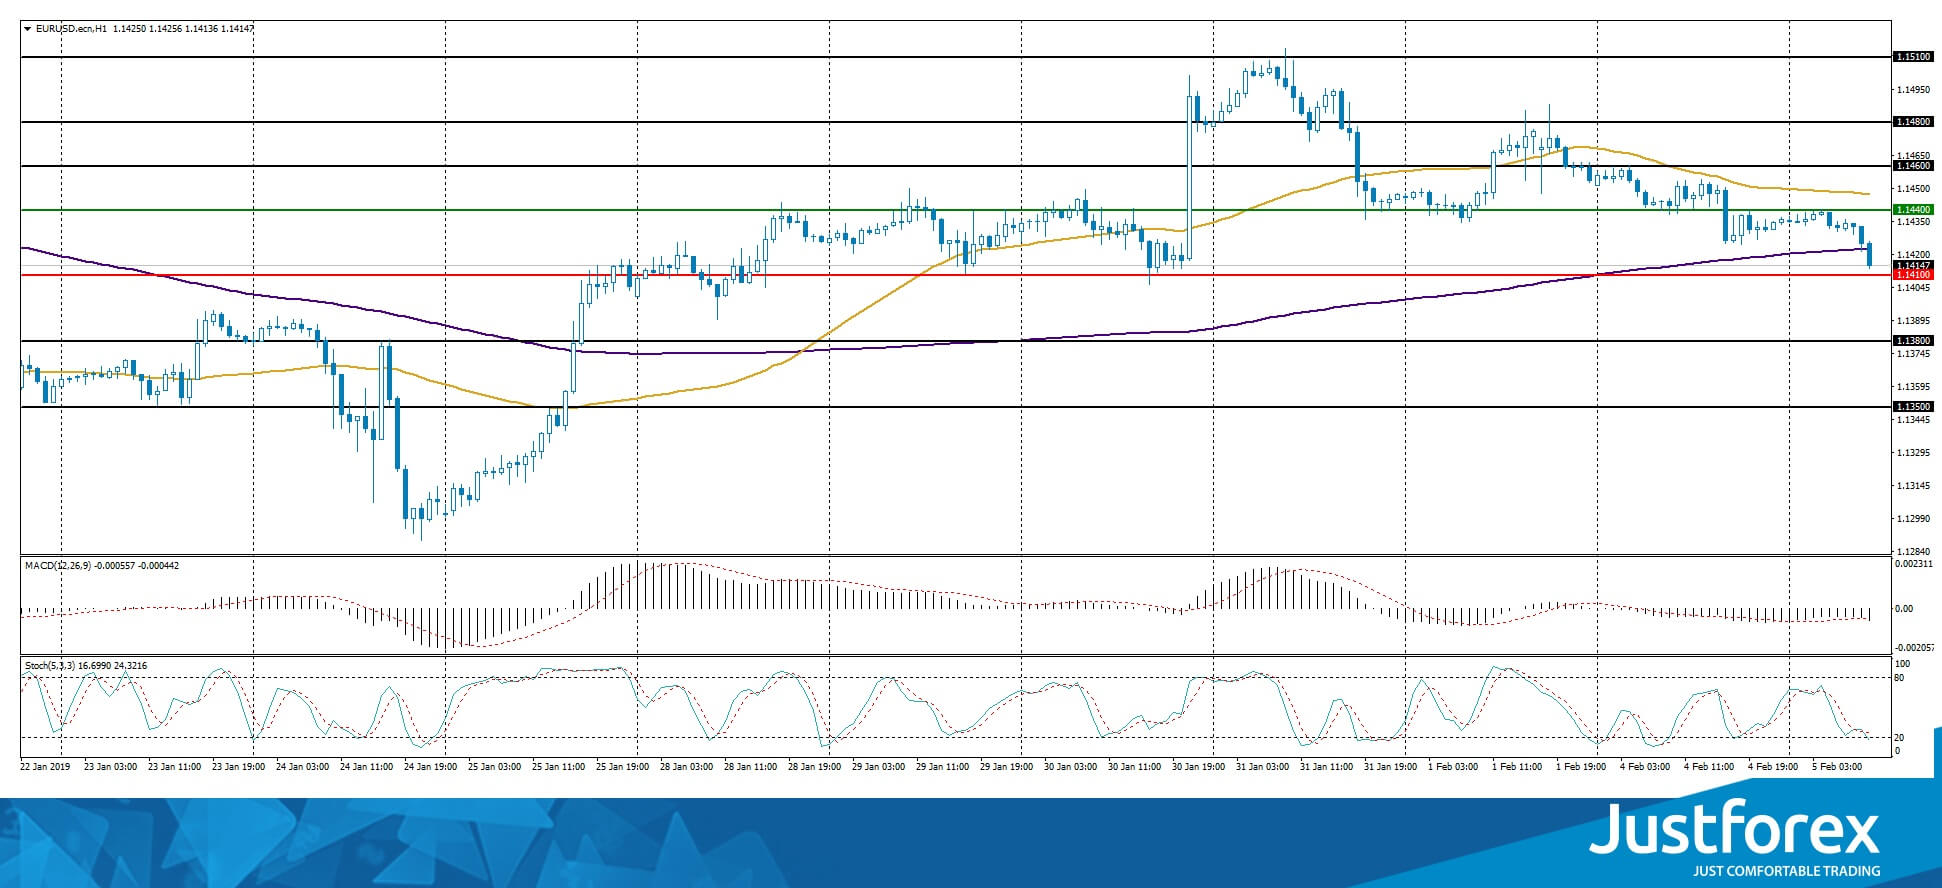
Indicators do not provide precise signals, the price has crossed 50 MA
The MACD histogram is in the negative zone and keeps descending, sending a strong signal yo sell EUR/USD.
The Stochastic Oscillator is near the oversold zone, the %K line is crossing the %D line. There are no signals at the moment.
Trading recommendations
Support levels: 1.14100, 1.13800, 1.13500
Resistance levels: 1.14400, 1.14600, 1.14800
If the price fixes below 1.14100 expect the EUR/USD quotes to descend further toward 1.13800-1.13500.
Alternatively, the quotes can grow toward 1.14600-1.14800.
The GBP/USD currency pair
Technical indicators of the currency pair:
Prev Open: 1.30612
Open: 1.30360
% chg. over the last day: -0.38
Day’s range: 1.30266 – 1.30511
52 wk range: 1.2438 – 1.4378
GBP/USD remains in a long flat. The GBP is under pressure due to weak reports on business activity in the UK. GBP/USD is consolidating around 1.30150-1.30550 with further descent prospects. Keep an eye on Brexit and open positons from the key levels.
At 11:30(GMT+2:00) the UK will publish a service industry PMI.
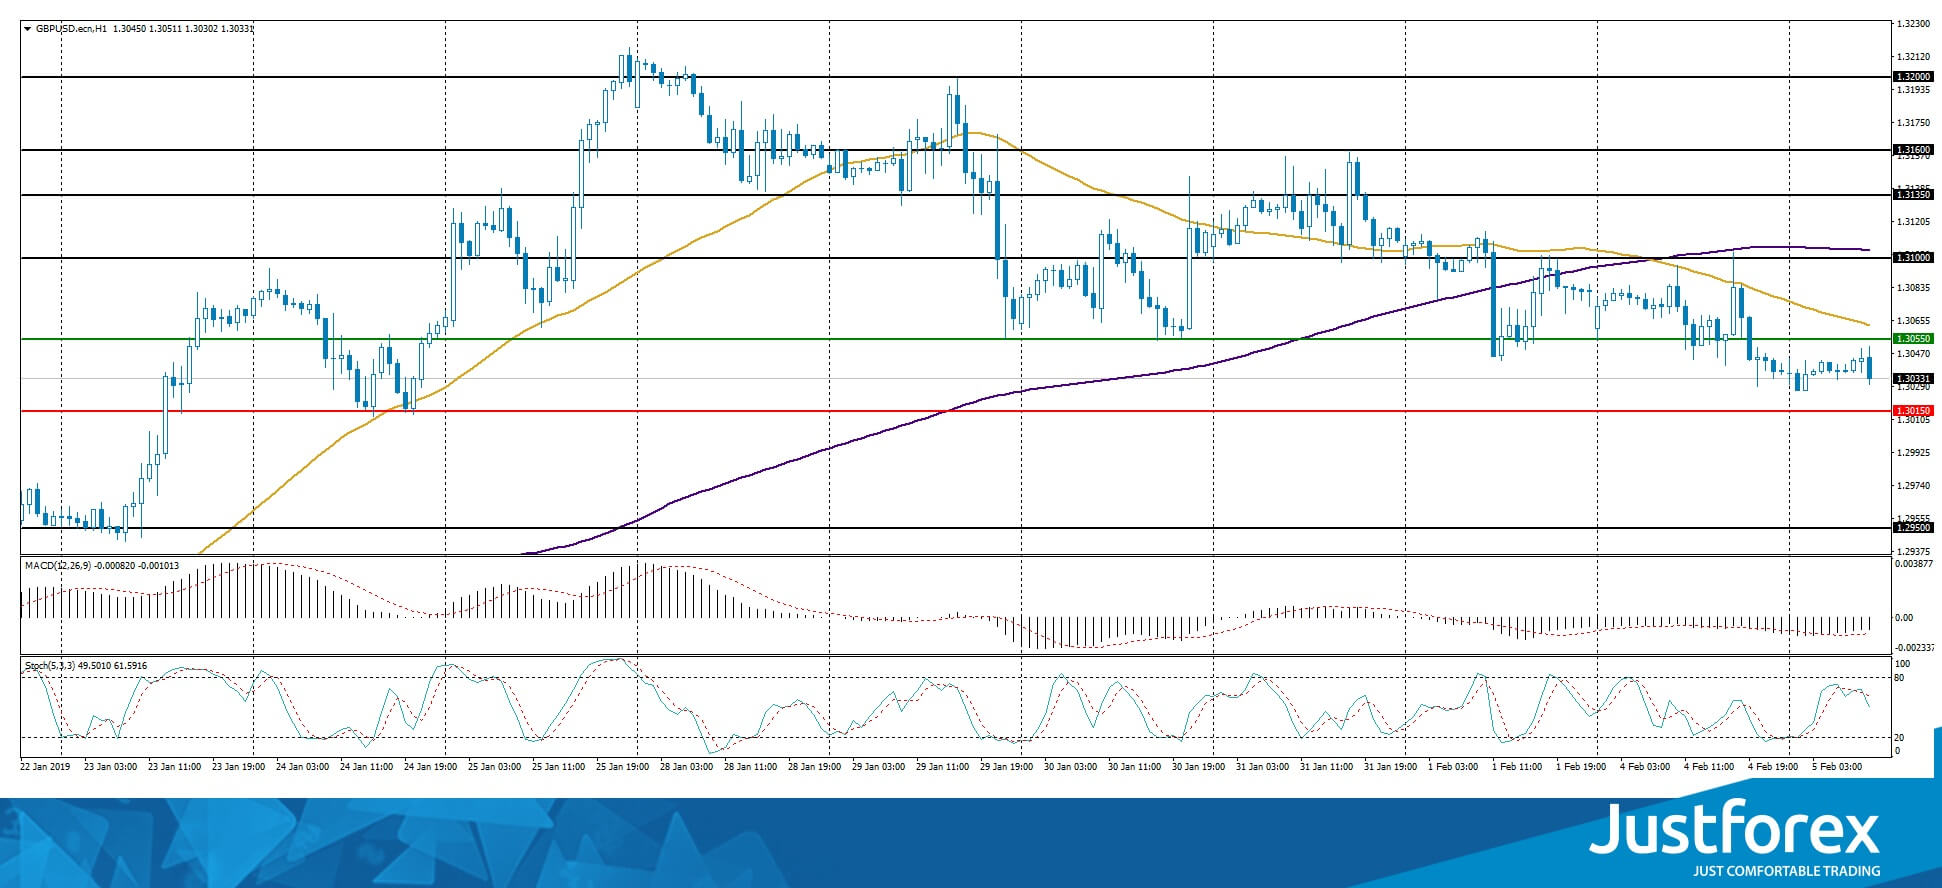
The price fixed below 50 MA and 200 MA which points to the power of the sellers.
The MACD histogram is in the negative zone but above the signal line, which gives a weak signal to sell GBP/USD.
The Stochastic Oscillator is in the neutral zone, the %K line is crossing the %D line. There are no signals at the moment.
Trading recommendations
Support levels: 1.30150, 1.29500
Resistance levels: 1.30550, 1.31000, 1.31350
If the price fixes below the local support of 1.30150 expect the quotes to fall toward 1.29750-1.29500.
Alternatively the quotes can grow toward the round 1.31000.
The USD/CAD currency pair
Technical indicators of the currency pair:
Prev Open: 1.30891
Open: 1.31112
% chg. over the last day: +0.08
Day’s range: 1.31022 – 1.31211
52 wk range: 1.2248 – 1.3664
The CAD stabilized. USD/CAD are moving in a flat. The key support and resistance levels are 1.31000 and 1.31350. A technical correction is possible after a long fall. Keep an eye on the US news feed and open positions from the key levels.
The Economic News Feed for 05.02.2019:
Trading Balance Report (CAD) – 15:30 (GMT+2:00).
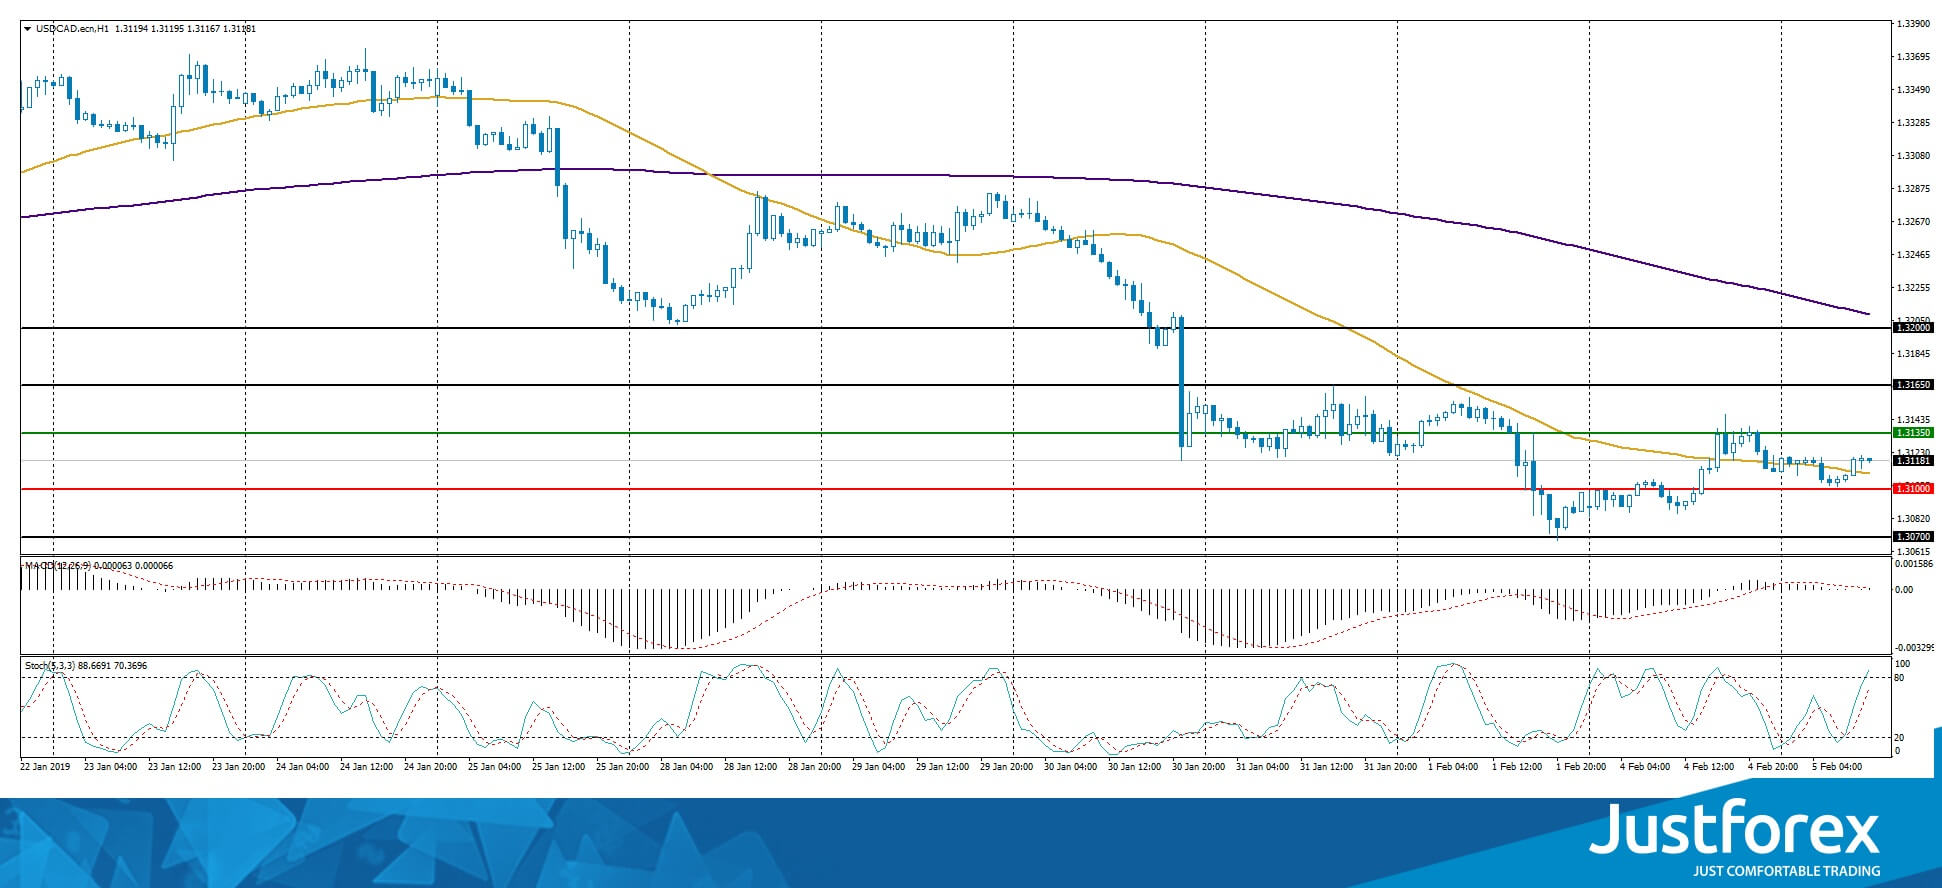
The indicators do not provide precise signals, the price has crossed 50 MA.
The MACD histogram is close to 0.
The Stochastic Oscillator is in the neutral zone, the %K line is above the %D line, which points towards a correction of USD/CAD.
Trading recommendations
Support levels: 1.31000, 1.30700
Resistance levels: 1.31350, 1.31650, 1.32000
If the price fixes above 1.31350 expect the USD/CAD quotes to correct toward 1.31650-1.32000.
Alternatively the quotes can fall toward 1.30700-1.30500.
The USD/JPY currency pair
Technical indicators of the currency pair:
Prev Open: 109.513
Open: 109.858
% chg. over the last day: +0.48
Day’s range: 109.779 – 110.040
52 wk range: 104.56 – 114.56
USD/JPY is consolicating after a significant rally at the beginning of the month. The key levels are 109.800 and 110.100. The USD is supported by the positive Treasury bonds yield dynamic. The quotes have a potential to grow further. Keep an eye on the US economic reports.
The Economic News Feed for 05.02.2019 is calm.
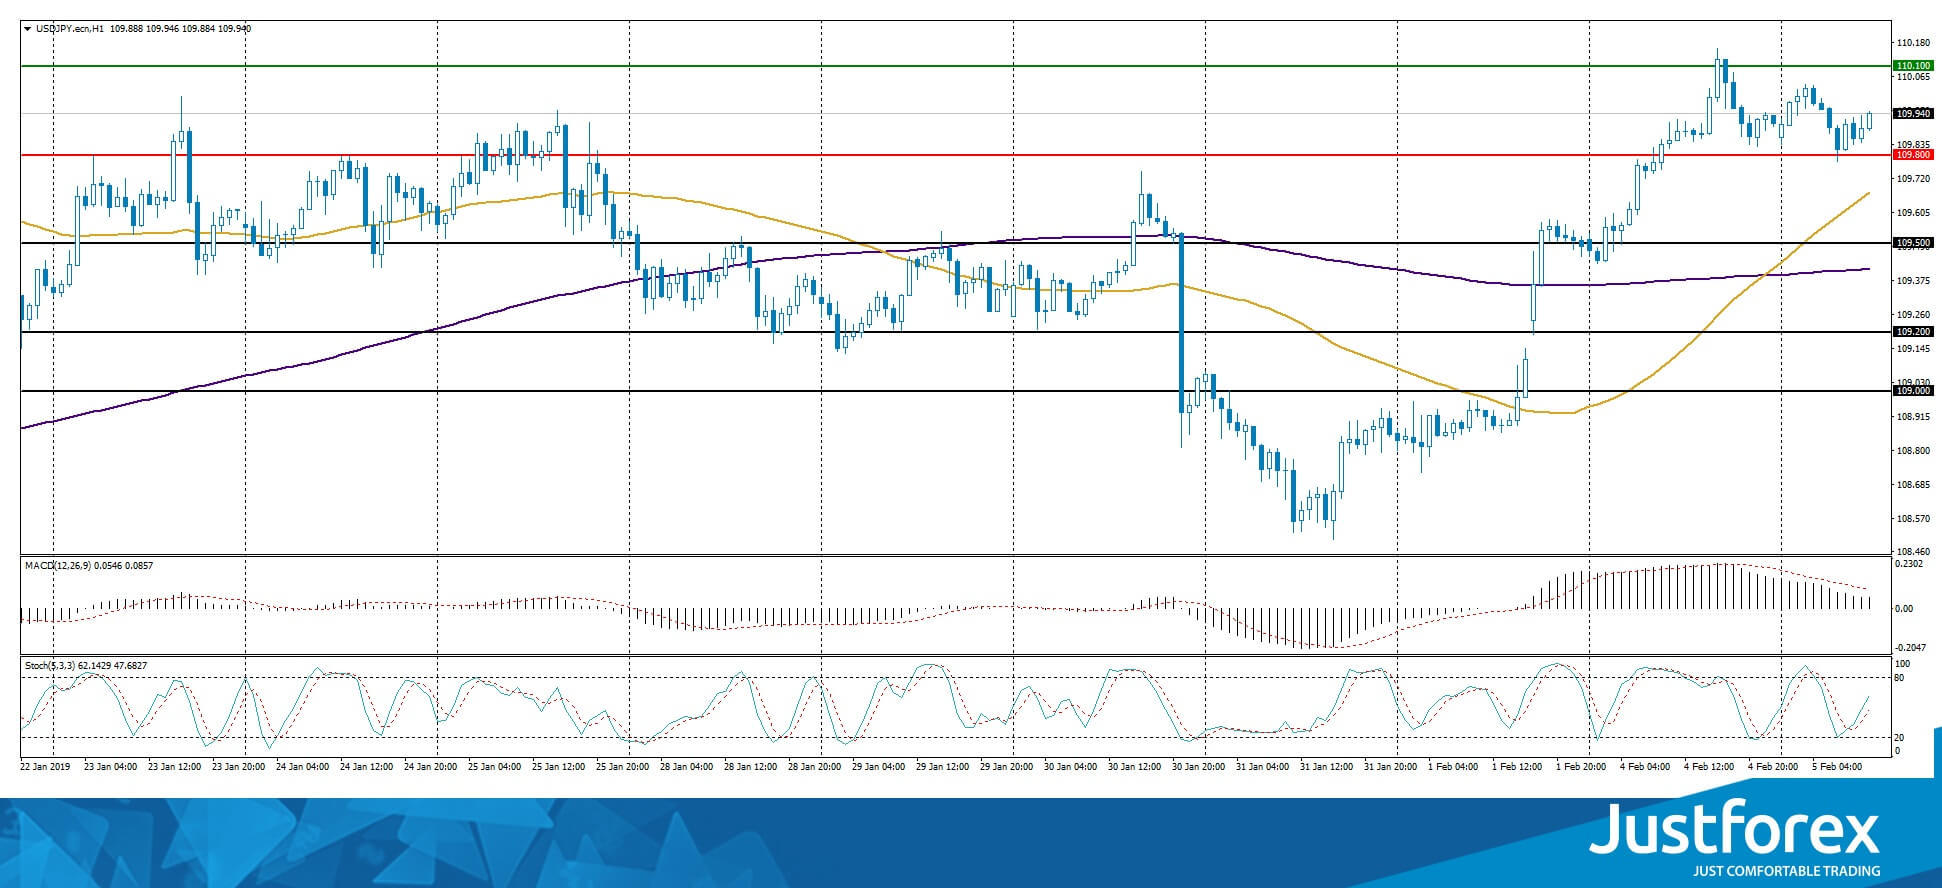
The price fixed above 50 MA and 200 MA which points to the power of the buyers.
The MACD histogram is in the positive zone but below the signal line, which gives a weak signal to sell USD/JPY.
The Stochastic Oscillator is in the neutral zone, the %K line is above the %D line which points to a bullish mood.
Trading recommendations
Support levels: 109.800, 109.500, 109.200
Resistance levels: 110.100, 110.500
If the price fixe above 110.100 expect the quotes to grow toward 110.500-110.700.
Alternatively the quotes can descend toward 109.600-109.400.


