Tesla ticker symbol: $ TSLA short-term Elliott wave view suggests that the cycle from 12/7/2018 peak is showing incomplete structure favoring more downside still. Down from that peak, the decline is unfolding as an impulse structure with sub-division of 5 waves structure in lesser degree cycles. When a decline to $279.28 low ended wave (1) in a lesser degree 5 waves structure. Above from there, Tesla corrected the cycle from 1/16/2019 peak ($352) in wave (2) bounce.
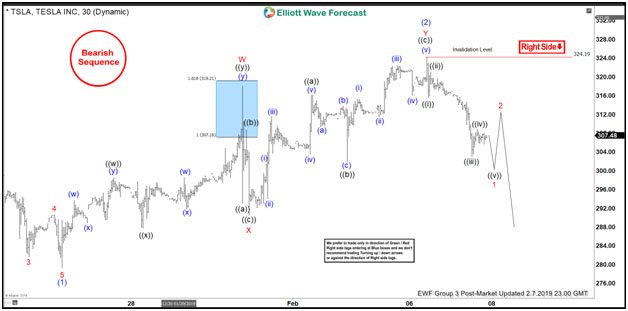
The internals of that bounce unfolded as double three structure with lesser degree cycles showing the sub-division of 3-3-3 corrective structure in each leg. Up from $279.88 low, the initial bounce to $318 peak ended wave W also in lesser degree double three structure. Down from there, a pullback to $290.51 low as zigzag structure. Above from there, a rally to $324.19 high ended wave Y as zigzag structure. And also completed the wave (2) bounce. Near-term, as far as bounces fail below $324.19 high expect Tesla to extend lower in wave (3) lower towards $264.11-$243.39 area lower initially. However, a break below $279.28 low will add more conviction to this bearish view & avoid double correction in wave (2) bounce.
Tesla 1 Hour Elliott Wave Chart