
The EUR/USD currency pair
Technical indicators of the currency pair:
Prev Open: 1.13362
Open: 1.13330
% chg. over the last day: +0.02
Day’s range: 1.13301 – 1.13492
52 wk range: 1.1214 – 1.2557
USD index (#DX) keeps recovering. The investors are waiting for additional drivers. Yesterday the US published ambigous economic reports. At the same time, the American currency was supported by the growth of the 10-year government bonds yield to the weekly maximum. The negotations between the Washington and Beijing remain in the spotlight. Keep an eye on this issue and open positions from the key levels of 1.13250-1.13500.
The Economic News Feed for 22.02.2019:
IFO Business Index (GER) – 11:00 (GMT+2:00);
Consumer Price Index (EU) – 12:00 (GMT+2:00);
Federal Reserve Monetary Policy Report (US) – 18:00 (GMT+2:00);
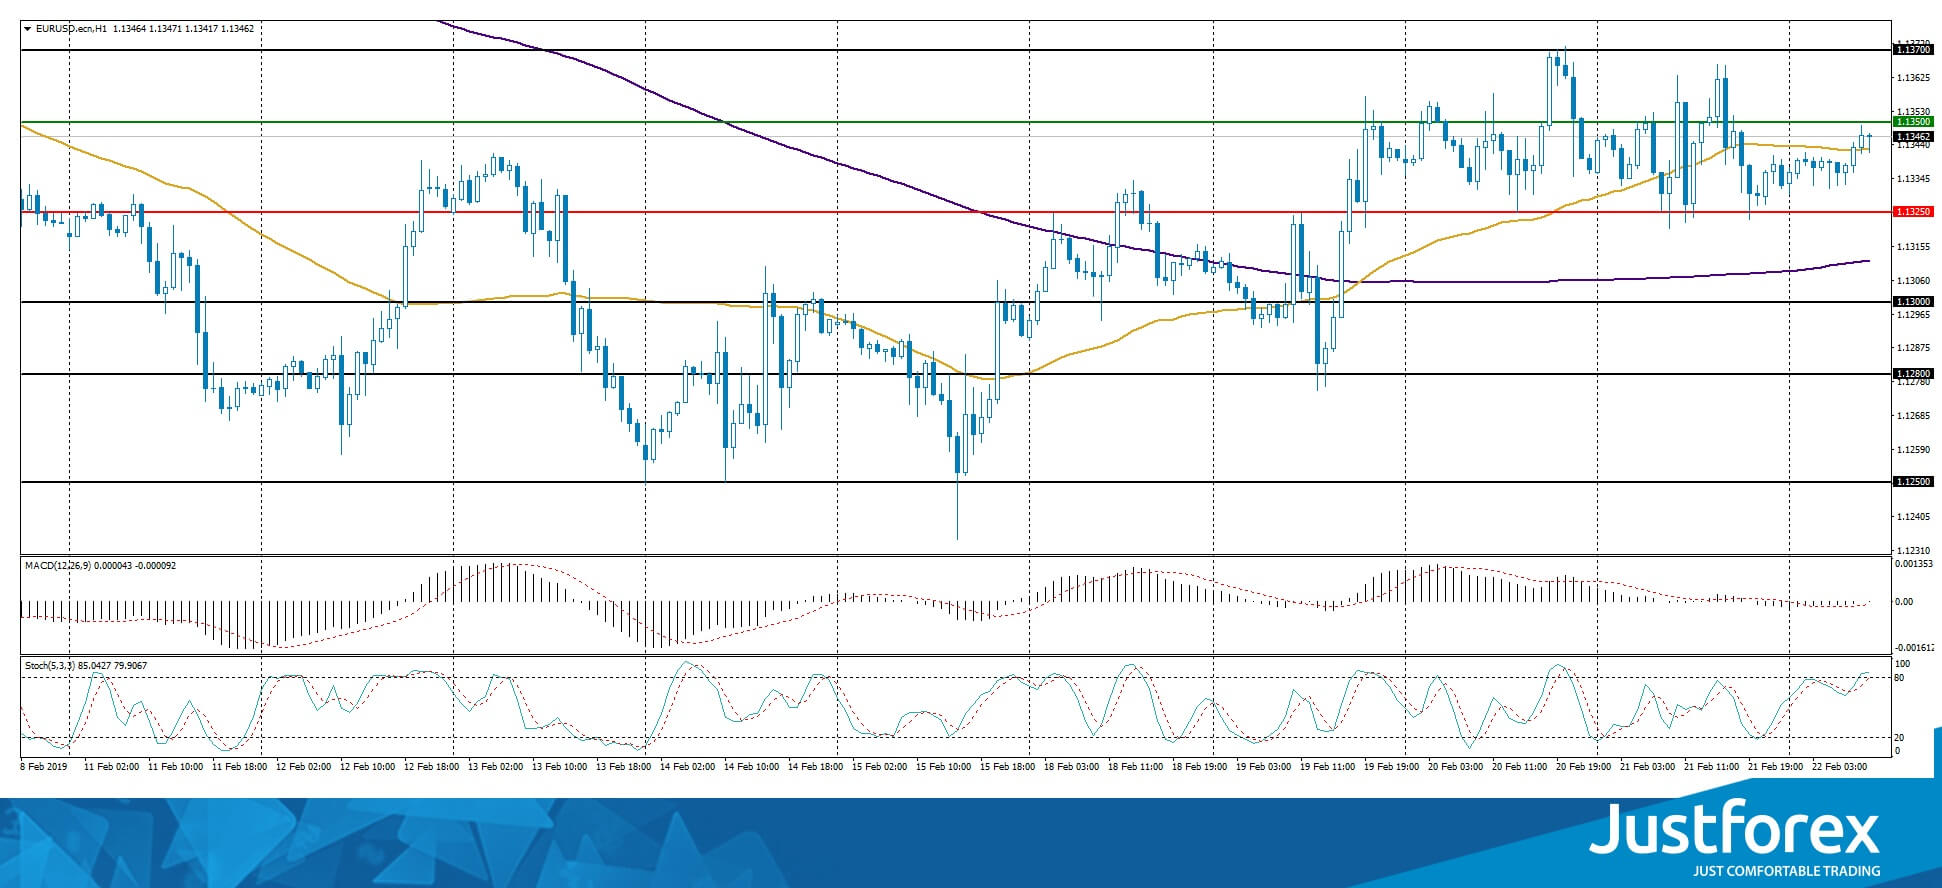
Indincators do not provide precise data, the price has crossed 50 MA.
The MACD histogram is close to 0.
The Stochastic Oscillator is near the overbought zone, the %K line is above the %D line, which gives a weak signal to buy EUR/USD.
Trading recommendations
Support levels: 1.13250, 1.13000, 1.12800
Resistance levels: 1.13500, 1.13700, 1.14000
If the price fixes above 1.13500, expect the quotes to grow toward 1.13700-1.14000.
Alternatively, the quotes can fall toward 1.13000-1.12800.
The GBP/USD currency pair
Technical indicators of the currency pair:
Prev Open: 1.30503
Open: 1.30251
% chg. over the last day: -0.08
Day’s range: 1.30244 – 1.30513
52 wk range: 1.2438 – 1.4378
GBP/USD keeps being traded in a flat. There is no single defined trend. The ambiguousness around Brexit remains, which puts addtional pressure on the GBP. Keep an eye on the relevant data on this subject. The local support and resistance levels are 1.30250 and 1.30750. You should open positions from these levels.
The Economic News Feed for 22.02.2019 is calm.
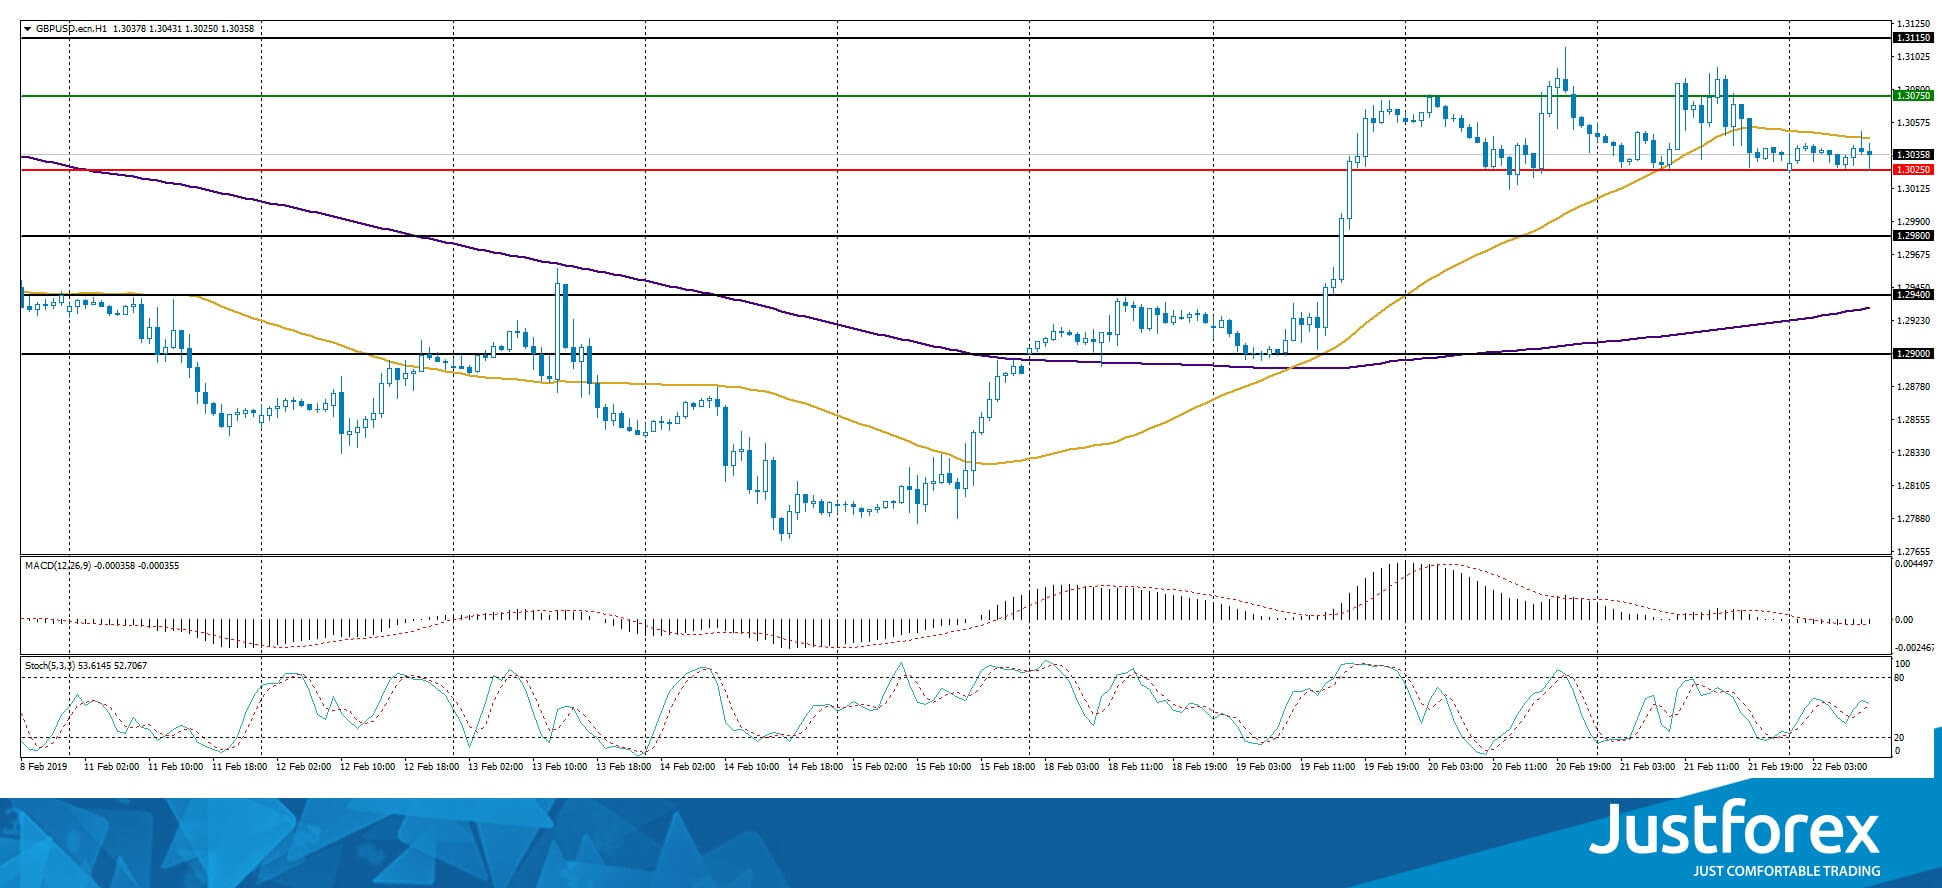
The indicators do not provide precise signals, the price has crossed 50 MA.
The MACD histogram is close to 0.
The Stochastic Oscillator is in the neutral zone, the %K line is crossing the %D line. There are no signals at the moment.
Trading recommendations
Support levels: 1.30250, 1.29800, 1.29400
Resistance levels: 1.30750, 1.31150, 1.31500
If the price fixes above 1.30750, expect the quotes to grow toward 1.31150-1.31400.
Alternatively, the quotes can correct toward 1.29800-1.28600.
The USD/CAD currency pair
Technical indicators of the currency pair:
Prev Open: 1.31752
Open: 1.32252
% chg. over the last day: +0.38
Day’s range: 1.32160 – 1.32419
52 wk range: 1.2248 – 1.3664
Yesterday USD/CAD quotes retreated from the local minimums. The CAD is consolidating around 1.32100-1.32400 with an ambiguous technical picture. The investors are waiting for the retail sales report from Canada. Keep an eye on the oil quotes dynamics. You should open positions from the key levels.
The Economic News Feed for 22.02.2019:
Retail Sales Report (CAD) – 15:30 (GMT+2:00);
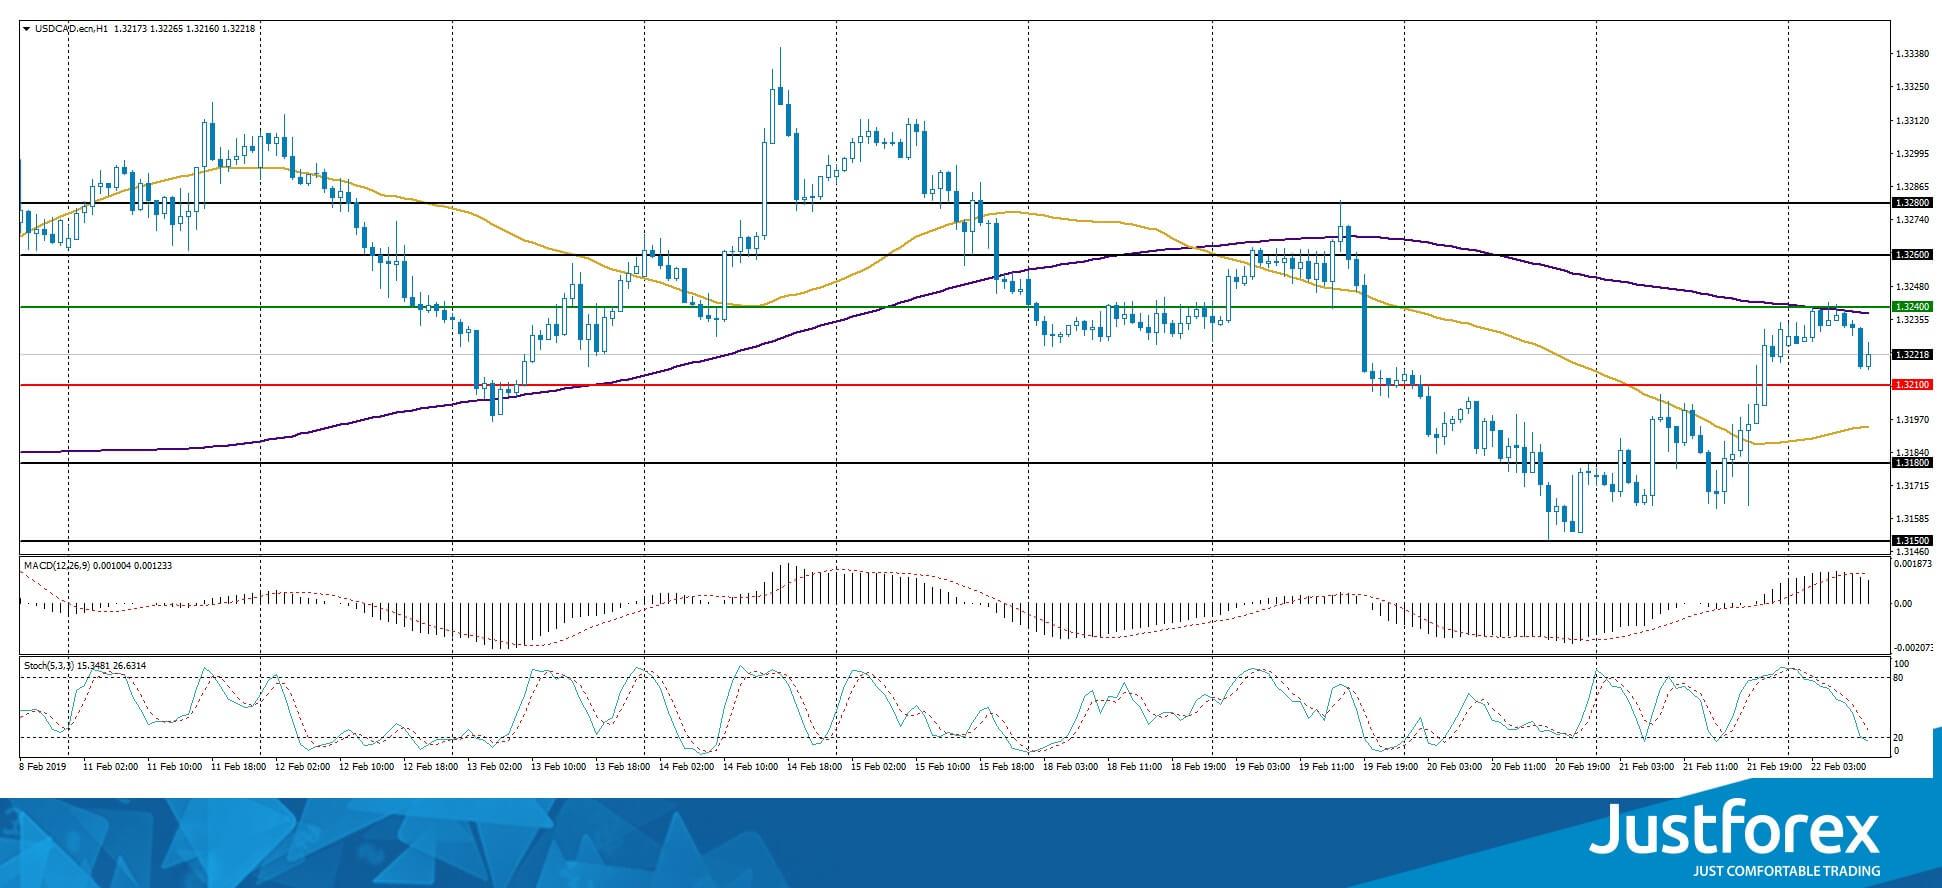
The indicators do not provide precise signals, the price fixed between 50 MA and 200 MA.
The MACD histogram is in the positive zone but below the signal line, which gives a weak signal to buy USD/CAD.
The Stochastic Oscillator is in the neutral zone, the %K line is below the %D line, which points to a bearish mood.
Trading recommendations
Support levels: 1.2248 – 1.3664
Resistance levels: 1.32400, 1.32600, 1.32800
If the price fixes below 1.32100, look for the market entry points to open short positions. The movement will tend toward 1.31800-1.31600.
Alternatively, the quotes can grow toward 1.32600-1.32800.
The USD/JPY currency pair
Technical indicators of the currency pair:
Prev Open: 110.828
Open: 110.689
% chg. over the last day: -0.14
Day’s range: 110.620 – 110.808
52 wk range: 104.56 – 114.56
The safe haven currency keeps trading in a long flat. The technical picture is ambiguous. The USD/JPY quotes are testing the local support and resistance levels at 110.650 and 110.900. Keep an eye on the US Treasury bonds yield. The financial market participants are waiting for news on the US/China trading negotiations.
In January, Japanese national basis index of consumer prices confirmed the forecasts and reached 0.8%
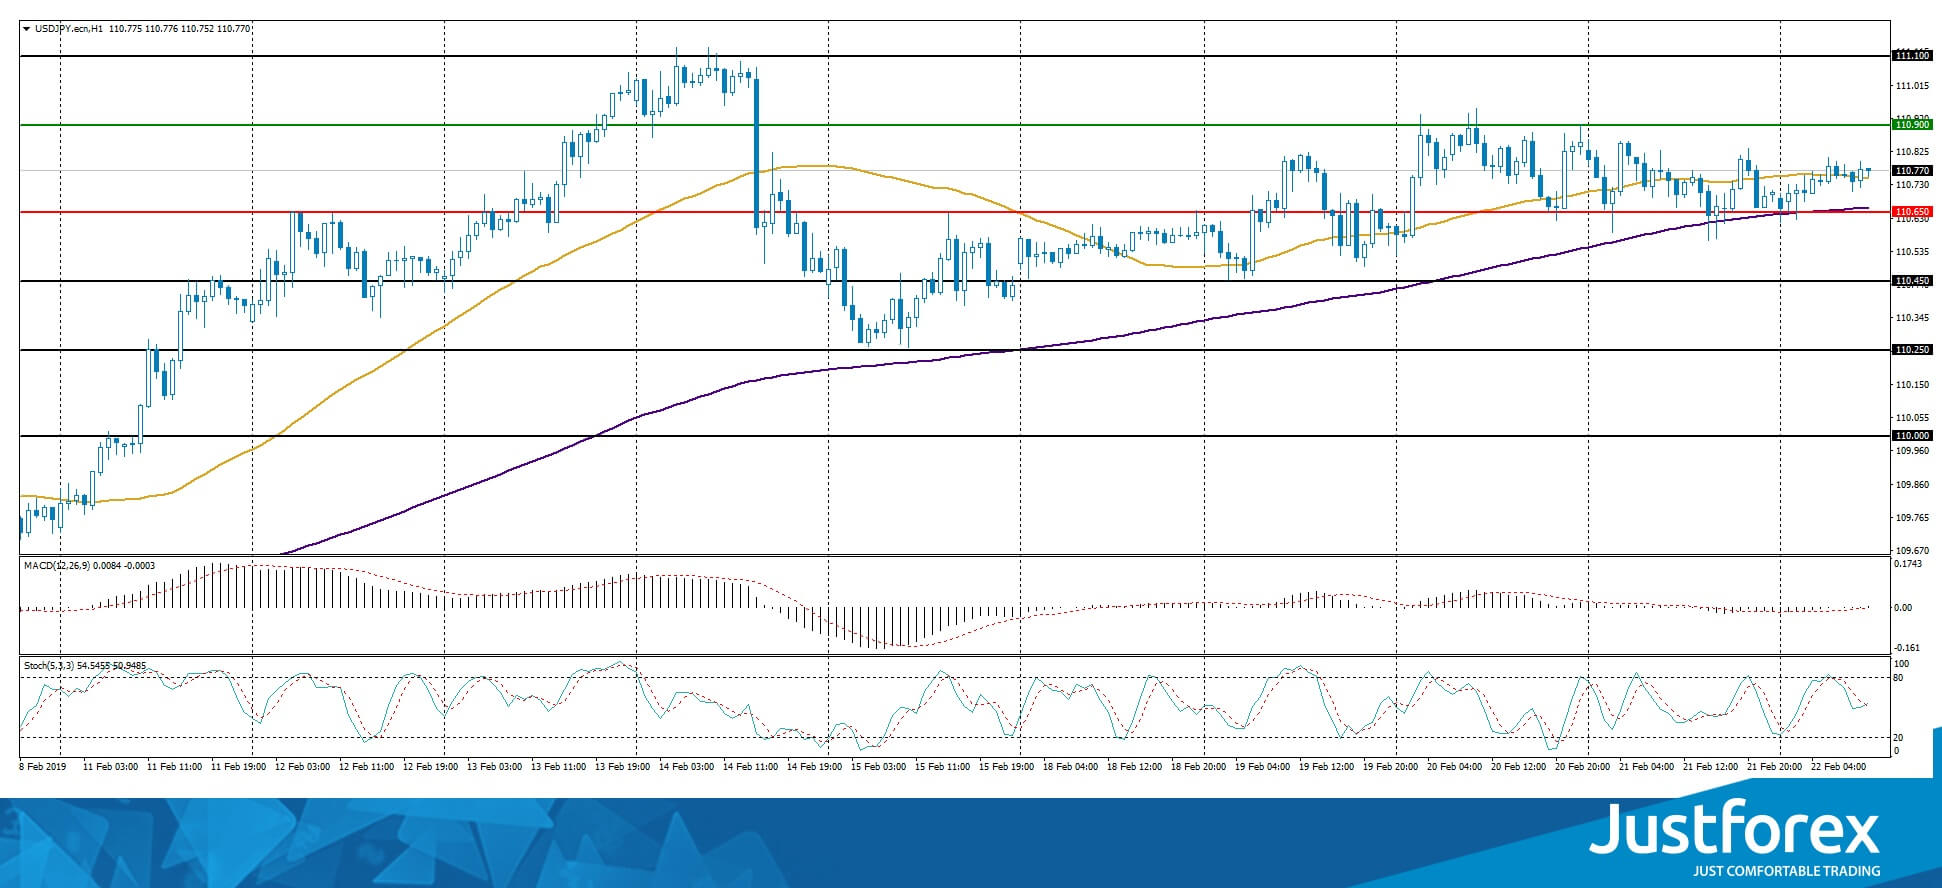
The indicators do not provide precise data, the price has crossed 50 MA and 200 MA.
The MACD histogram is close to 0.
The Stochastic Oscillator is in the neutral zone, the %K line is crossing the %D line. There are no signals at the moment.
Trading recommendations
Support levels: 110.650, 110.450, 110.250
Resistance levels: 110.900, 111.100, 111.500
If the price fixes below the support level of 110.650, expect the quotes to rise toward 110.400-110.200.
Alternatively, the quotes can grow toward 111.100-111.400.


