
The EUR/USD currency pair
Technical indicators of the currency pair:
Prev Open: 1.12615
Open: 1.12732
% chg. over the last day: +0.11
Day’s range: 1.12713 – 1.12874
52 wk range: 1.1214 – 1.2557
Yesterday had a lot of important macroeconomical events and EUR/USD was traded very actively. There was o single defined trend, however. The ECB kept the monetary policy, as was expected. Mario Draghi mentioned the growing risks in the EU economy but elected to keep the interest rates until the end of the year. The FOMC Minutes confirmed the dowish position of Federal Reserve. The basis consumer index of the US customer prices was 0.1%, which is lower than expected 0.2%.
The key support and resistance levels are 1.12650 and 1.12850. The quotes can grow further. Today you should evaluate all the reports coming from the US and open positions from the key levels.
The Economic News Feed for 11.04.2019:
Number of Unemployment Benefits Applications (US) – 15:30 (GMT+3:00);
Manufacturer’s Price Index (US) – 15:30 (GMT+3:00);
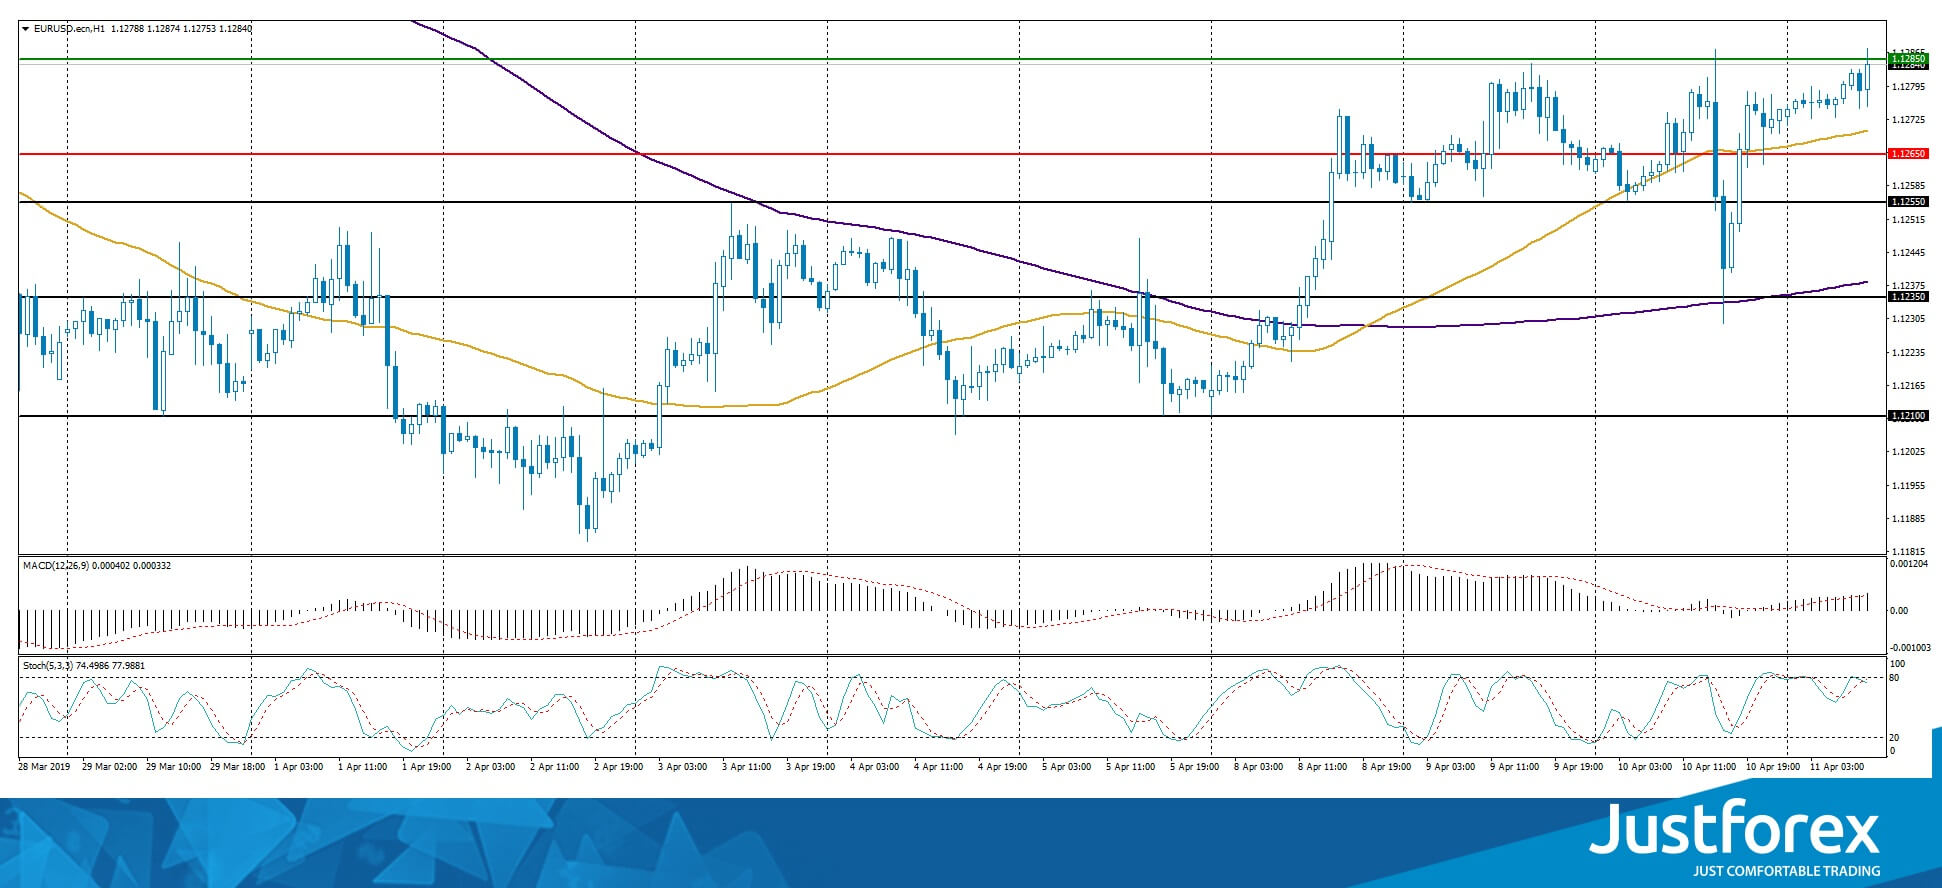
The price fixed above 50 MA and 200 MA which points to the power of the buyers.
The MACD histogram is in the positive zone and keeps rising which points to further growth of EUR/CAD.
The Stochastic Oscillator is near the overbought zone, the %K line is crossing the %D line. There are no signals.
Trading recommendations
Support levels: 1.12650, 1.12550, 1.12350
Resistance levels: 1.12850, 1.13000, 1.13400
If the price fixes above 1.12850, expect the quotes to rise toward 1.13250-1.13500.
Alternatively, the quotes can descend toward 1.12500-1.12350.
The GBP/USD currency pair
Technical indicators of the currency pair:
Prev Open: 1.30474
Open: 1.30828
% chg. over the last day: +0.27
Day’s range: 1.30778 – 1.31089
52 wk range: 1.2438 – 1.4378
GBP/USD was in a bullish mood yesterday. The EU leaders agreed to postpone Brexit for 12 months. GBP is additionally supported by the positive GDP results and the growing industrial production volume. Right now the quotes are consolidating at 1.30750-1.31200. You should open positions from these levels, the pair is likely to grow further.
The Economic News Feed for 11.04.2019 is calm.
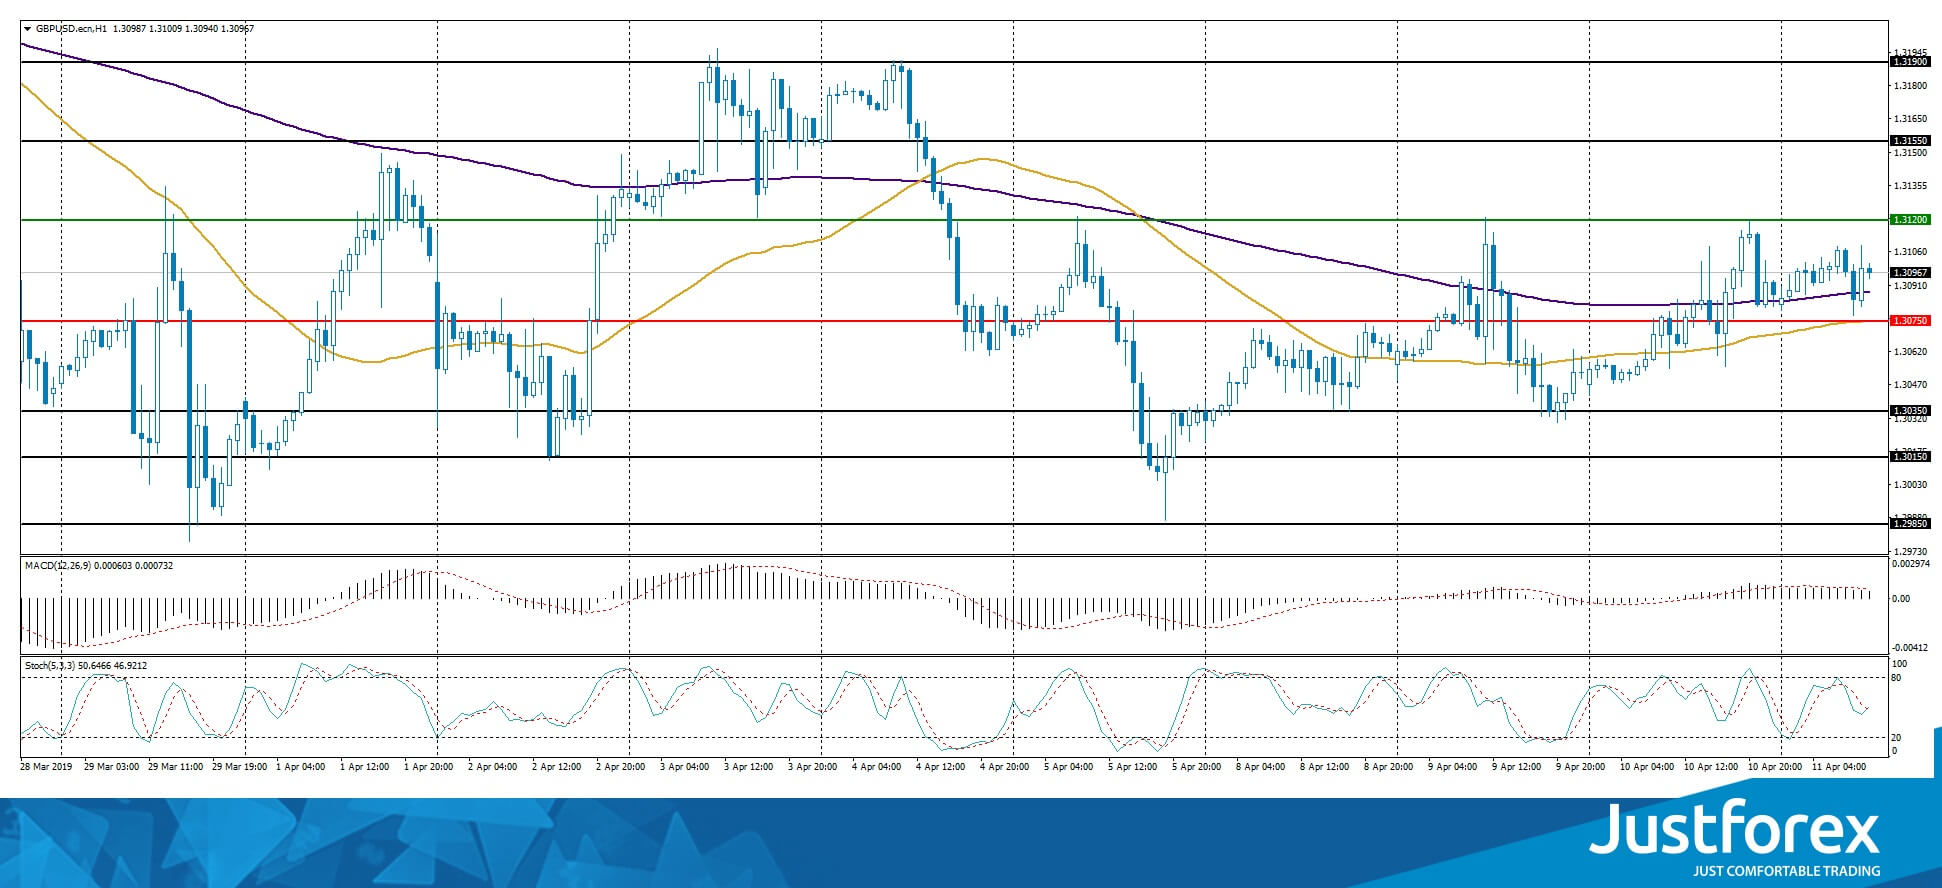
The indicators do not provide precise signals, the price has crossed 50 MA and 200 MA.
The MACD histogram is in the positive zone but below the signal line, which gives a weak signal to buy GBP/USD.
The Stochastic Oscillator is in the neutral zone, the %K line is crossing the %D line. There are no signals at the moment.
Trading recommendations
Support levels: 1.30750, 1.30350, 1.30150
Resistance levels: 1.31200, 1.31550, 1.31900
If the price fixes above 1.31200, expect the quotes to rise toward 1.31500-1.31700.
Alternatively, the quotes can descend toward 1.30500-1.30300.
The USD/CAD currency pair
Technical indicators of the currency pair:
Prev Open: 1.33207
Open: 1.33107
% chg. over the last day: -0.06
Day’s range: 1.33107 – 1.33564
52 wk range: 1.2248 – 1.3664
USD/CAD is being actively traded as of late. There is no single trend, but the key range is 1.33300-1.33600. You should open positions from these levels and wait for more releases from the US. Keep an eye on the oil quotes dynamics.
The Economic News Feed for 11.04.2019 is calm.
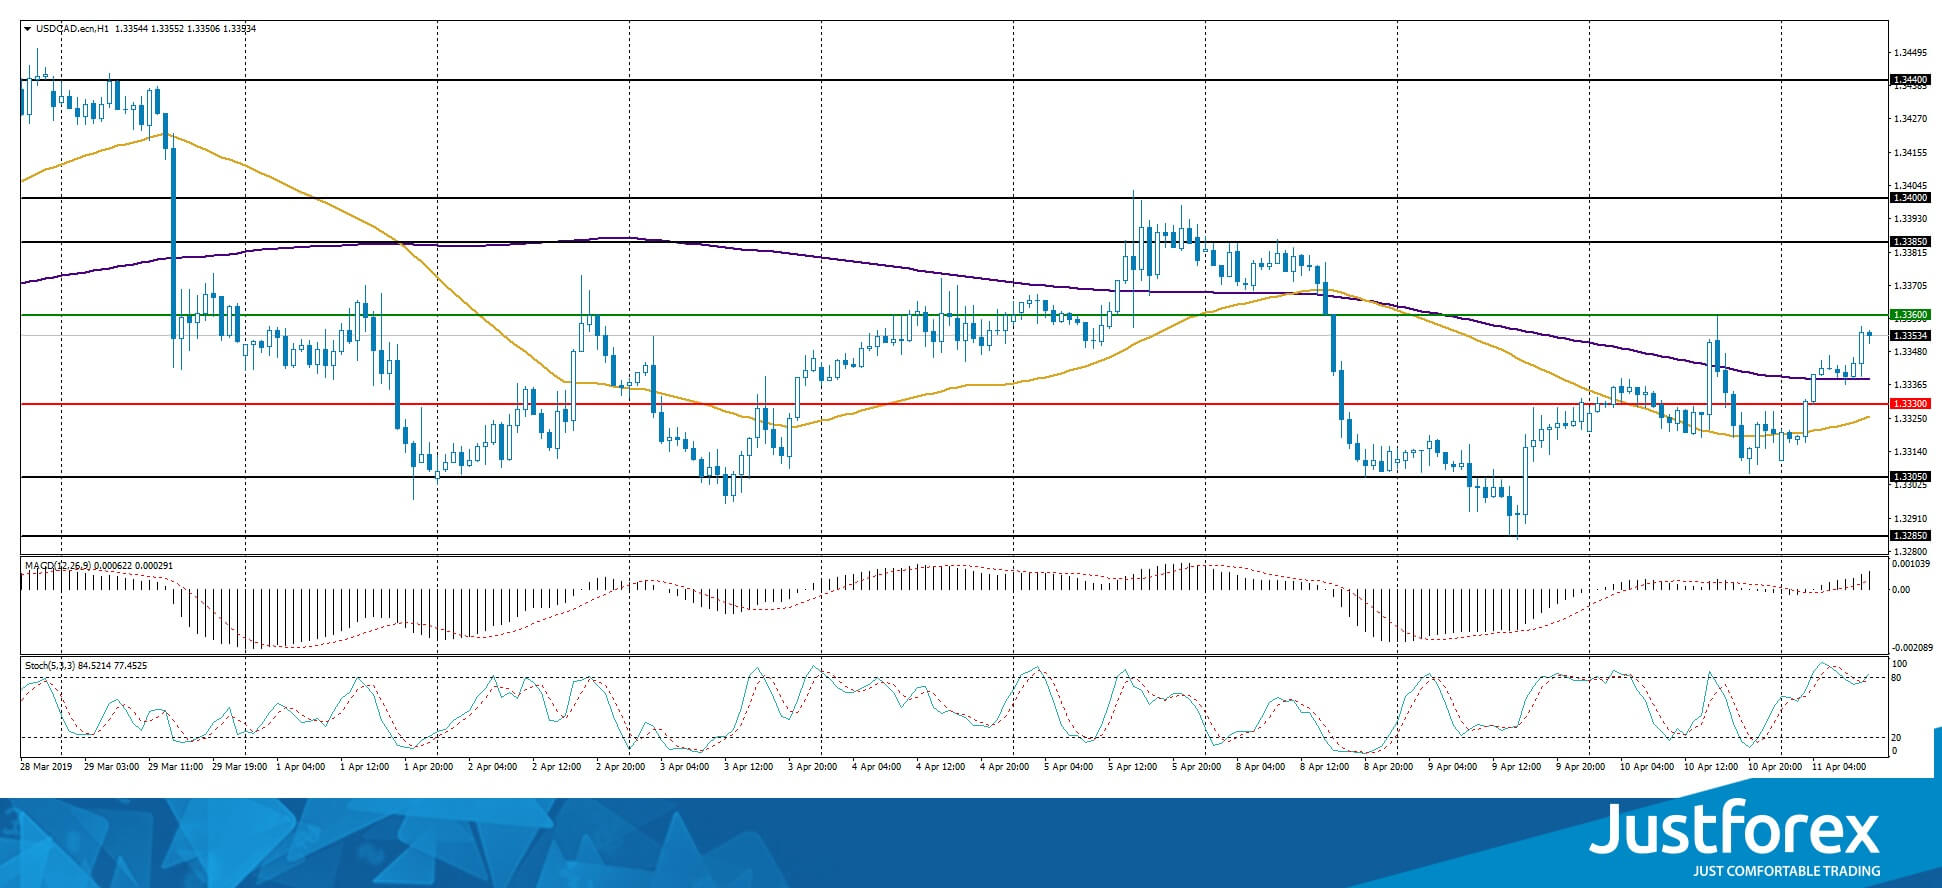
There are no signals, the price is consolidating close to 200 MA.
The MACD histogram is in the positive zone and above the signal line, which points to the bullish mood.
The Stochastic Oscillator is close to the overbought zone, the %K line is crossing the %D line. There are no signals at the moment.
Trading recommendations
Support levels: 1.33300, 1.33050, 1.32850
Resistance levels: 1.33600, 1.33850, 1.34000
If the price fixes above 1.33600, expect the quotes to grow toward 1.33850-1.34000.
Alternatively, the quotes can fall toward the round 1.33000.
The USD/JPY currency pair
Technical indicators of the currency pair:
Prev Open: 111.131
Open: 110.968
% chg. over the last day: -0.14
Day’s range: 110.896 – 111.167
52 wk range: 104.56 – 114.56
USD/JPY has an ambiguous technical picture. The trading instrument is moving sideways. The local support and resistance levels are 111.000 and 111.200. The quotes can descend further. Keep an eye on the economic releases and the US Treasury Bond’s yield. Open the positions from the key levels.
The Economic News Feed for 11.04.2019 is calm.
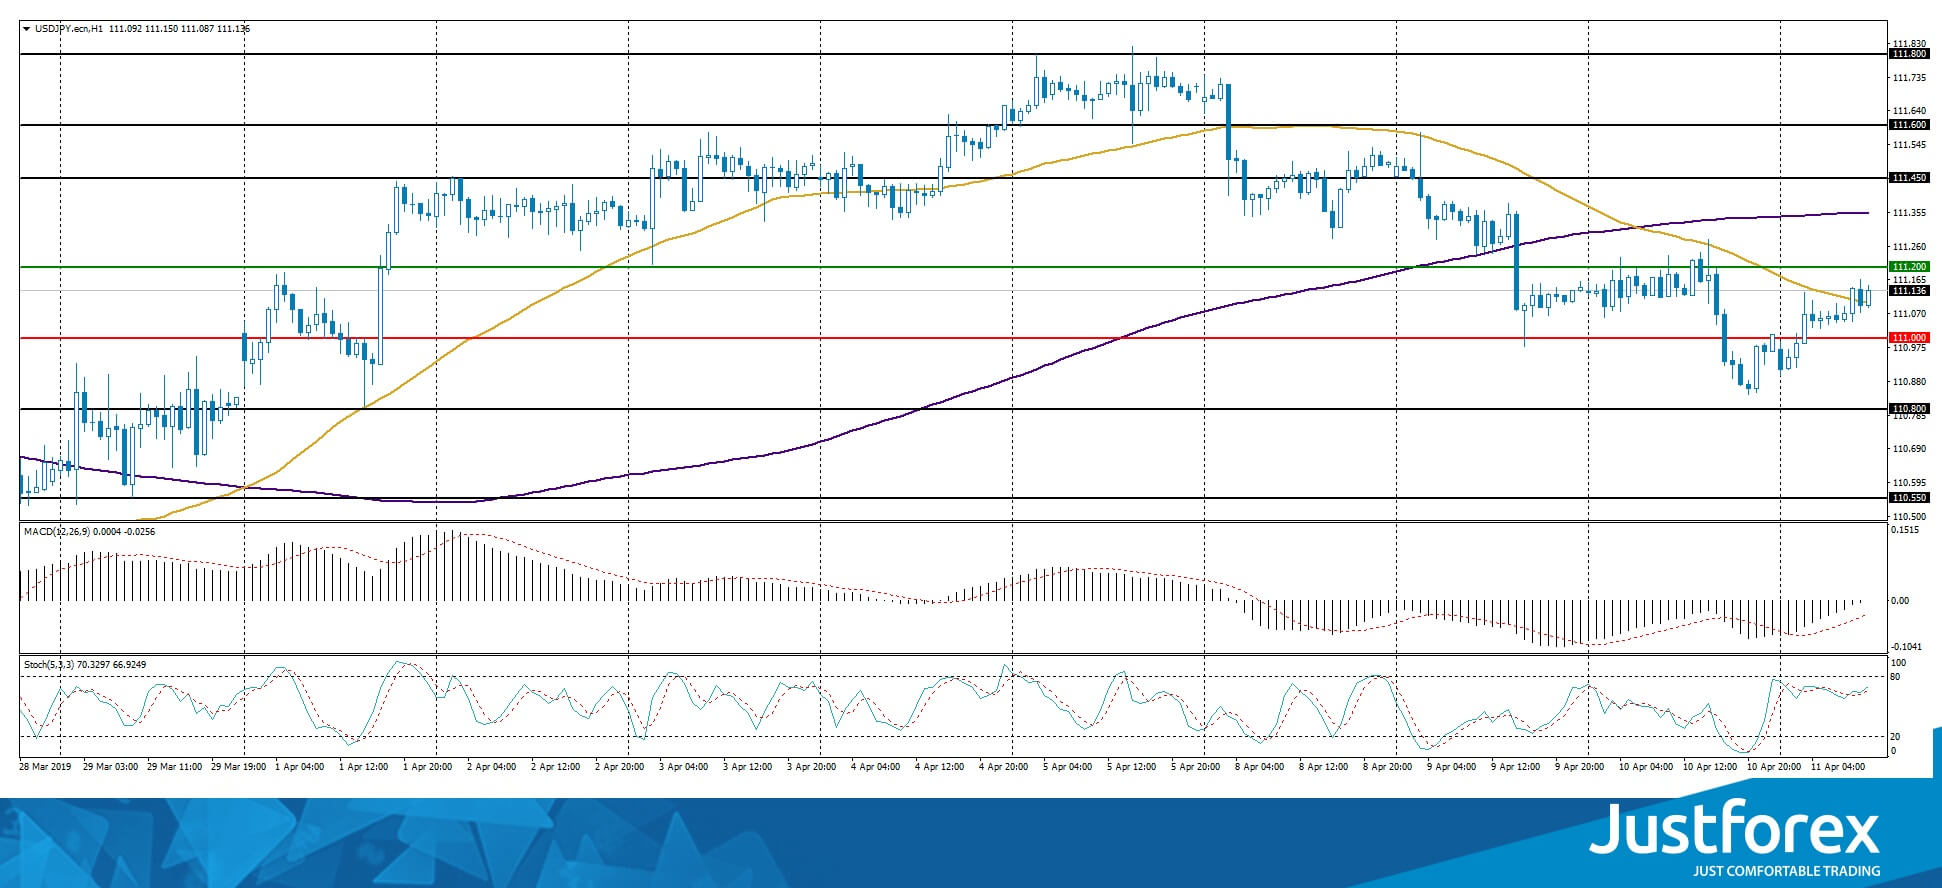
The indicators do not provide precise signals, the price has crossed 50 MA.
The MACD histogram is close to 0.
The Stochastic Oscillator is in the neutral zone, the %K line is crossing the %D line. There are no signals at the moment.
Trading recommendations
Support levels: 111.000, 110.800, 110.550
Resistance levels: 111.200, 111.450, 111.600
If the price fixes below 111.000, expect the quotes to fall toward 110.700-110.600.
Alternatively, the quotes can grow toward 111.450-111.600.


