
The EUR/USD currency pair
Technical indicators of the currency pair:
Prev Open: 1.12760
Open: 1.13219
% chg. over the last day: +0.51
Day’s range: 1.13025 – 1.13303
52 wk range: 1.1111 – 1.2009
On Friday, June 7, USD kept losing positions against the majors. USD published a weak labour market report for May. The non-agrarian industry created 75K new jobs, which is below the market expectations of 185K. The average hourly wage grew by 0.2% in comparison to the forecasted 0.3%. The unemployment level is without changes at 3.6%. The quotes are consolidating around 1.13000-1.13450. The trading instrument can grow further. Open positions from the key levels.
At 17:00 (GMT+3:00) the US will publish a JOLTS report.
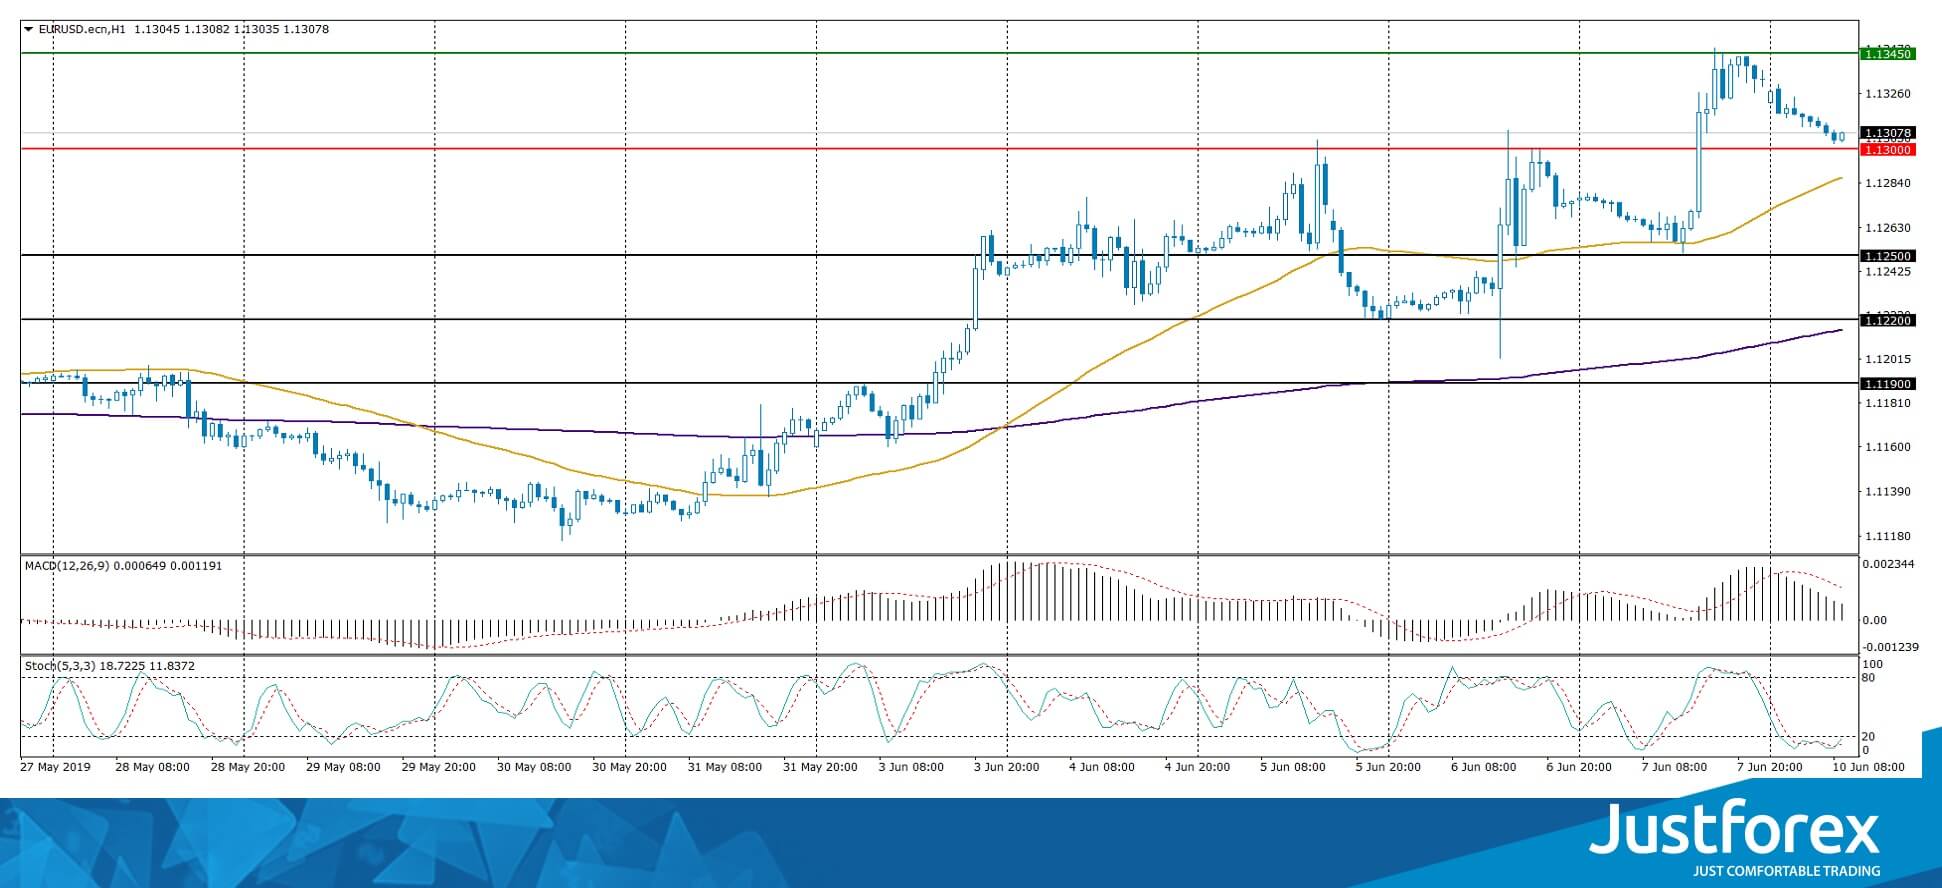
The price fixed above 50 MA and 200 MA which points to the power of the buyers.
The MACD histogram is in the positive zone but below the signal line which gives a weak signal to buy EUR/USD.
The Stochastic Oscillator is in the oversold zone, the %K line is crossing the %D line. There are no signals at the moment.
Trading recommendations
Support levels: 1.13000, 1.12500, 1.12200
Resistance levels: 1.13450, 1.14000
If the price fixes above 1.13450, expect further growth towards 1.13700-1.14000.
Alternatively, the quotes can descend towards 1.12600-1.12400.
The GBP/USD currency pair
Technical indicators of the currency pair:
Prev Open: 1.26876
Open: 1.27264
% chg. over the last day: +0.28
Day’s range: 1.27012 – 1.27359
52 wk range: 1.2438 – 1.3631
GBP/USD shows an ambiguous technical picture. There is no defined trend. Right now GBP is consolidating, the investors are waiting for important economic reports from the UK. The local support and resistance levels are 1.26850 and 1.27250. You should open positions from the key levels.
The Economic News Feed for 10.06.2019:
GDP Report (UK) – 11:30 (GMT+3:00);
Industrial Production Volume (UK) – 11:30 (GMT+3:00);
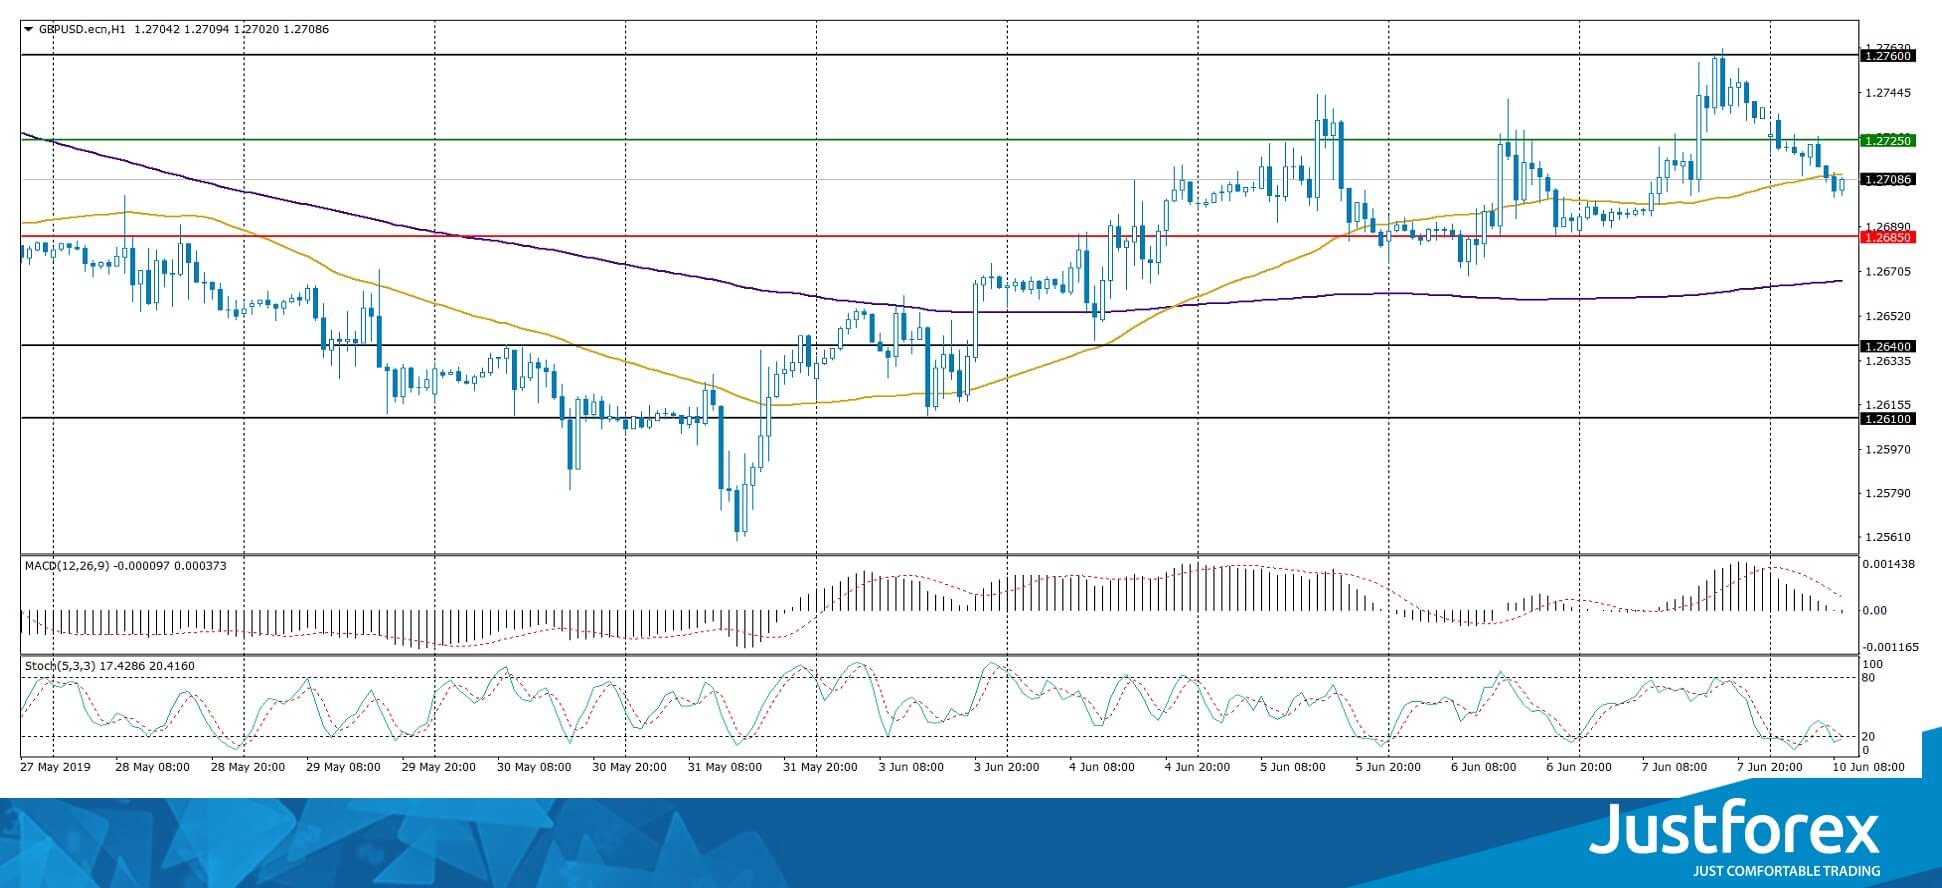
The indicators do not provide precise signals, the price has crossed 50 MA.
The MACD histogram is close to 0.
The Stochastic Oscillator is near the oversold zone, the %K line is crossing the %D line. There are no signals at the moment.
Trading recommendations
Support levels: 1.26850, 1.26400, 1.26100
Resistance levels: 1.27250, 1.27600
If the price fixes above 1.27250, expect further growth towards 1.27600-1.27800.
Alternatively, the quotes can descend towards 1.26500-1.26300.
The USD/CAD currency pair
Technical indicators of the currency pair:
Prev Open: 1.33617
Open: 1.32395
% chg. over the last day: -0.71
Day’s range: 1.32395 – 1.32768
52 wk range: 1.2727 – 1.3664
USD/CAD remains in the bearish mood. Friday was marked by agressive sales. The quotes updated the key minimums. The demand for CAD grew after a positive labour market report from Canada. An additional support is granted by the recovering oil quotes. The USD/CAD is consolidating around 1.32400-1.32900 and can descend further. You should open positions from the key levels.
At 15:30 (GMT+3:00) Canada will publish the construction permission report.
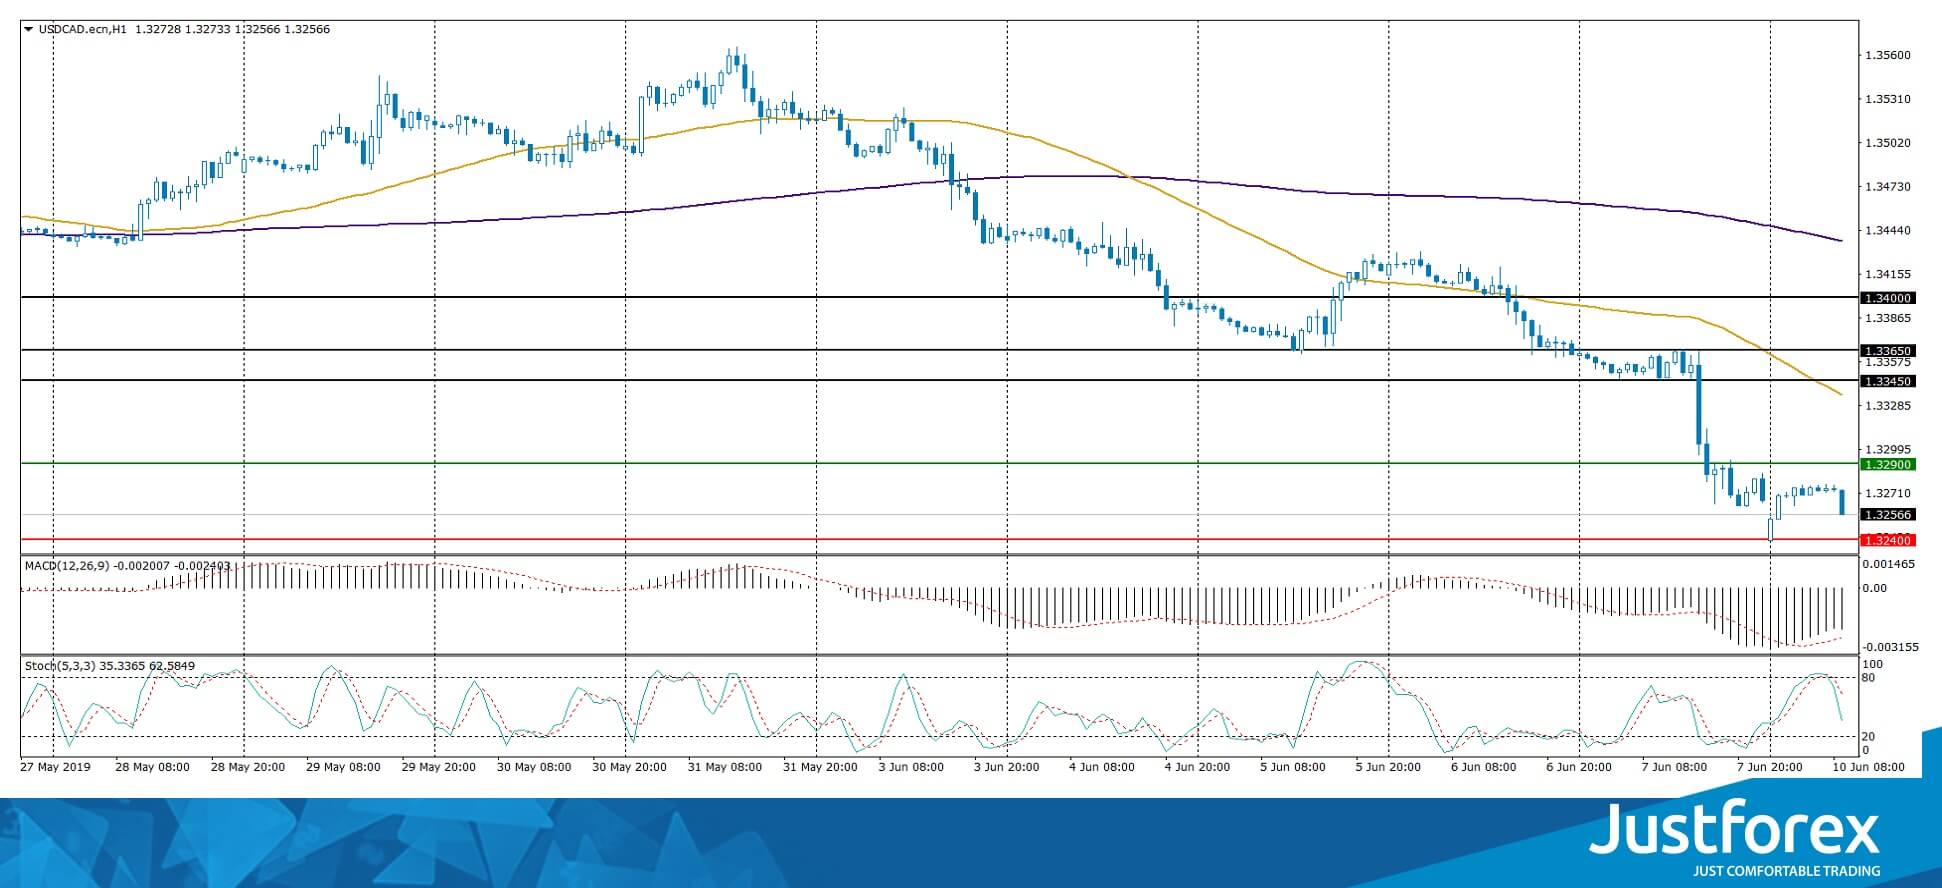
The price fixed below 50 MA and 200 MA which points to the power of the sellers.
The MACD histogram is in the negative zone but above the signal line which points towards selling USD/CAD.
The Stochastic Oscillator is in the neutral zone, the %K line is below %D which points to the bearish mood.
Trading recommendations
Support levels: 1.32400, 1.32000
Resistance levels: 1.32900, 1.33450, 1.33650
If the price fixes below 1.32400, expect further descend towards 1.32000.
Alternatively, the quotes can correct towards 1.33300-1.33500.
The USD/JPY currency pair
Technical indicators of the currency pair:
Prev Open: 108.399
Open: 108.465
% chg. over the last day: -0.21
Day’s range: 108.366 – 108.675
52 wk range: 104.97 – 114.56
The USD/JPY keeps trading in the long flat. There is no defined trend. The key instrument tests the local resistance at 108.650 with 108.300 acting as the nearest support. The quotes can recover further. Keep an eye on the US Treasury bonds’ yield and open positions from the key levels.
During the Asian trading session, Japan published a positive GDP report.
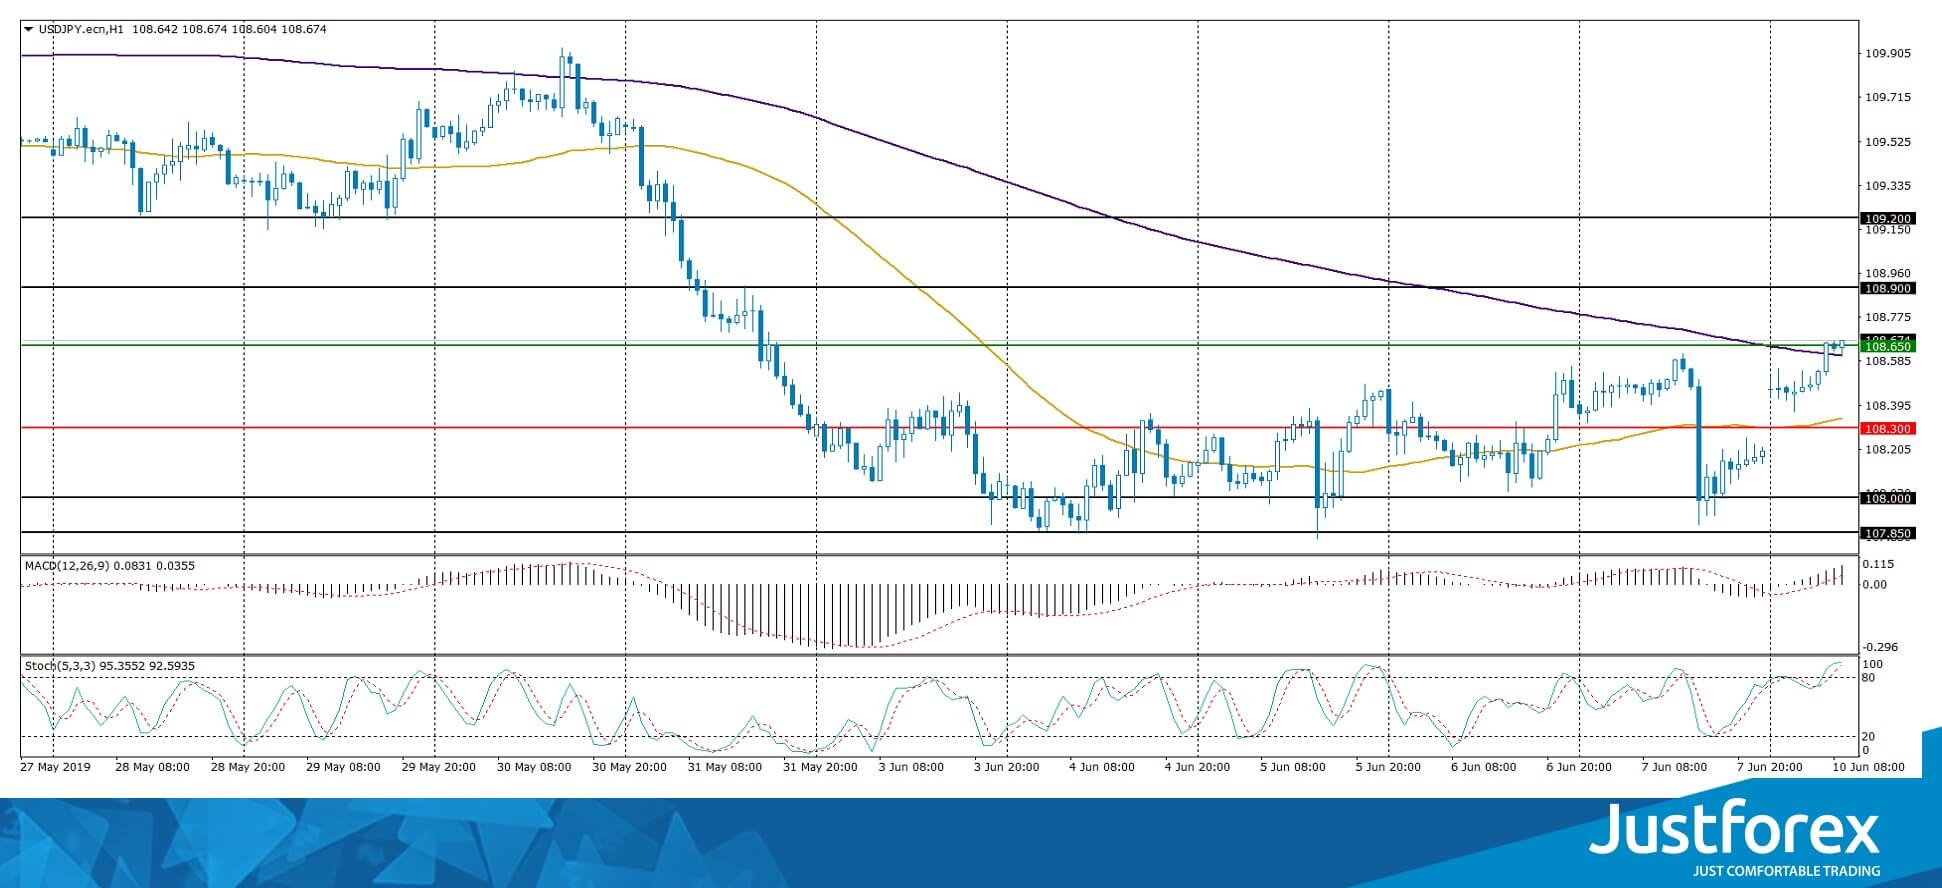
The indicators do not provide precise signals, the price crossed 200 MA.
The MACD histogram is in the positive zone which points to the bullish mood.
The Stochastic Oscillator is in the oversold zone, the %K line is above the %D line which gives a weak signal to buy USD/JPY.
Trading recommendations
Support levels: 108.300, 108.000, 107.850
Resistance levels: 108.650, 108.900, 109.200
If the price fixes above 108.650, expect further growth towards 108.900-109.200.
Alternatively, the qutoes can descend towards 108.000.


