
Key Highlights
- Crude oil price formed a strong support above $51.00 against the US dollar.
- There was a break above a major bearish trend line at $52.20 on the 4-hours chart of XTI/USD.
- The US Housing Starts declined 0.9% in May 2019, more than the market expectation (-0.4%).
- The Fed interest rate decision is scheduled today and the central bank is likely to make no changes in rates.
Crude Oil Price Technical Analysis
After a significant decline, crude oil price found strong supports near $50.75 and $51.00 against the US Dollar. A base was formed near $51.00 and recently the price started a short term recovery above $52.00.
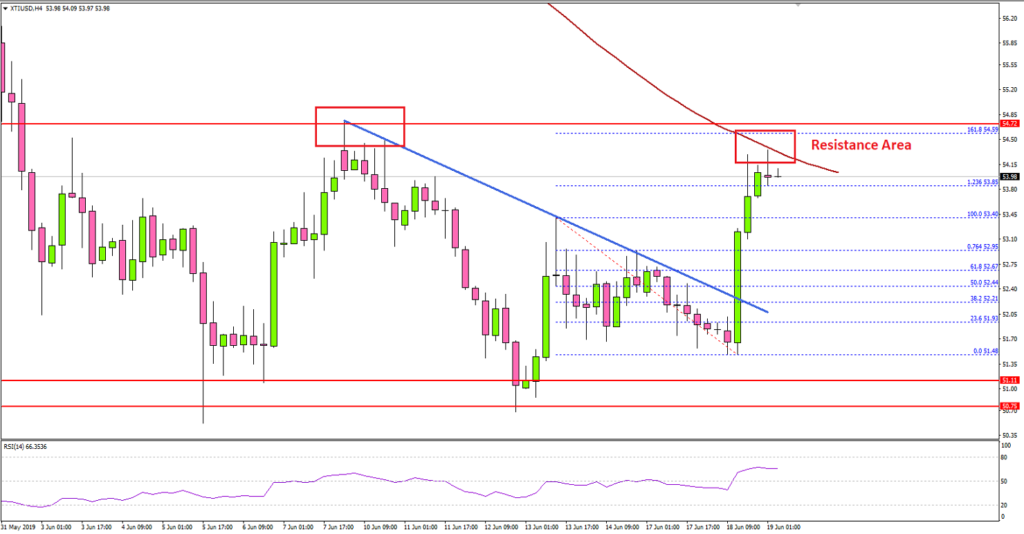
Looking at the 4-hours chart of XTI/USD, the price started a steady rise from the $51.48 swing low. It traded above the $52.00 and $52.50 resistance levels, but remained well below the 100 (red) simple moving average (4-hours), and the 200 (green) simple moving average (4-hours).
During the recent rise, there was a break above a major bearish trend line with resistance at $52.20. Moreover, the price surpassed the 76.4% Fib retracement level of the decline from the $53.40 high to $51.48 low.
It opened the doors for more gains above the $53.40 level. The bulls successfully cleared the $53.80 resistance level and the 1.236 Fib extension level of the decline from the $53.40 high to $51.48 low.
However, the main resistance is near the $54.20 level plus the 100 (red) simple moving average (4-hours), above which the price is likely to move into a bullish zone.
On the downside, an initial support is near the $53.20 level. If there is a downside extension, the price could retest the $52.50 support. The main support is near $51.00, below which there could be heavy losses.
Fundamentally, the US Housing Starts report for May 2019 was released by the US Census Bureau, at the Department of Commerce. The market was looking for a 0.4% decline in the Housing Starts, compared with the last 5.7% increase.
The actual result was lower than the forecast, as the US Housing Starts declined 0.9% in May 2019. On the other hand, the last reading was revised up from 5.7% to 6.8%. .
The report added:
Privately‐owned housing units authorized by building permits in May were at a seasonally adjusted annual rate of 1,294,000. This is 0.3 percent (±1.3 percent)* above the revised April rate of 1,290,000, but is 0.5 percent (±1.4 percent)* below the May 2018 rate of 1,301,000.
Looking at major pairs, EUR/USD and GBP/USD struggled to climb higher, whereas gold price settled above the $1,325 support level.
Economic Releases to Watch Today
- UK Consumer Price Index May 2019 (YoY) – Forecast +2.0%, versus +2.1% previous.
- UK Core Consumer Price Index May 2019 (YoY) – Forecast +1.7%, versus +1.8% previous.
- Canadian Consumer Price Index May 2019 (MoM) – Forecast +0.2%, versus +0.4% previous.
- Canadian Consumer Price Index May 2019 (YoY) – Forecast +2.2%, versus +2.0% previous.
- Fed Interest Rate Decision – Forecast 2.50%, versus 2.50% previous.


