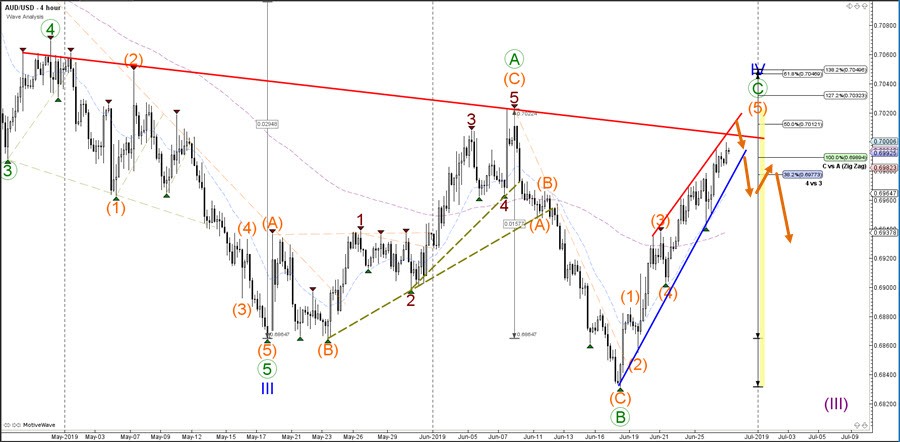
The AUD/USD bullish price action will soon run into resistance trend lines (red) and the previous top (orange box), which is a confluence of resistance where price is expected to bounce. The bearish bounce could turn into a larger bearish reversal and restart the larger downtrend. The targets are indicated by the Fibonacci levels of wave 5 vs 1+3 but price needs to break the previous bottoms first.
The AUD/USD seems to be completing a bullish wave 5 (orange) pattern within a larger bullish ABC (green) zigzag pattern. If that is true, price should show a bearish bounce soon around the 50% Fibonacci retracement level. The confirmation of a bearish reversal takes place if price is able to break below the support trend line (blue).