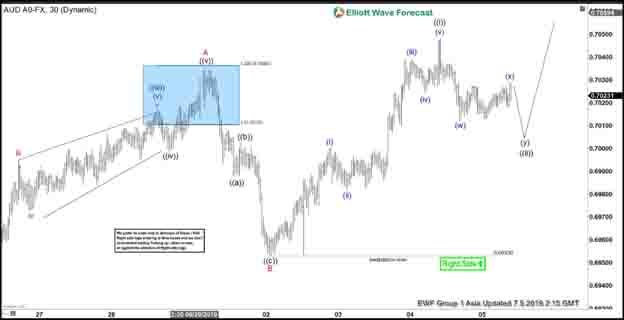
AUDUSD shows a bullish sequence from June 18, 2019 low. Rally from there is unfolding as a zigzag Elliott Wave structure where wave A ended at 0.7035. Wave B pullback ended at 0.6953. The internal of wave B unfolded as another zigzag in lesser degree. Wave ((a)) of B ended at 0.6988, wave ((b)) of B ended at 0.7 and wave ((c)) of B ended at 0.6953.
Wave C higher is in progress and pair has broken above wave A at 0.7035 confirming the next leg has started. Internal of wave C is unfolding as a 5 waves impulse Elliott Wave. Up from 0.6953, wave (i) ended at 0.7 and wave (ii) pullback ended at 0.6982. Pair then resumes higher in wave (iii) towards 0.7039, wave (iv) ended at 0.7024 and wave (v) ended at 0.7048. The entire move higher ended wave ((i)) of C in higher degree. Pair is now correcting cycle from July 2 low within wave ((ii)) before the rally resumes. We don’t like selling the pair and expect dips to find buyers in 3, 7, or 11 swing as far as pivot at 0.6953 stays intact.
AUDUSD 1 Hour Elliott Wave Chart