
The EUR/USD currency pair
Technical indicators of the currency pair:
Prev Open: 1.12005
Open: 1.11984
% chg. over the last day: -0.02
Day’s range: 1.11973 – 1.12140
52 wk range: 1.1034 – 1.1817
An ambiguous technical picture has developed on the EUR/USD currency pair. A trading instrument is consolidating. EUR/USD quotes continue to test local support and resistance levels at 1.11850 and 1.12150. Participants in the financial markets expect additional drivers. We do not rule out further recovery of the single currency. We recommend keeping track of up-to-date information regarding the trade conflict between the USA and China. Positions must be opened from key levels.
Today, the news background is pretty calm. At 15:30 (GMT+3:00), the US will publish a report on the number of initial jobless claims.
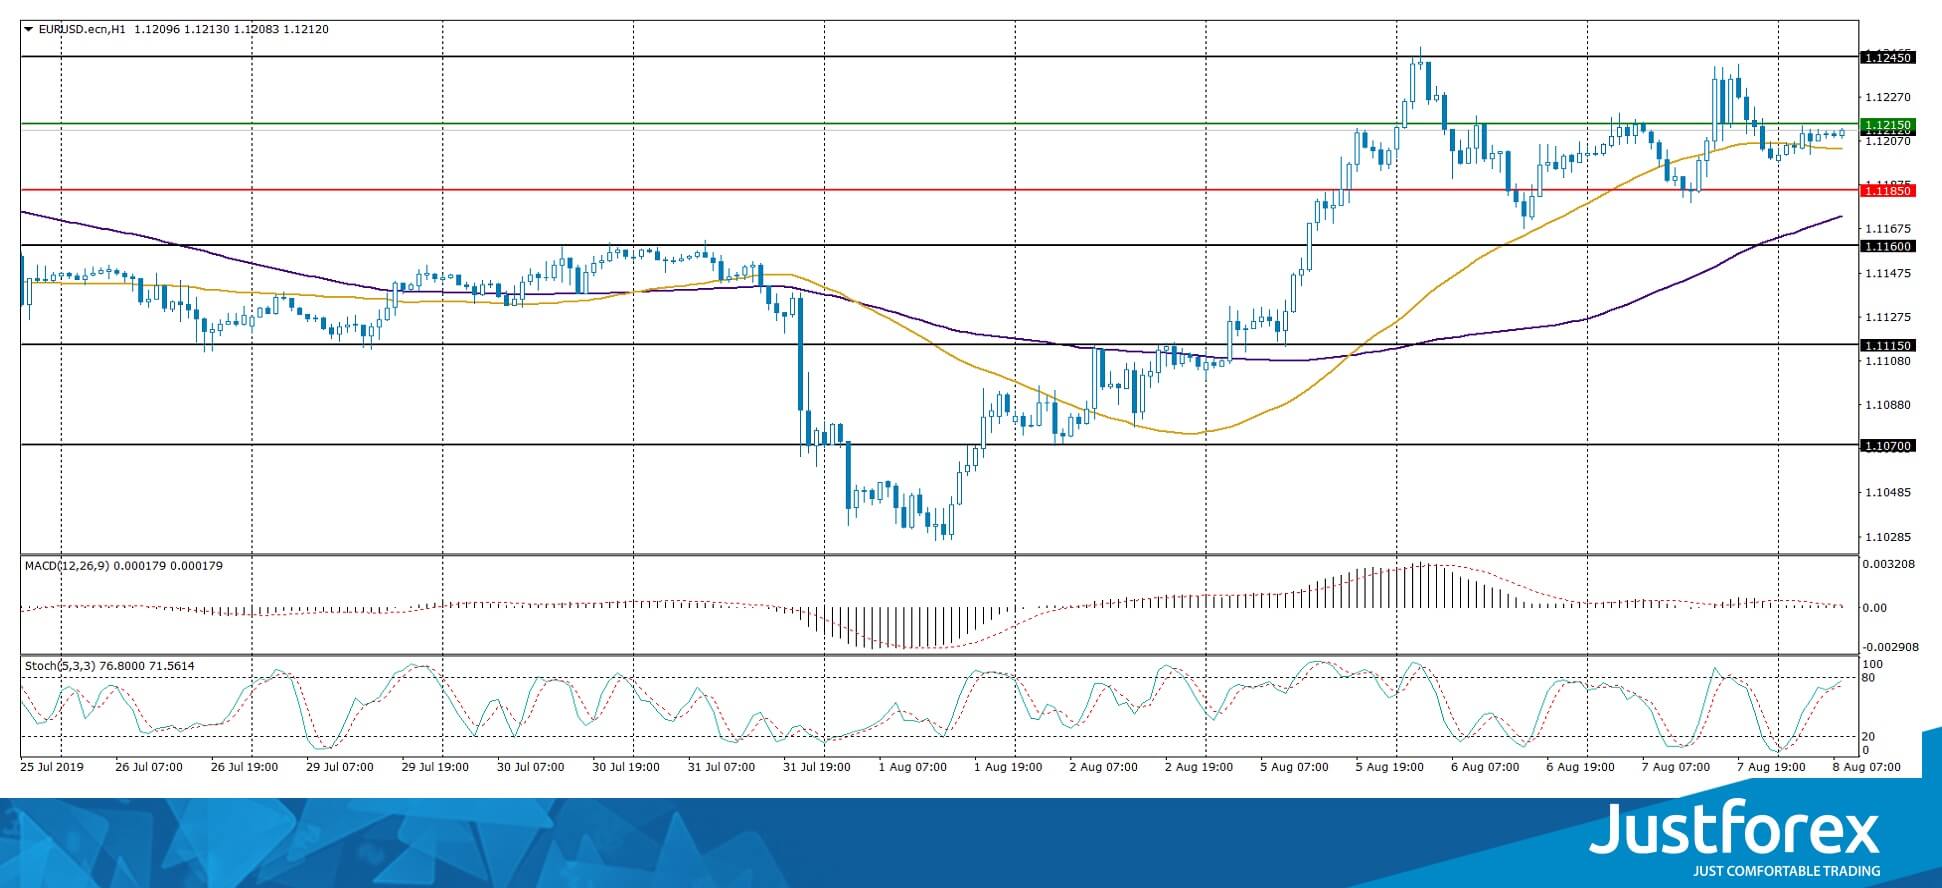
Indicators do not provide precise signals, the price has crossed 50 MA.
The MACD histogram is close to 0.
The Stochastic Oscillator is in the neutral zone, the %K line is above the %D line which points to a bullish sentiment.
Trading recommendations
Support levels: 1.11850, 1.11600, 1.11150
Resistance levels: 1.12150, 1.12450, 1.12800
If the price fixes above 1.12150, expect further growth toward 1.12450-1.12600.
Alternatively, the quotes can decrease toward 1.11600-1.11400.
The GBP/USD currency pair
Technical indicators of the currency pair:
Prev Open: 1.21368
Open: 1.21678
% chg. over the last day: +0.23
Day’s range: 1.21451 – 1.21908
52 wk range: 1.2080 – 1.3385
The GBP is still in a lateral movement. There is no defined trend. At the moment, the local support and resistance levels are 1.21300 and 1.21850. Uncertainty around Brexit continues to put pressure on the British currency. Earlier, the government of Boris Johnson reported that Britain did not intend to resume negotiations with the EU on Brexit. We recommend tracking information on this issue. Positions must be opened from key levels.
The Economic News Feed for 08.08.2019 is calm.
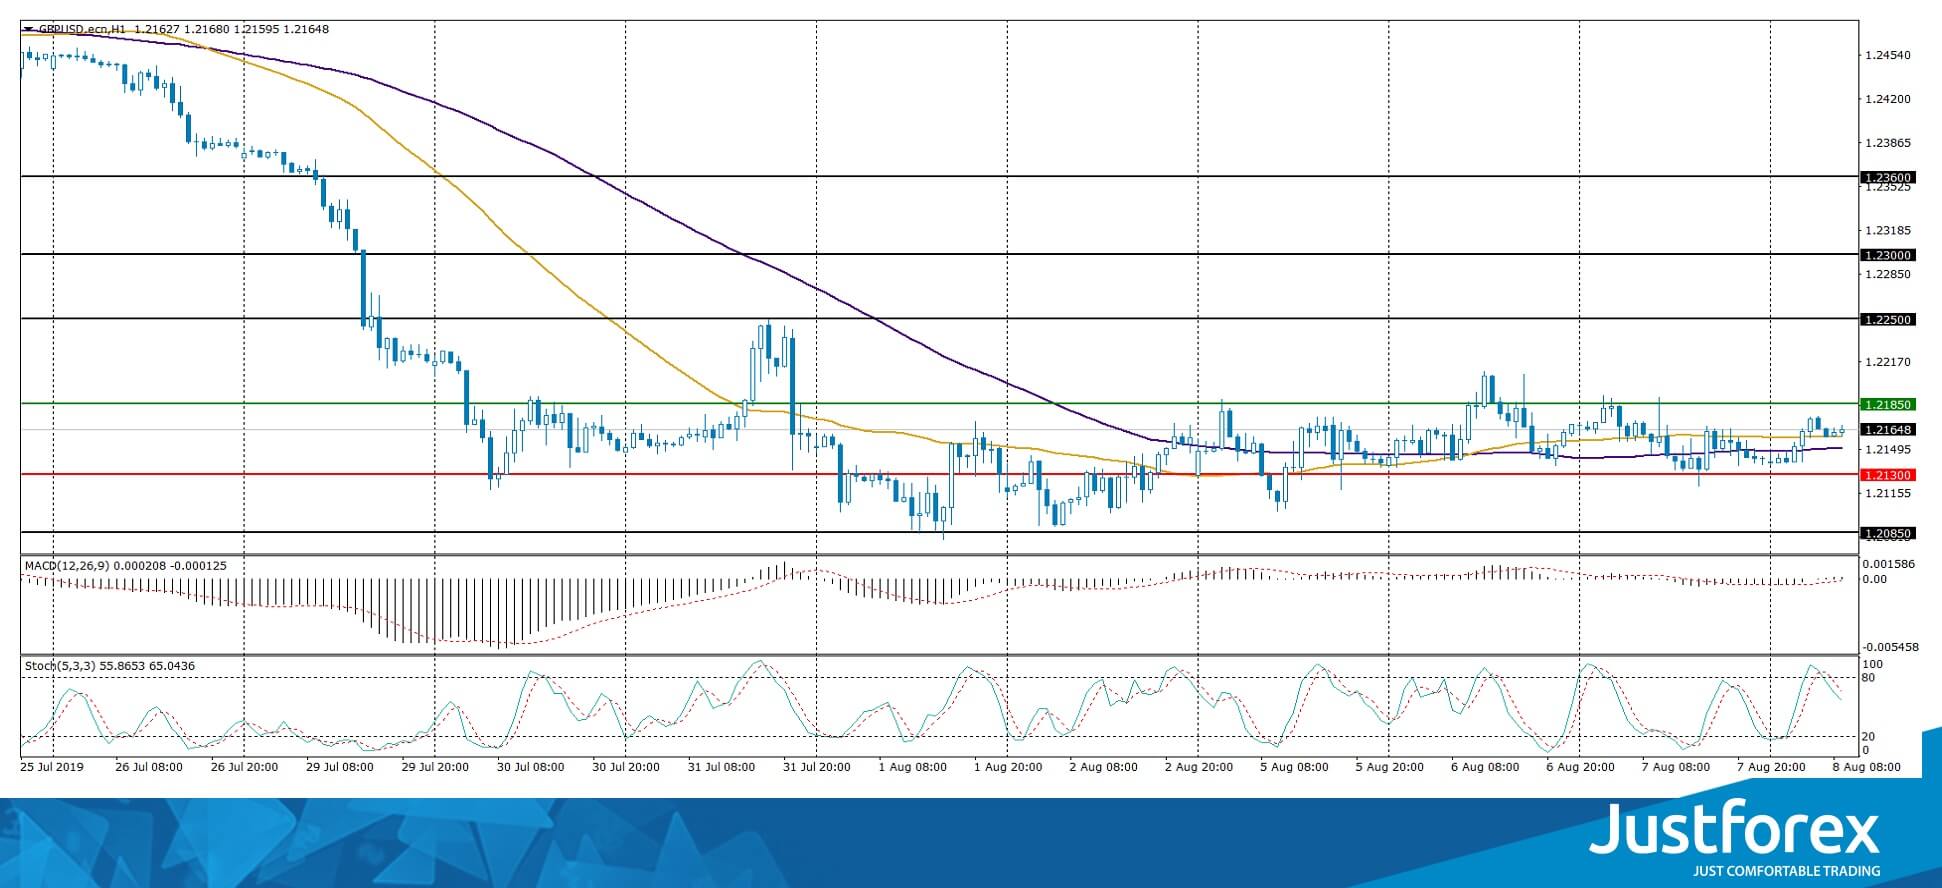
The indicators do not provide precise signals, the price crossed 50 MA and 100 MA.
The MACD histogram is close to 0.
The Stochastic Oscillator is in the neutral zone, the %K line crossed the %D line. There are no signals at the moment.
Trading recommendations
Support levels: 1.21300, 1.20850, 1.20500
Resistance levels: 1.21850, 1.22500, 1.23000
If the price consolidates above 1.21850, expect further recovery toward 1.22300-1.22500.
Alternatively, the price could reduce toward 1.20850-1.20700.
The USD/CAD currency pair
Technical indicators of the currency pair:
Prev Open: 1.32756
Open: 1.33038
% chg. over the last day: +0.26
Day’s range: 1.32720 – 1.33140
52 wk range: 1.2727 – 1.3664
The USD/CAD currency pair stabilized after a rather protracted rally. CAD is currently consolidating. The local support and resistance levels are: 1.32650 and 1.33100, respectively. Support for the Canadian dollar is provided by positive data on business activity from Ivey. We recommend paying attention to the dynamics of oil quotes. Positions must be opened from key levels.
The news background on the Canadian economy is pretty calm today.
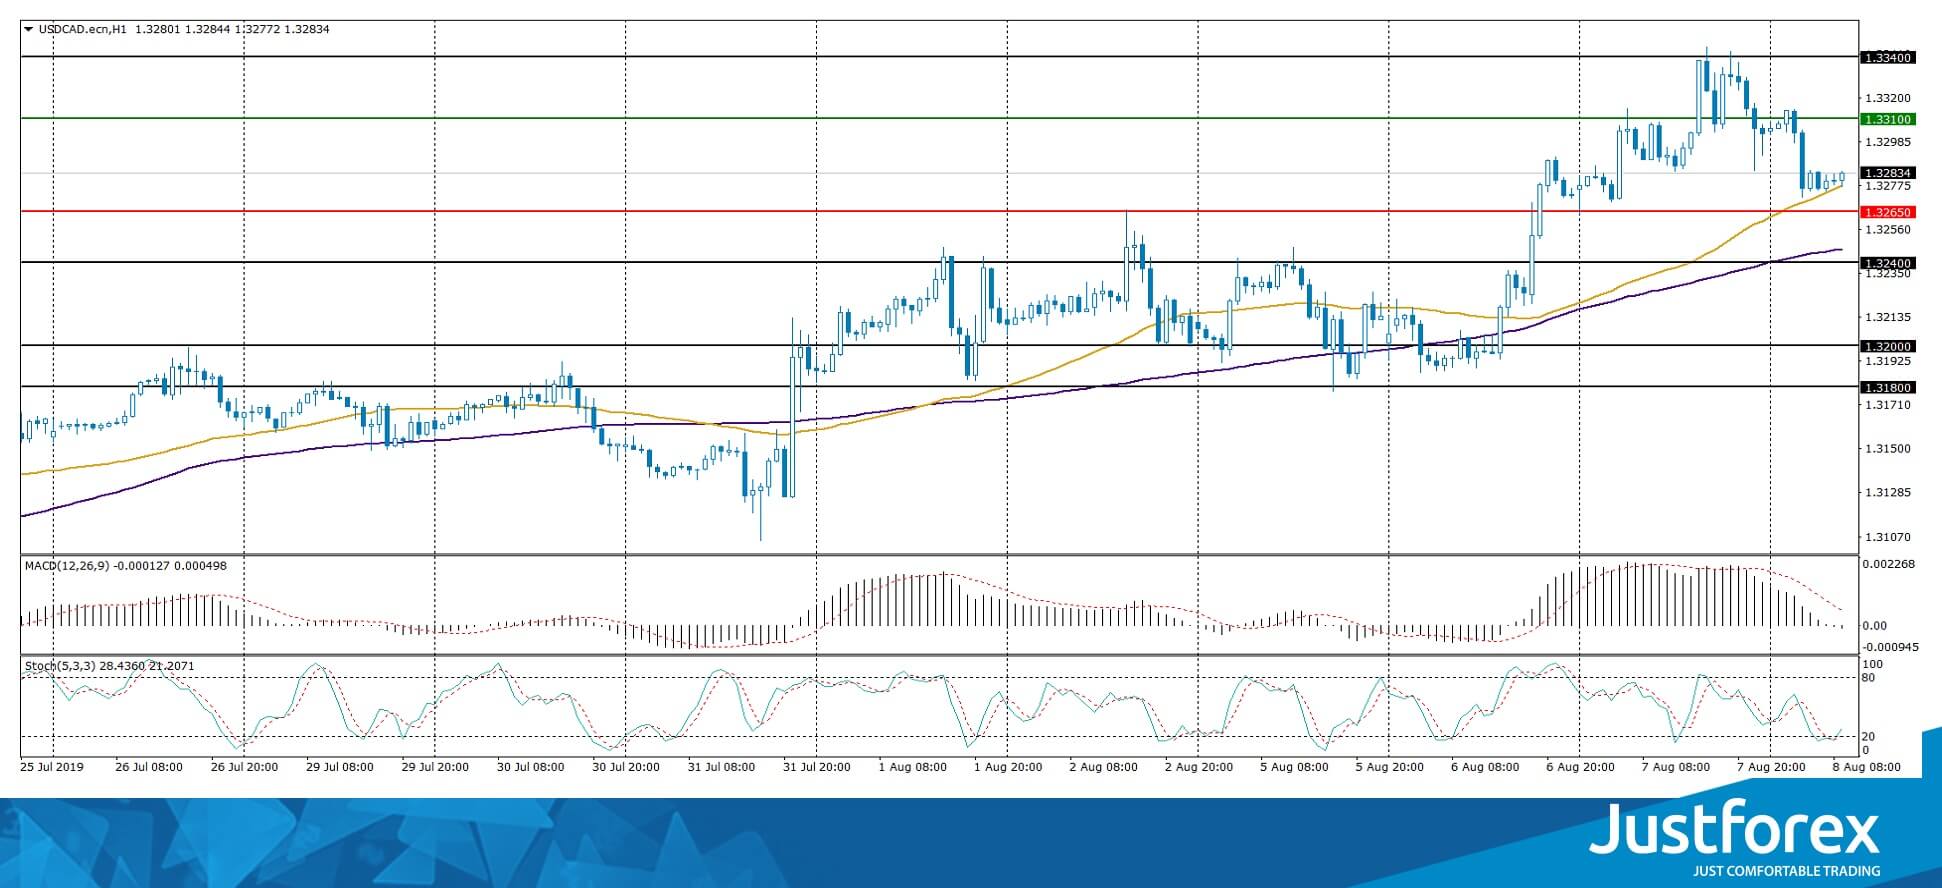
Indicators do not give accurate signals: the price is consolidating near 50 MA.
The MACD histogram is located near the 0 mark.
The Stochastic Oscillator is near the oversold zone, the %K line crossed the %D line. There are no signals at the moment.
Trading recommendations
Support levels: 1.32650, 1.32400, 1.3200
Resistance levels: 1.33100, 1.33400
If the price consolidates above 1.33100, expect further growth toward 1.33400-1.33600.
Alternatively, the quotes can drop toward 1.32400-1.32100.
The USD/JPY currency pair
Technical indicators of the currency pair:
Prev Open: 106.460
Open: 106.260
% chg. over the last day: -0.35
Day’s range: 106.005 – 106.299
52 wk range: 104.97 – 114.56
The USD/JPY is still in a sideways movement. There is no defined trend. At the moment, the trading instrument is consolidating near the round level of 106,000. The 106.550 mark is a key resistance. USD/JPY quotes hcan correct further after a significant collapse since the beginning of the current month. We recommend that you pay attention to the dynamics of yield on US government bonds. Positions must be opened from key levels.
Japan has recently published an optimistic report on the payment balance.
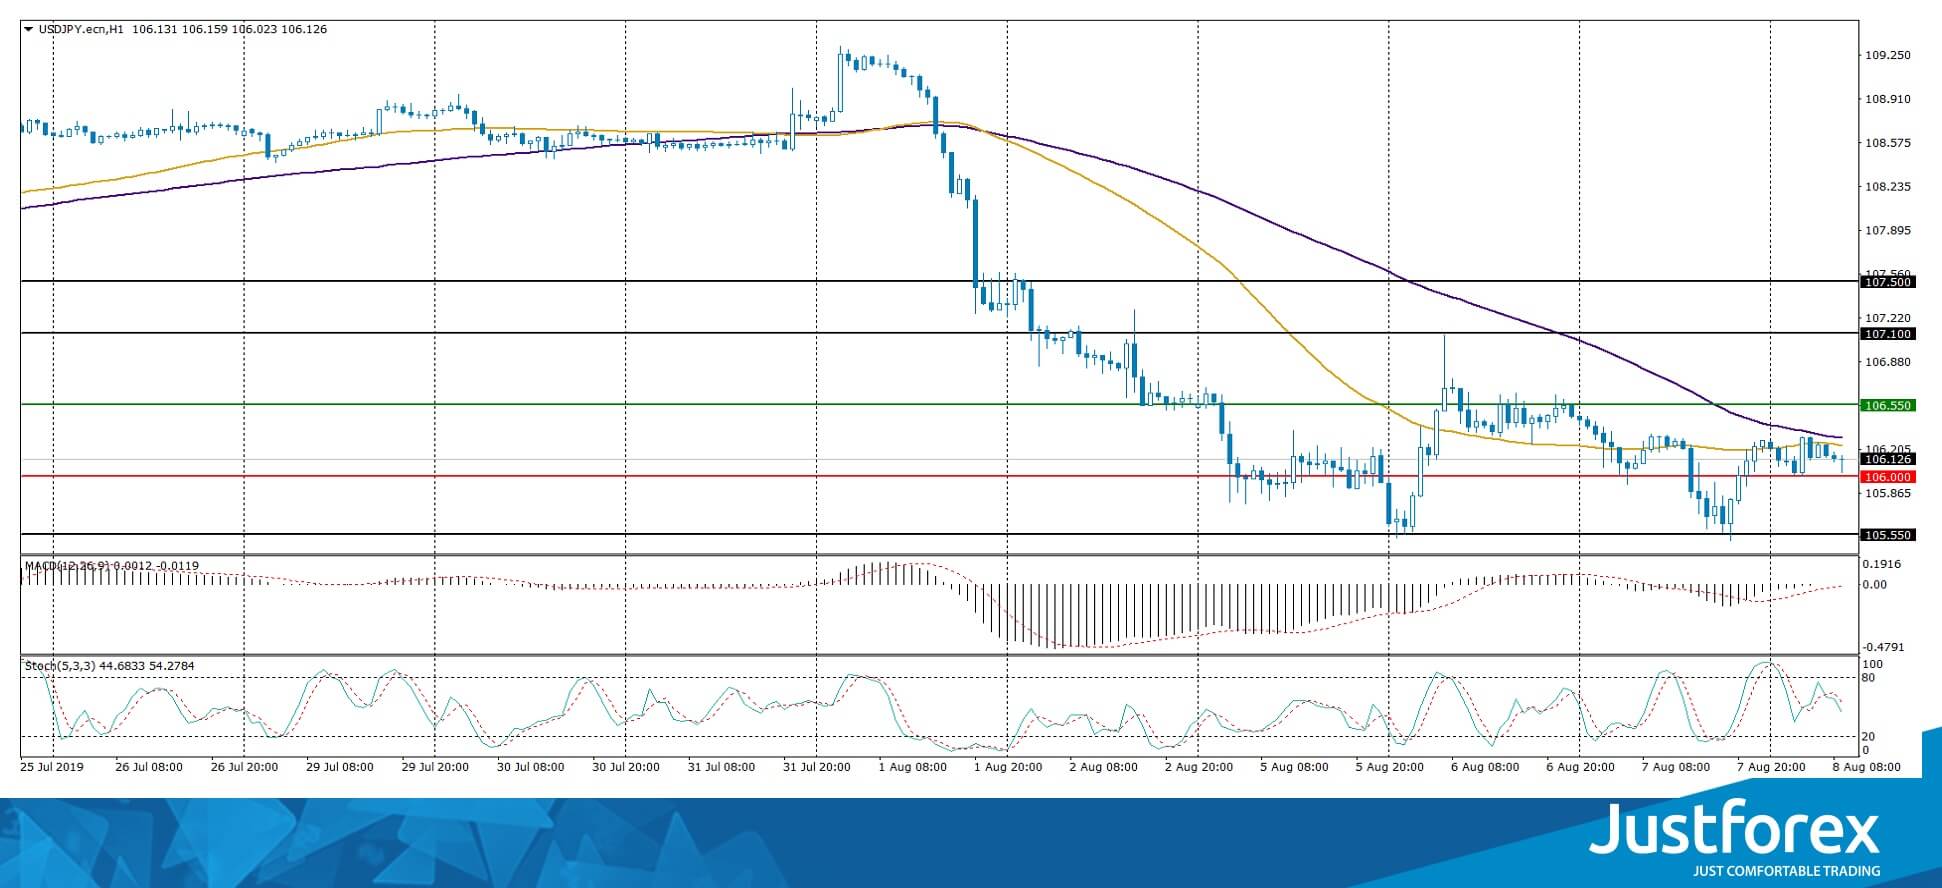
Indicators do not give accurate signals, the price crossed 50 Ma and 100 MA.
The MACD histogram is close to 0.
The Stochastic Oscillator is in the neutral zone, the %K line is below the %D line which points to a bearish sentiment.
Trading recommendations
Support levels: 106.000, 105.550
Resistance levels: 106.550, 107.100, 107.500
If the price consolidates above 106.550, expect a correctiont toward 107.000.
Alternatively, the price could decrease toward 105.600-105.400.


