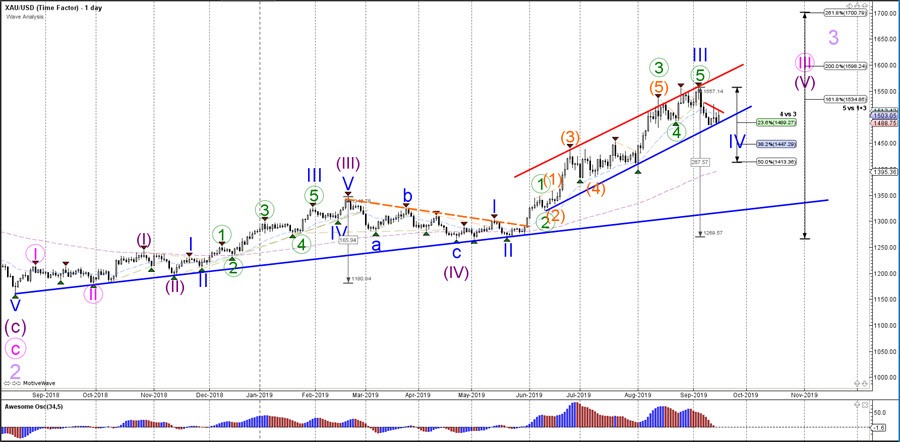
The current wave outlook favors a deeper retracement within the wave 4 (blue). The most commonly used Fibonacci level of a wave 4 is the 38.2% level, which is also here the favorite for an uptrend continuation. The bullish trend remains valid as long as price stays above the 50% Fib and will most likely aim for the Fibonacci targets of wave 5 vs 1+3.
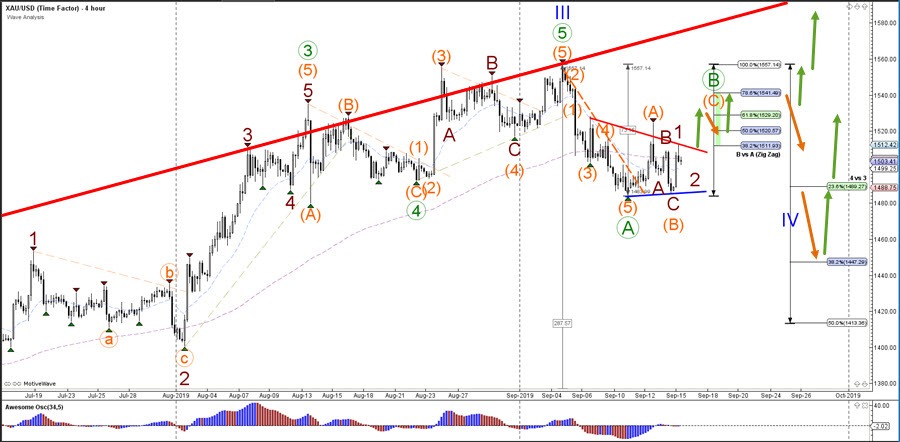
The XAU/USD could be building a bearish ABC (green) zigzag pattern if price stays below the Fibonacci levels of wave B vs A. A break above the 78.6% Fib, however, indicates that an immediate uptrend is more likely whereas a break below the support trend line (blue) could indicate a pullback to the 38.2% Fibonacci .