
The EUR/USD currency pair
Technical indicators of the currency pair:
Prev Open: 1.11490
Open: 1.11246
% chg. over the last day: -0.18
Day’s range: 1.11158 – 1.11313
52 wk range: 1.0884 – 1.1623
The EUR/USD currency pair retreated from the local highs. Participants in financial markets began to partially fix their EUR positions before the ECB meeting, which will be held on Thursday. The US dollar is supported by the prospects for resolving the trade conflict between Washington and Beijing. Earlier, Donald Trump said that “the agreement with China is moving very well.” At the moment, EUR/USD quotes are consolidating in the range of 1.11150-1.11450. The trading instrument has the potential for further correction.Open positions from key levels.
The Economic News Feed for 23.10.2019 is calm.
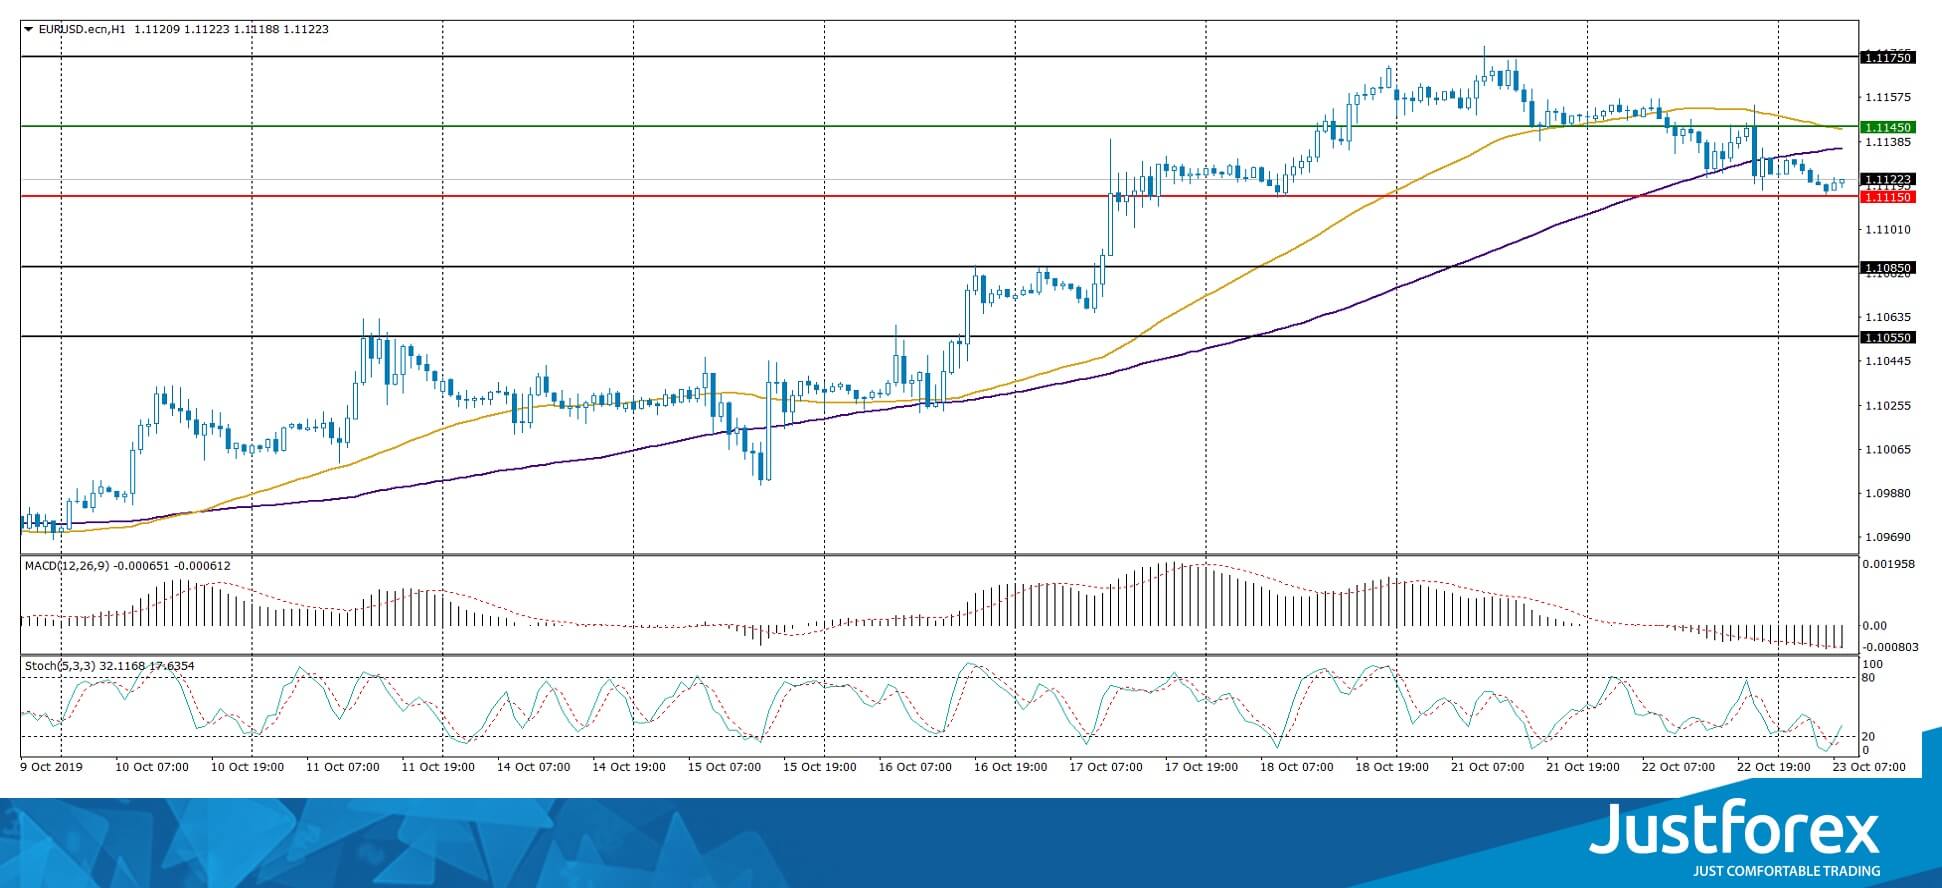
Indicators do not give accurate signals: 50 MA began to cross 100 MA.
The MACD histogram is in the negative zone and continues to decline, which gives a strong signal to sell EUR / USD.
The Stochastic Oscillator is in the oversold zone, the %K line crossed the %D line. There are no signals at the moment.
Trading recommendations
Support levels: 1.11150, 1.10850, 1.10550
Resistance levels: 1.11450, 1.11750
If the price consolidates below 1.11150, expect a correction to 1.10850-1.10600.
Alternatively, the EUR/USD could grow to 1.11750-1.12000
The GBP/USD currency pair
Technical indicators of the currency pair:
Prev Open: 1.29580
Open: 1.28703
% chg. over the last day: -0.59
Day’s range: 1.28413 – 1.28984
52 wk range: 1.1959 – 1.3385
The GBP/USD currency pair went down after a protracted rally. GBP is currently consolidating. The local support and resistance levels are 1.28400 and 1.29400, respectively. Investors’ attention is focused on the situation around Brexit. British lawmakers supported the new Brexit bill, which was agreed upon with Brussels last week. European Union President Donald Tusk intends to advise leaders of EU countries to postpone the UK deadline for leaving the EU. Open positions from key levels.
The Economic News Feed for 23.10.2019 is calm.
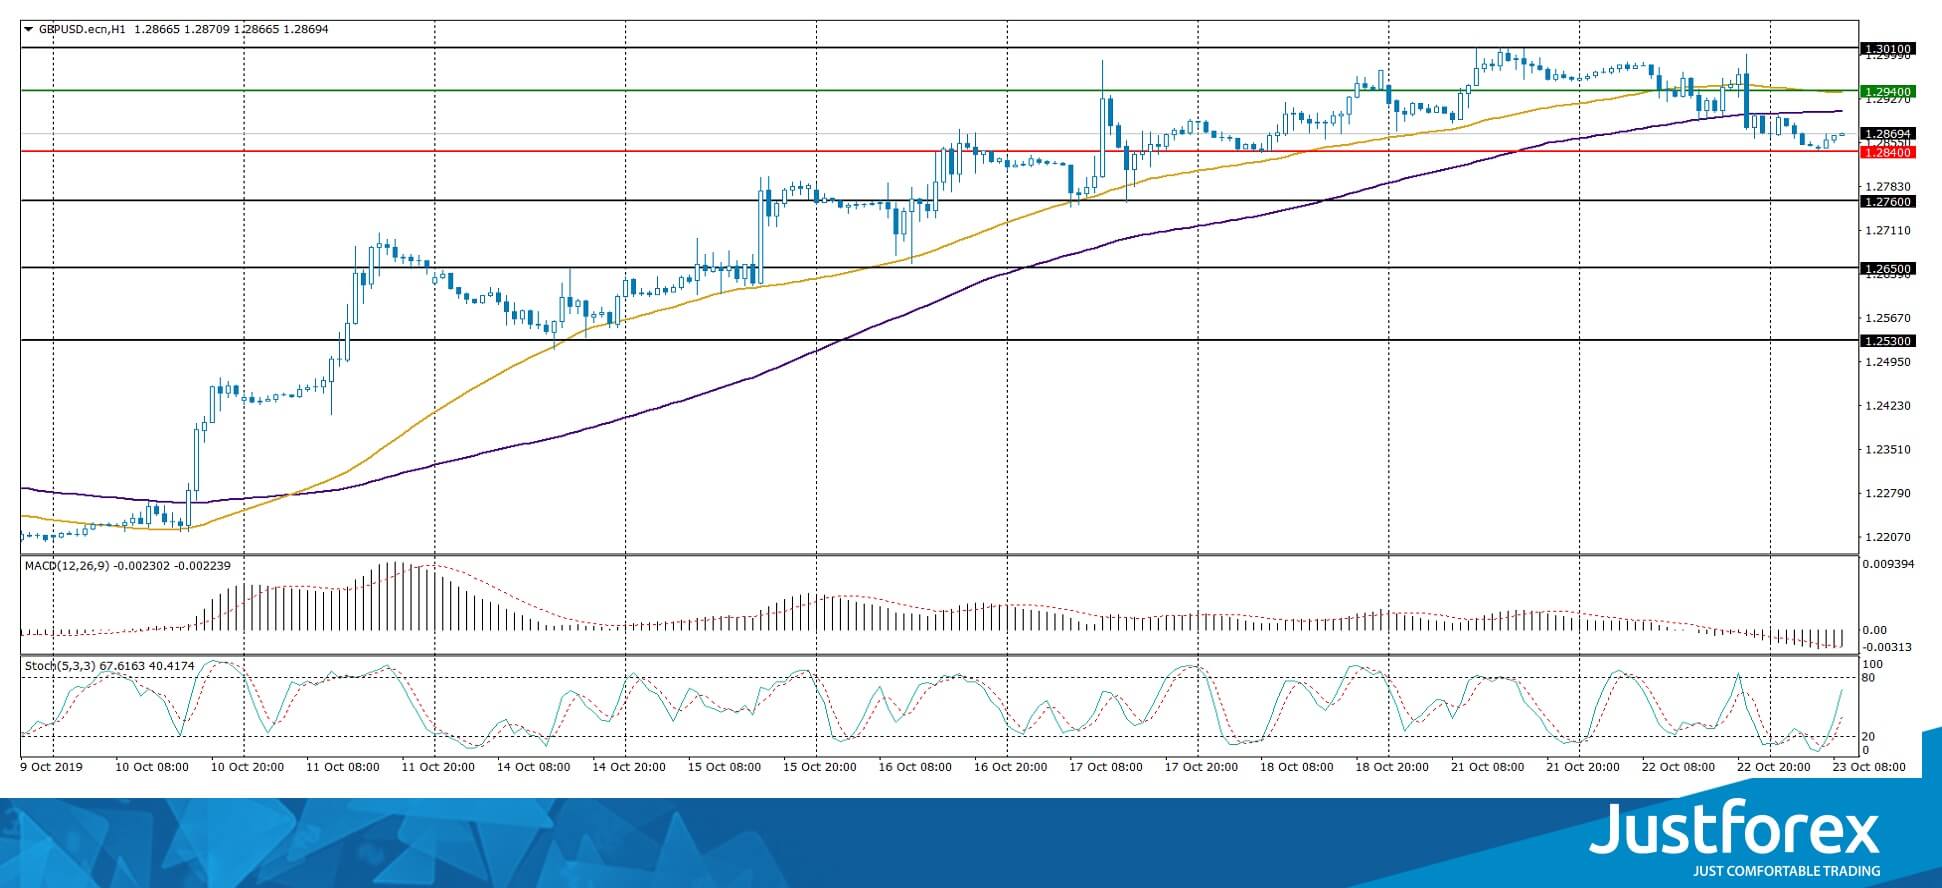
Indicators do not give accurate signals: the price crossed 50 MA and 100 MA.
The MACD histogram is in the negative zone, indicating a bearish sentiment.
The Stochastic Oscillator is in the neutral zone, the %K line is above the %D line, which indicates the growth of GBP / USD quotes.
Trading recommendations
Support levels: 1.28400, 1.27600, 1.26500
Resistance levels: 1.29400, 1.30100
If the price fixes below 1.28400, look for the entry points to the market. The price is going to fall toward 1.27700-1.27000.
Alternatively, the quotes could grow toward 1.30000-1.30500.
The USD/CAD currency pair
Technical indicators of the currency pair:
Prev Open: 1.30868
Open: 1.30934
% chg. over the last day: +0.06
Day’s range: 1.30871 – 1.31093
52 wk range: 1.2727 – 1.3664
The USD/CAD currency pair has stabilized after a significant drop over the past two weeks. CAD is currently consolidating. The trading tool tests local support and resistance levels: 1.30750 and 1.31150, respectively. In the near future, technical correction is not ruled out. We recommend that you pay attention to the dynamics of oil prices. Open positions from key levels.
At 15:30 (GMT+3:00), data on the volume of wholesale sales in Canada will be published.
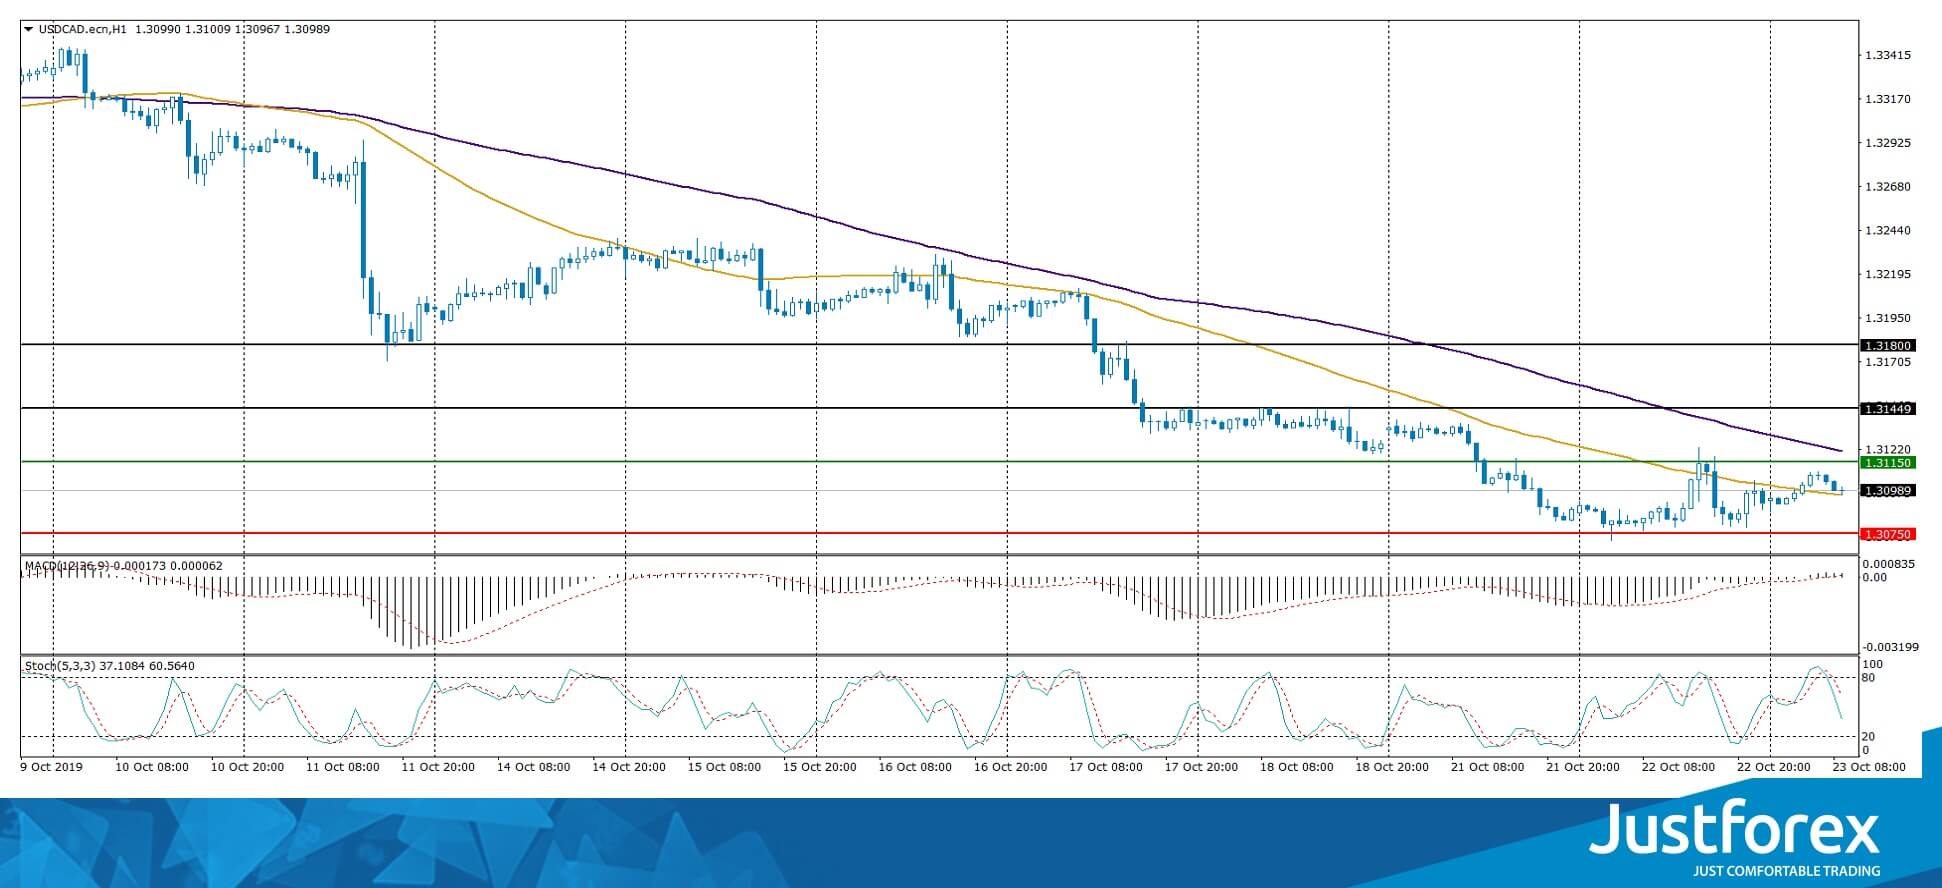
Indicators do not give accurate signals: the price crossed 50 MA and 100 MA.
The MACD histogram is near the 0 mark.
The Stochastic Oscillator is in the neutral zone, the %K line is below the %D line, which indicates a bearish sentiment.
Trading recommendations
Support levels: 1.30750, 1.30400, 1.30200
Resistance levels: 1.31150, 1.31450, 1.31800
If the price consolidates below 1.30750, expect the quotes to drop toward 1.30400-1.30200.
Alternatively, the quotes could grow toward 1.31450-1.31600.
The USD/JPY currency pair
Technical indicators of the currency pair:
Prev Open: 108.576
Open: 108.480
% chg. over the last day: -0.12
Day’s range: 108.250 – 108.512
52 wk range: 104.97 – 114.56
The technical picture on the EUR/USD currency pair is still mixed. The trading instrument is in lateral movement. Participants in financial markets expect additional drivers. At the moment, the following local support and resistance levels can be distinguished: 108.250 and 108.500, respectively. USD / JPY quotes have the potential to decline. We recommend that you pay attention to the dynamics of yield on US government bonds. Open positions from key levels.
The Economic News Feed for 23.10.2019 is calm.
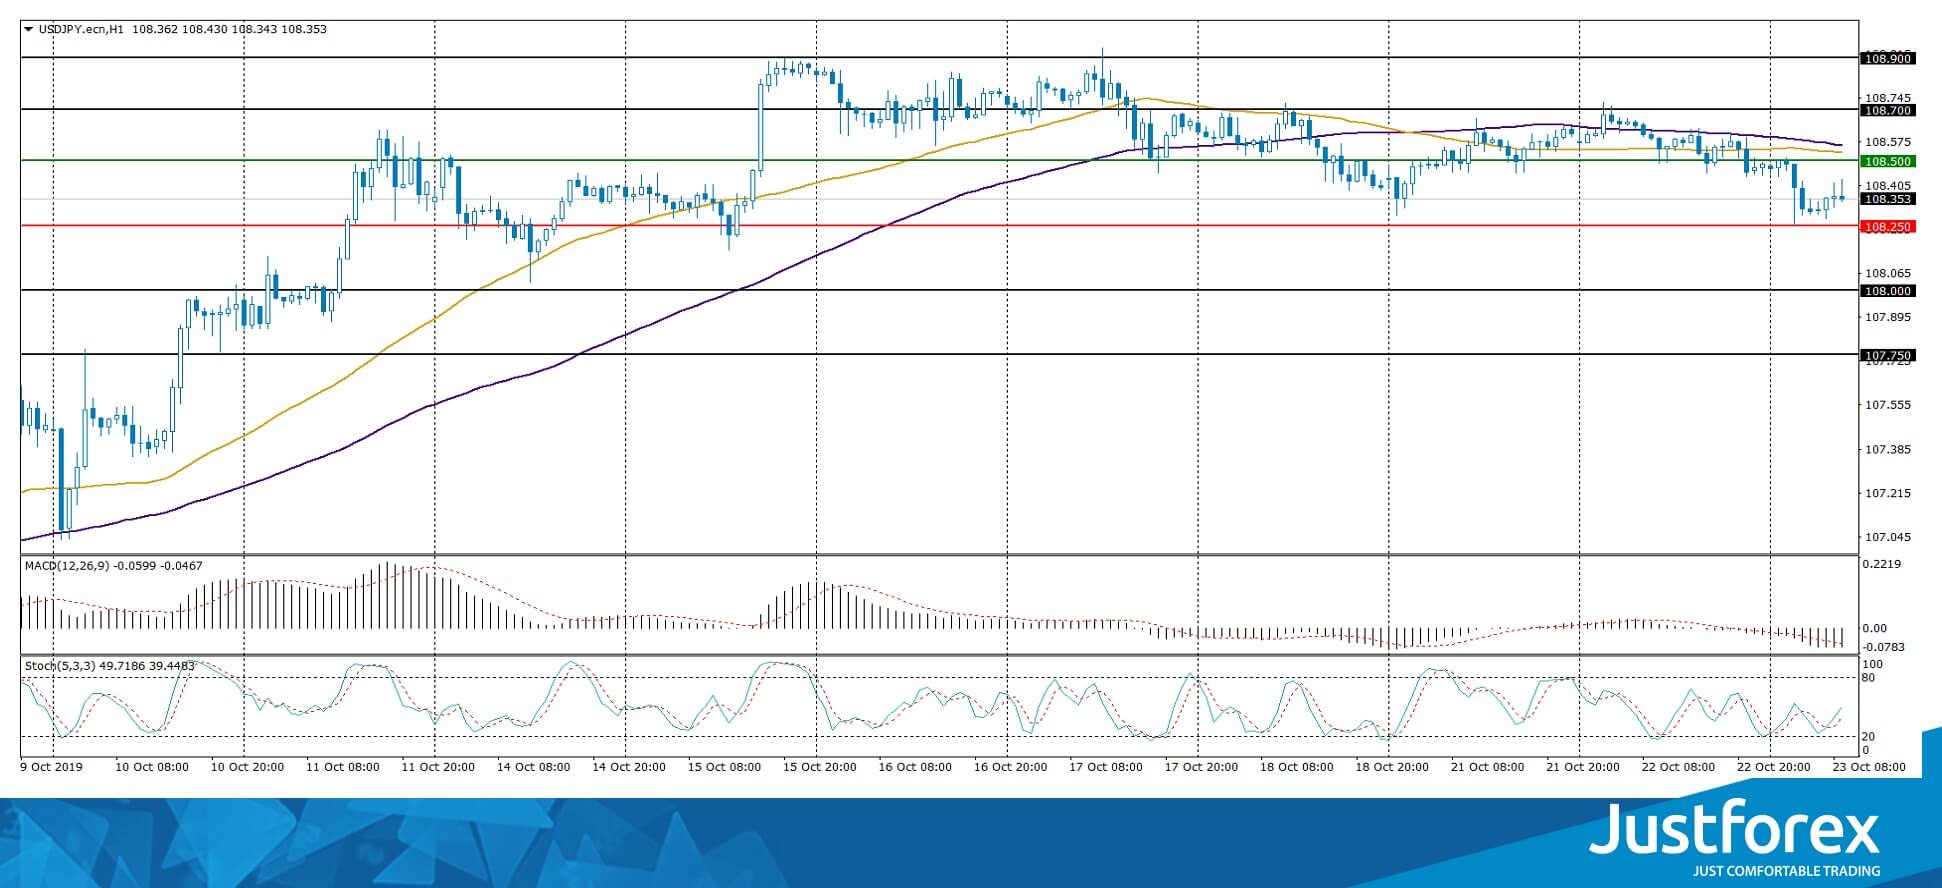
Indicators of accurate signals do not give 50 MA crossed 100 MA.
The MACD histogram is in the negative zone, indicating a bearish sentiment.
The Stochastic Oscillator is in the neutral zone, the %K line is above the %D line, which gives a signal to buy USD / JPY.
Trading recommendations
Support levels: 108.250, 108.000, 107.750
Resistance levels: 108.500, 108.700, 108.900
If the price consolidates below 108.250, expect the quotes to fall toward 108.000-107.750.
Alternatively, thee quotes could grow toward 108.800-109.000.


