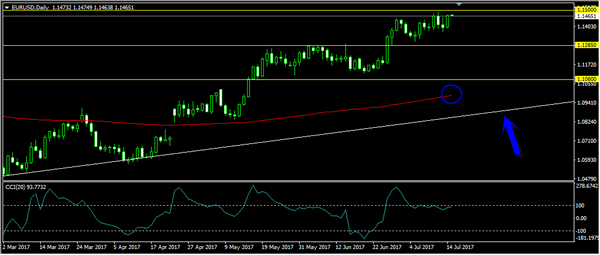
EURUSD
The EURUSD continued its bullish momentum last week topped at 1.1489. The bias is bullish in nearest term testing 1.1500 – 1.1530 before targeting 1.1615 area (weekly EMA 200 and 2016 high). Immediate support is seen around 1.1435. A clear break below that area could lead price to neutral zone in nearest term testing 1.1390 region but overall I remain bullish and any downside pullback should be seen as a good opportunity to buy and only a clear break back below 1.1285 would interrupt the bullish outlook. On the upside, a clear break above 1.1615 would expose 1.1712 region (2015 high).
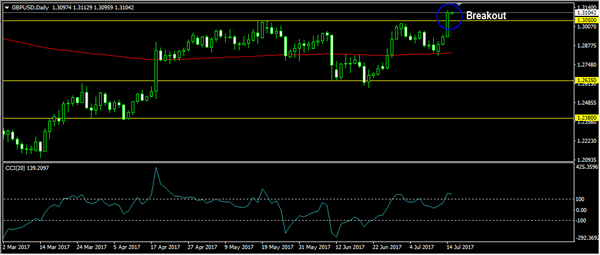
GBPUSD
The GBPUSD had a significant bullish momentum last week, broke above 1.3050 key resistance, topped at 1.3113. This fact activates my bullish mode. The bias is bullish in nearest term testing 1.3200 area. Immediate support is seen around 1.3070/50 region. A clear break below that area could lead price to neutral zone in nearest term testing 1.3000 region. On the upside, a clear break and daily close above 1.3200 would expose 1.3350 area.
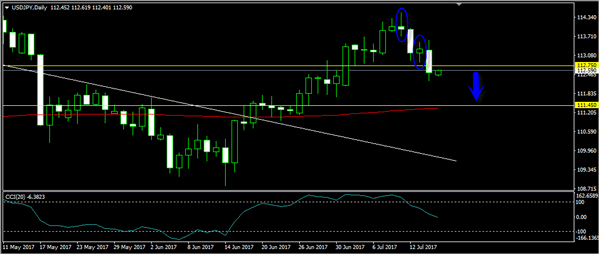
USDJPY
The USDJPY was corrected lower last week, fell below 112.75 key support. This fact activates my neutral mode with a bearish short-term bias testing 111.45 (daily EMA 200). Immediate resistance is seen around 113.00. A clear break above that area could lead price to neutral zone in nearest term testing 113.50 area which need to be clearly broken to the upside to give the bullish scenario another chance. On the downside, a clear break and daily close below 111.45 would expose 111.30/00 region.
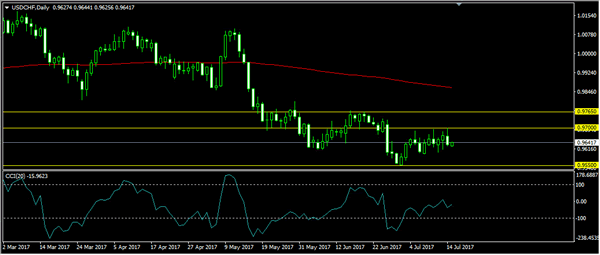
USDCHF
The USDCHF was indecisive last week. Price attempted to push higher topped at 0.9700 but closed lower at 0.9632. The bias is bearish in nearest term testing 0.9600 but key support remains at 0.9550 – 0.9450 region which remains a good place to buy with a tight stop loss below 0.9450. Immediate resistance is seen around 0.9675. A clear break above that area could lead price to neutral zone in nearest term retesting 0.9700 area but key resistance is seen at 0.9765 region which is a good place to sell with a tight stop loss.