The EUR/USD made a new lower low. But price has reached or is close to hitting the 88.6% Fibonacci support. Will price bounce at support?
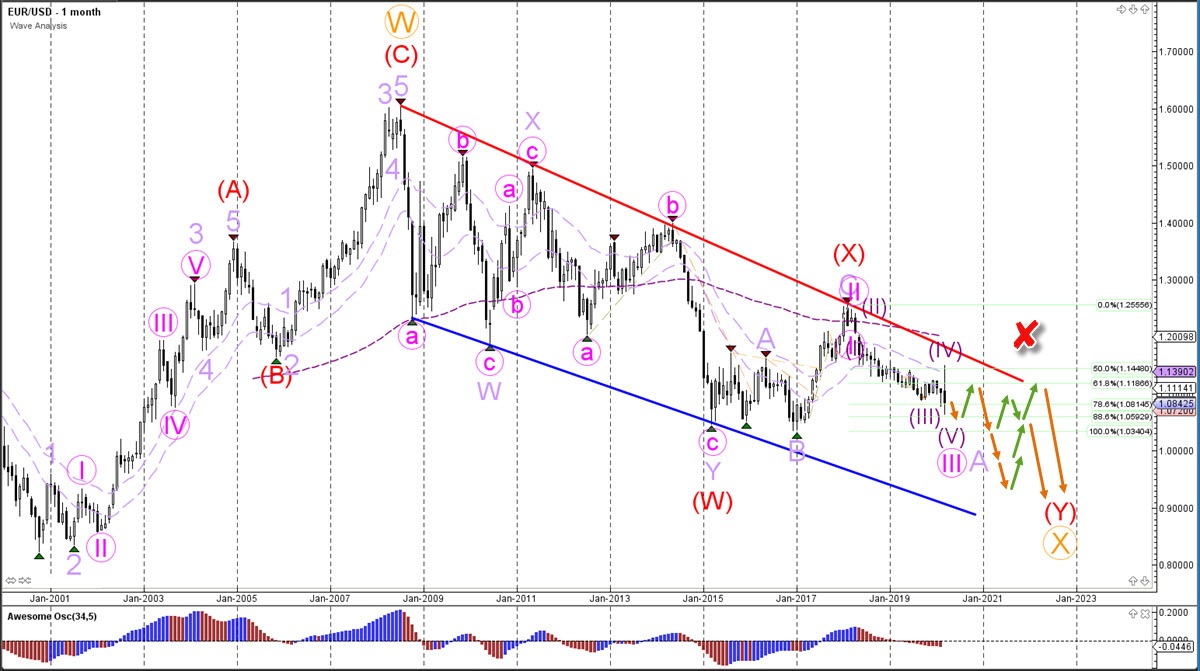
Monthly chart
The EUR/USD is likely to see a retracement. But the overall picture is bearish. After a pullback the EUR/USD looks ready for a decline within the downtrend channel. Price seems to be completing a 5 wave pattern within wave A (light purple) of a larger ABC correction.
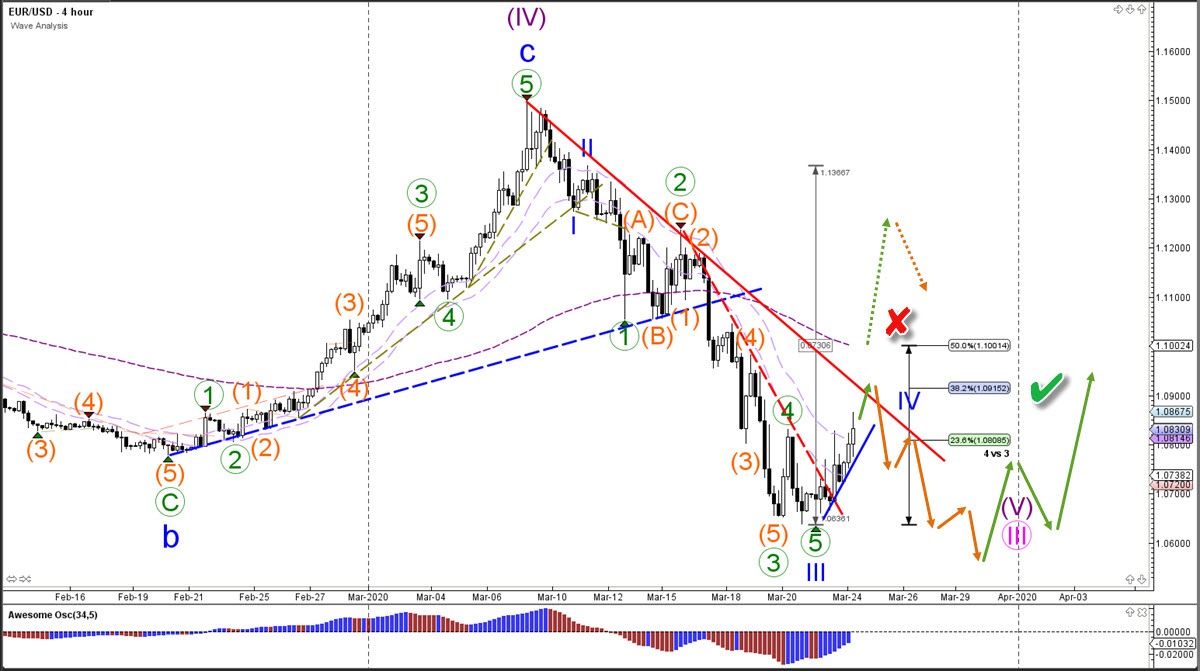
4 hour chart
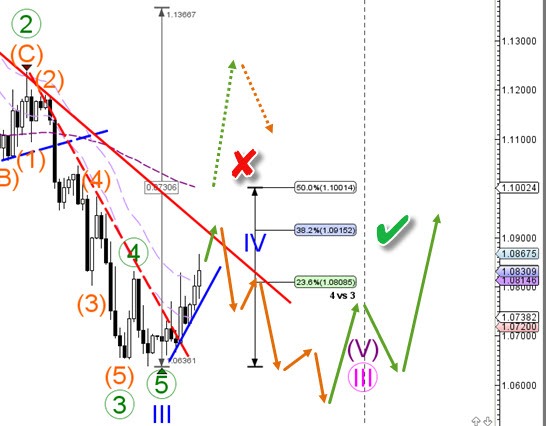
The EUR/USD showed strong bearish momentum. Price is probably in a wave 3-4 (blue) pattern. This is invalid (red x) if price action breaks above the 50% Fibonacci retracement. A bearish bounce at the Fibonacci levels of wave 4 vs 3 could confirm (green check) the downtrend continuation. The main target of a bearish decline is at 1.06 and perhaps as low as 1.05.