
The EUR/USD currency pair
Technical indicators of the currency pair:
Prev Open: 1.18198
Open: 1.18974
% chg. over the last day: +0.69
Day’s range: 1.18939 – 1.19296
52 wk range: 1.0637 – 1.1967
The greenback has become stable against its main competitors after a decline last week. The Fed has approved a new strategy allowing inflation to rise above 2%. The regulator plans to keep interest rates low for a long time. At the moment, EUR/USD quotes are consolidating in the range of 1.1875-1.1925, respectively. The single currency has the potential for further growth. We recommend opening positions from key levels.
The publication of important economic reports is not planned today.
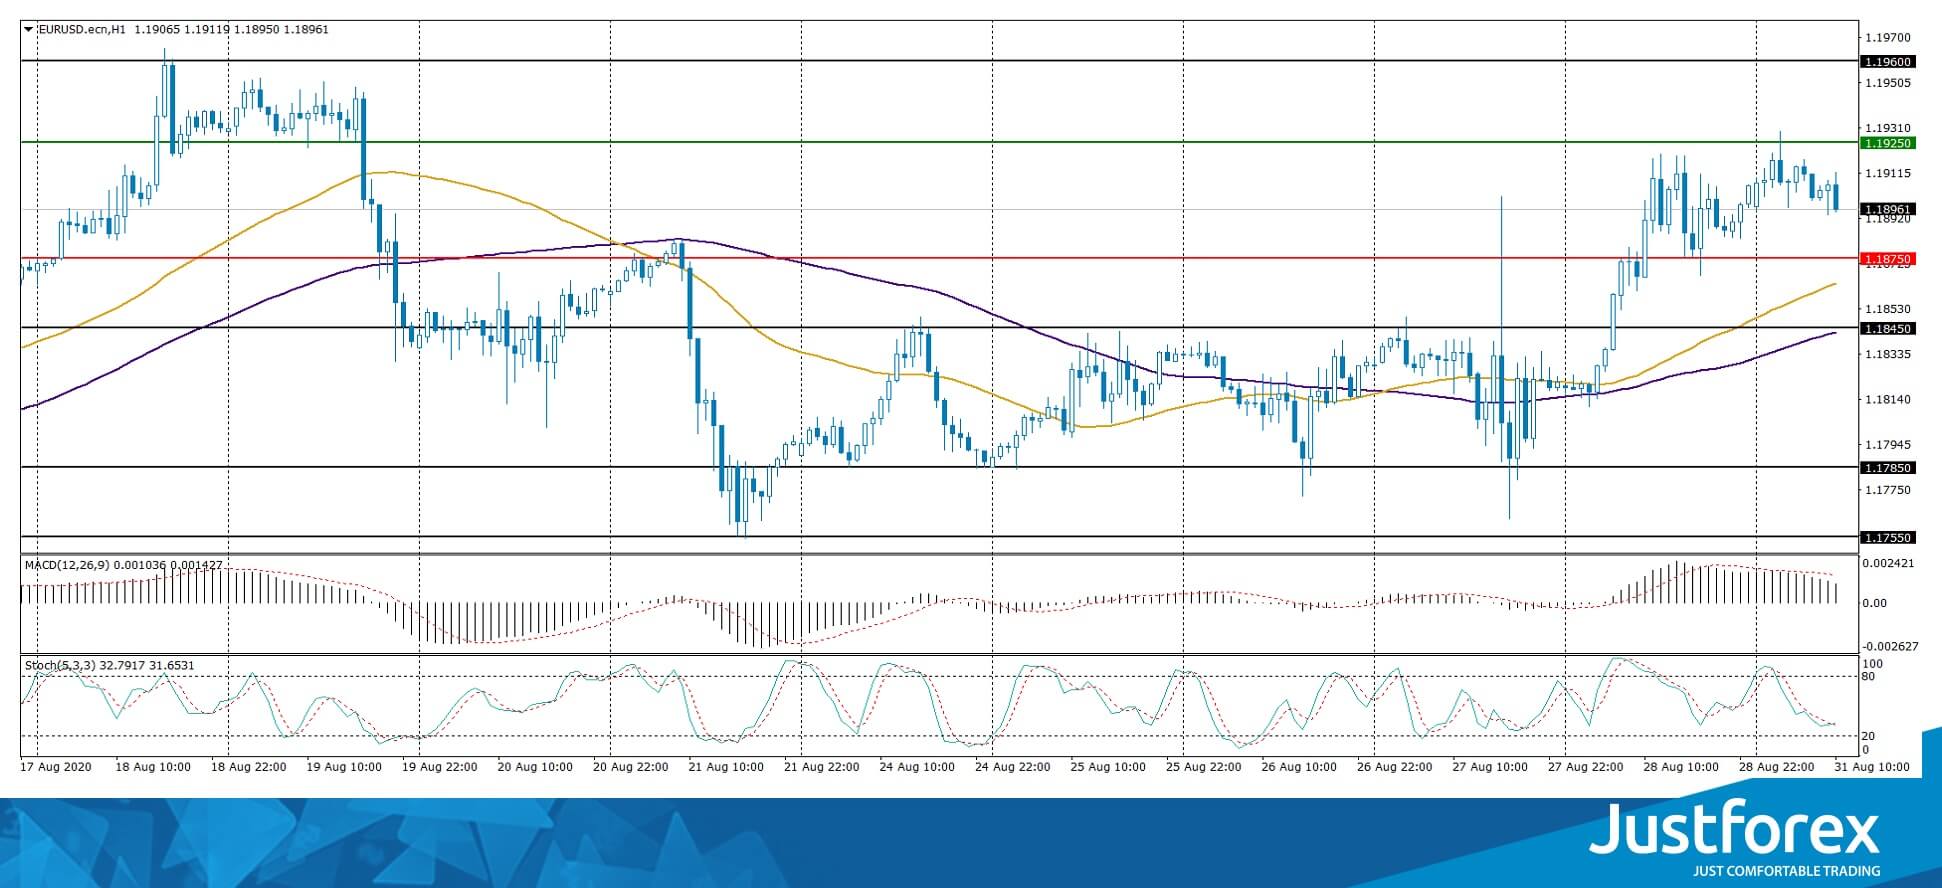
Indicators signal the power of buyers: the price has fixed above 50 MA and 100 MA.
The MACD histogram is in the positive zone, but below the signal line, which gives a weak signal to buy EUR/USD.
Stochastic Oscillator is in the neutral zone, the %K line has crossed the %D line. There are no signals at the moment.
Trading recommendations
Support levels: 1.1875, 1.1845, 1.1785
Resistance levels: 1.1925, 1.1960
If the price fixes above 1.1925, further growth of EUR/USD quotes is expected. The movement is tending to 1.1960-1.1980.
An alternative could be a decline in the EUR/USD currency pair to 1.1840-1.1820.
The GBP/USD currency pair
Technical indicators of the currency pair:
Prev Open: 1.32020
Open: 1.33313
% chg. over the last day: +1.14
Day’s range: 1.33099 – 1.33683
52 wk range: 1.1409 – 1.3516
The bullish sentiment still prevails on the GBP/USD currency pair. The British pound has updated its annual highs. At the moment, the trading instrument is consolidating. The key range is 1.3285-1.3365. The demand for greenback remains at a quite low level. GBP/USD quotes have the potential for further growth. Positions should be opened from key levels.
Today, UK financial markets are closed due to the holiday.
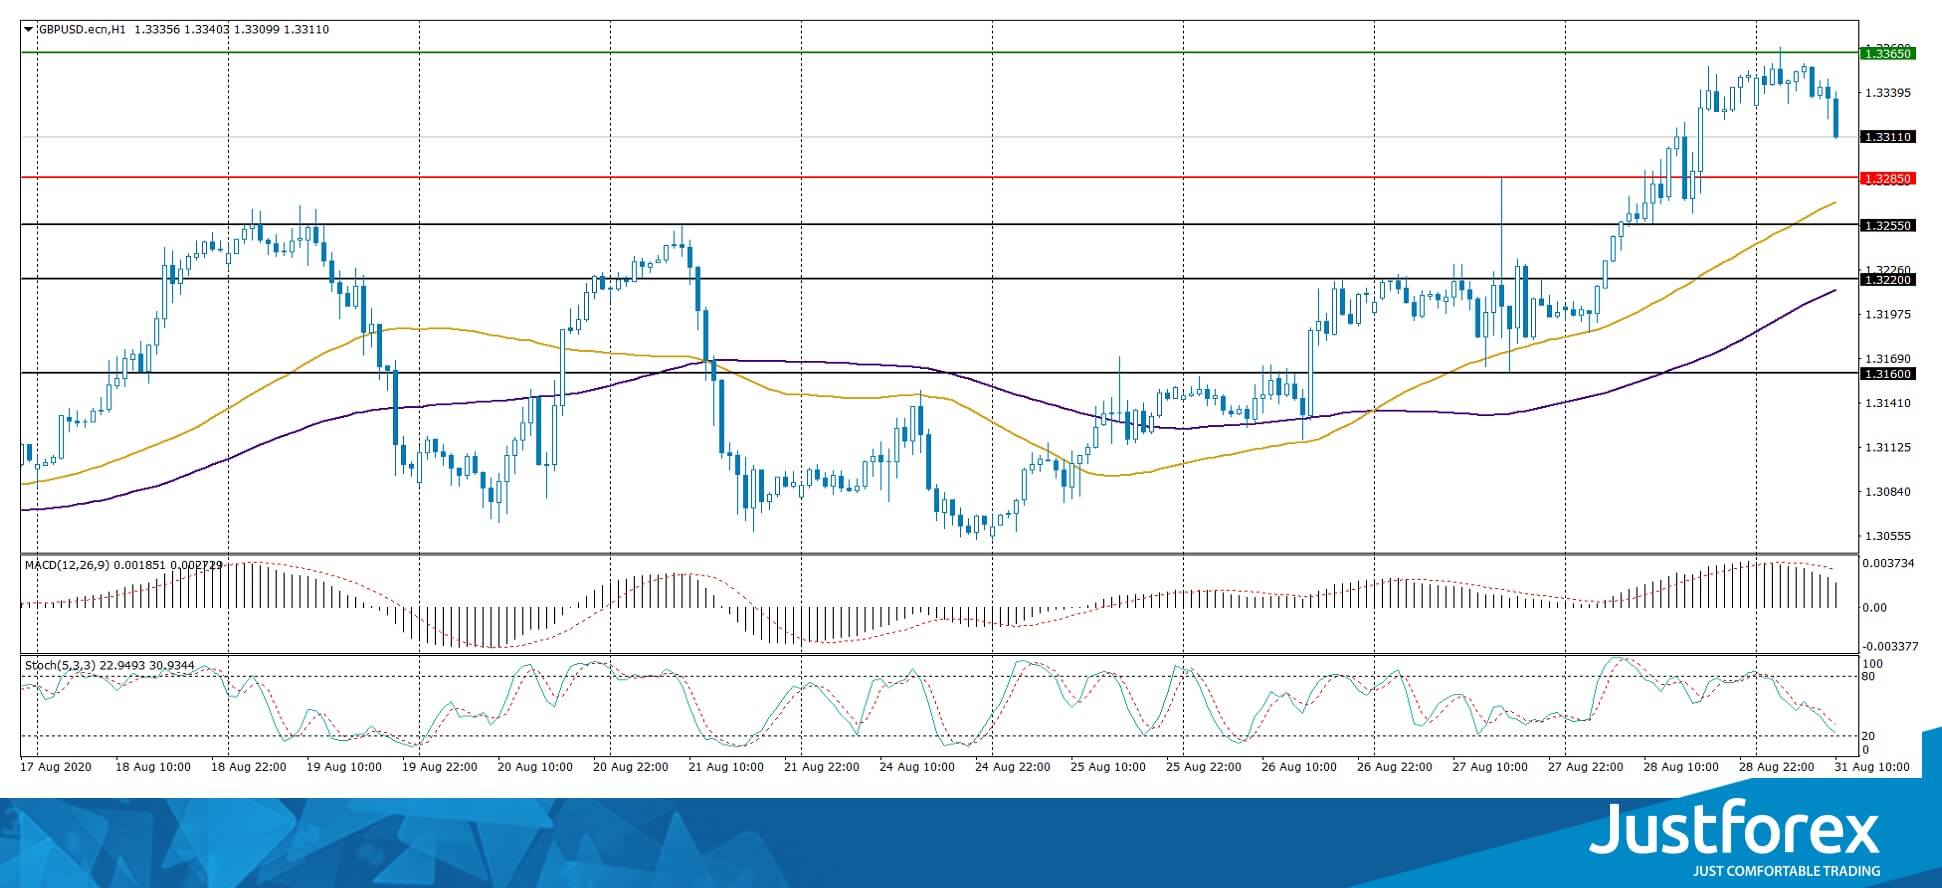
Indicators signal the power of buyers: the price has fixed above 50 MA and 100 MA.
The MACD histogram is in the positive zone, but below the signal line, which gives a weak signal to buy GBP/USD.
Stochastic Oscillator is in the neutral zone, the %K line is below the %D line, which indicates the bearish sentiment.
Trading recommendations
Support levels: 1.3285, 1.3255, 1.3220
Resistance levels: 1.3365, 1.3400
If the price fixes above 1.3365, further growth in GBP/USD quotes is expected. The movement is tending to 1.3400-1.3420.
An alternative could be a decline in the GBP/USD currency pair to 1.3250-1.3220.
The USD/CAD currency pair
Technical indicators of the currency pair:
Prev Open: 1.31188
Open: 1.30950
% chg. over the last day: -0.11
Day’s range: 1.30731 – 1.31045
52 wk range: 1.2949 – 1.4669
USD/CAD quotes are consolidating. The technical pattern is ambiguous. Financial market participants expect additional drivers. At the moment, the local support and resistance levels are 1.3070 and 1.3110, respectively. The trading instrument has the potential for further decline. We recommend paying attention to the dynamics of “black gold” prices. Positions should be opened from key levels.
The news feed on 2020.08.31:
Data on the real estate market in Canada at 15:30 (GMT+3:00).
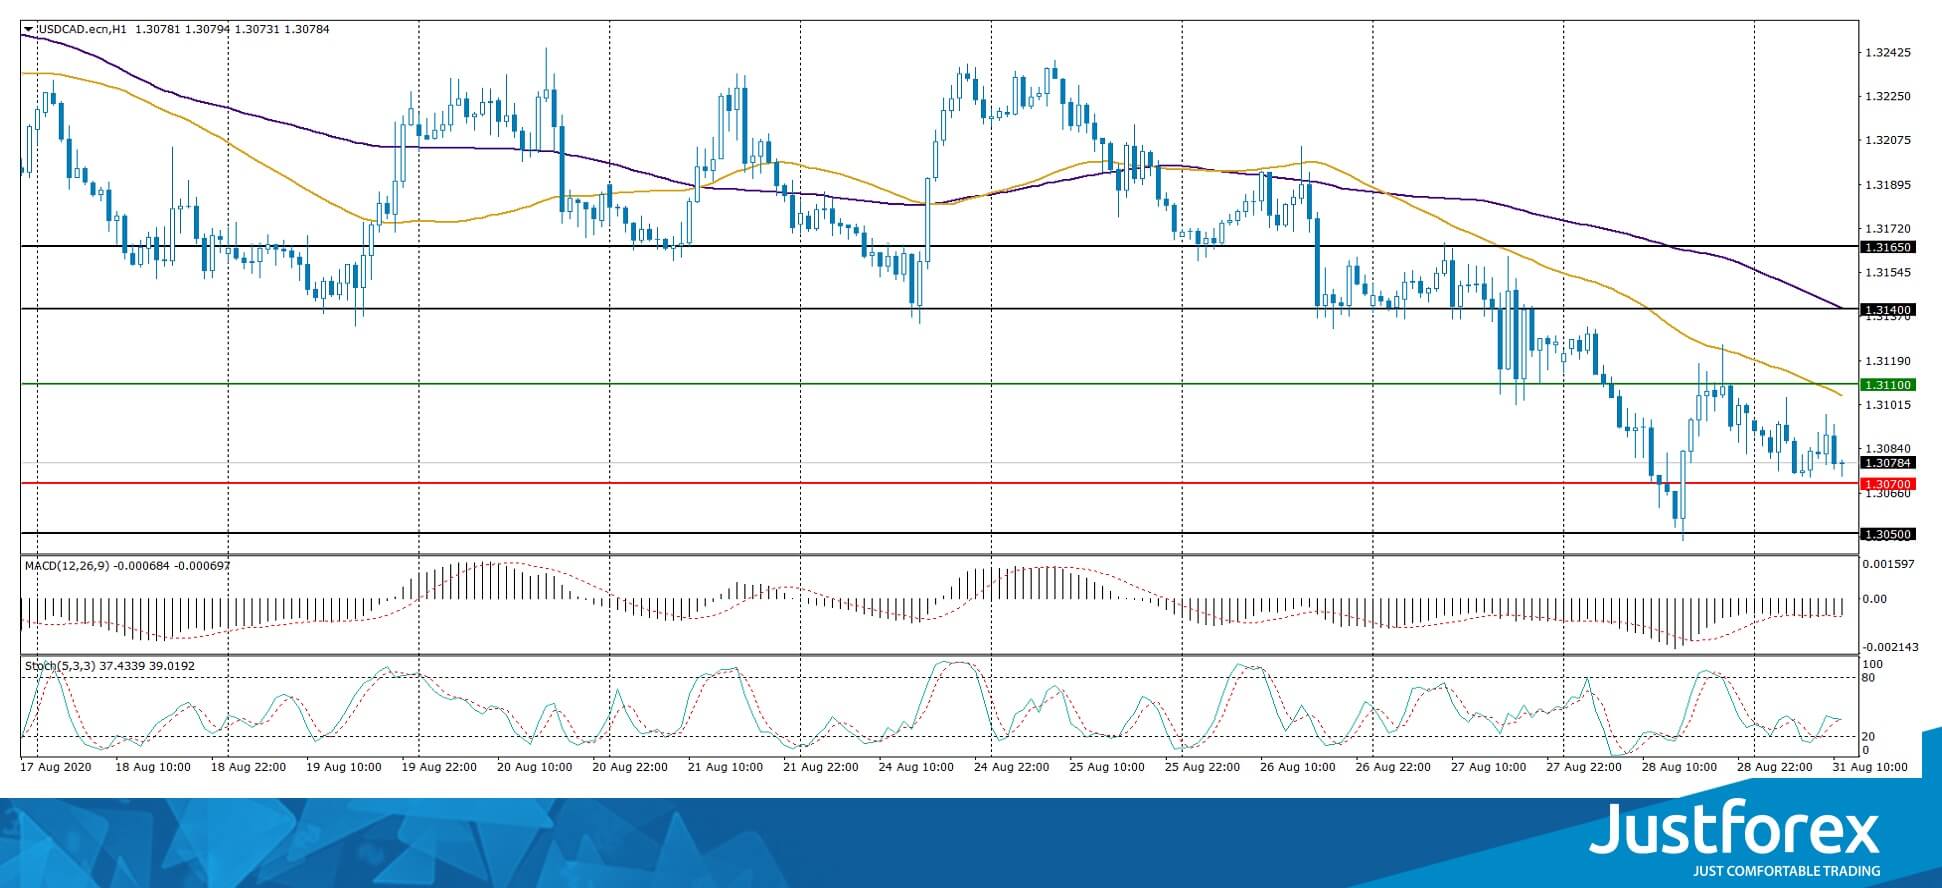
Indicators signal the power of sellers: the price has fixed below 50 MA and 100 MA.
The MACD histogram is in the negative zone, which indicates the bearish sentiment.
Stochastic Oscillator is in the neutral zone, the %K line has crossed the %D line. There are no signals at the moment.
Trading recommendations
Support levels: 1.3070, 1.3050, 1.3020
Resistance levels: 1.3110, 1.3140, 1.3165
If the price fixes below 1.3070, USD/CAD sales should be considered. The movement is tending to 1.3040-1.3020.
An alternative could be the growth of the USD/CAD currency pair to 1.3140-1.3160.
The USD/JPY currency pair
Technical indicators of the currency pair:
Prev Open: 106.557
Open: 105.428
% chg. over the last day: -1.14
Day’s range: 105.290 – 105.874
52 wk range: 101.19 – 112.41
The USD/JPY currency pair has become stable after a sharp decline at the end of last week. At the moment, quotes are consolidating. The trading instrument is testing the “mirror” resistance level of 105.900. The 105.55 level is the nearest support. The yen has the potential for further growth against the greenback. We recommend paying attention to the dynamics of US government bonds yield. Positions should be opened from key levels.
Japan has published positive data on industrial production for July.
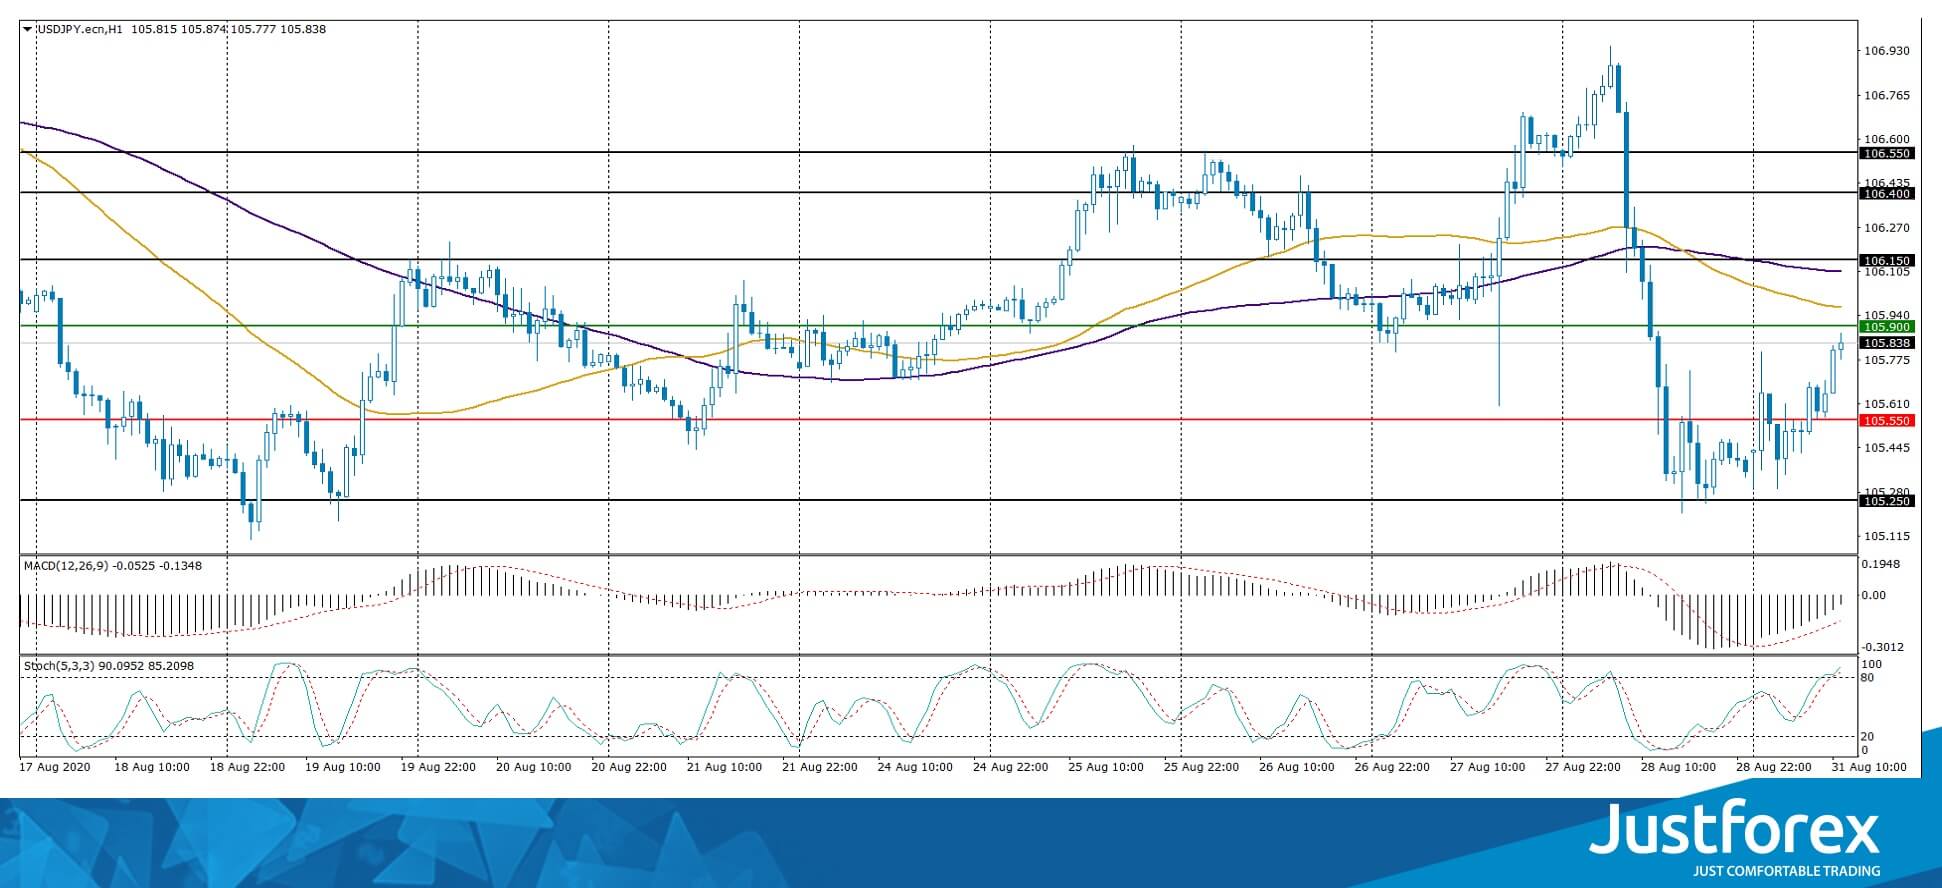
Indicators do not give accurate signals: the price is testing 50 MA.
The MACD histogram is in the negative zone, but above the signal line, which gives a weak signal to sell USD/JPY.
Stochastic Oscillator is in the overbought zone, the %K line is above the %D line, which gives a weak signal to buy USD/JPY.
Trading recommendations
Support levels: 105.55, 105.25, 105.00
Resistance levels: 105.90, 106.15, 106.40
If the price fixes below 105.55, a further drop in USD/JPY quotes is expected. The movement is tending to the round level of 105.00.
An alternative could be the growth of the USD/JPY currency pair to 106.30-106.50.


