EUR/USD
The EUR/USD pair ended Monday pretty much unchanged daily basis, barely a couple of pips above its Friday’s close. The common currency saw some limited demand at the beginning of the day, raising up to 1.1807, although unable to extend gains beyond the level as local data released at the beginning of the day was softer-than-expected, with German industrial production down by 1.1% in June, against the 0.2% advance expected, whilst the annual figure came in at 2.4%, well below previous 4.8%. Also, the EU August Sentix confidence index fell to 27.7 from previous 28.3. Dollar gains were limited, by comments from Fed’s Bullard, who said that current rates should "remain appropriate over the near term, adding that low jobless rate is no threat to inflation. Whilst market’s reaction to the headline was limited, as Bullard is a well-known dove, it reaffirms market’s negative stance towards the greenback.
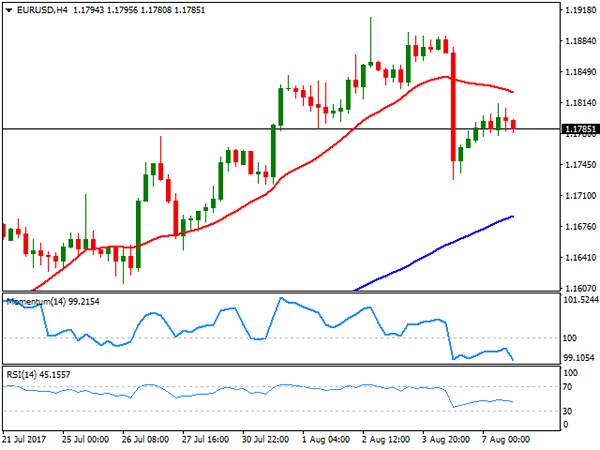
Trading around 1.1785, the 4 hours chart for the EUR/USD pair suggests that the pair can ease further over the next sessions, as the price develops below a modestly bearish 20 SMA, currently around 1.1820, the immediate resistance, whilst technical indicators in the mentioned chart have resumed their declines within negative territory. Too early to consider a top in the pair, the downward move should extend below the 1.1715 support, 2015 yearly high, to be at risk of a steeper downward corrective move after rallying steadily for almost a month.
Support levels: 1.1750 1.1715 1.1680
Resistance levels: 1.1785 1.1820 1.1860
USD/JPY
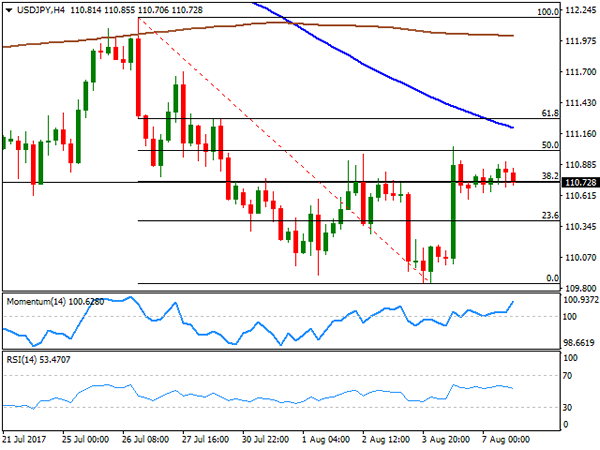
After a modest advance, the USD/JPY pair is back to square one daily basis hovering around the 110.70 price zone. The Japanese yen saw a limited intraday advance amid strength within local equities, as the Nikkei added over 100 points, tracking last Friday’s Wall Street gains, also backed by strong local data. According to the official release, the coincident and leading indexes surged to their highest in over three years last June, with preliminary estimates at 117.2 and 106.3 respectively. Early Tuesday, attention will center on June trade figures, as Japan is expected to present a large surplus after a ¥115.1B deficit posted in June. From a technical point of view, the risk remains towards the downside, as the early intraday advance stalled short of the 50% retracement of its latest daily slide around 111.05, the immediate resistance whilst the 100 SMA maintains its sharp bearish slope well above the current level. The Momentum indicator in the mentioned chart continues heading north within positive territory, but the RSI indicator already turned south around 53, this last anticipating some further slides ahead.
Support levels: 110.35 109.85 109.50
Resistance levels: 111.05 111.40 111.85
GBP/USD
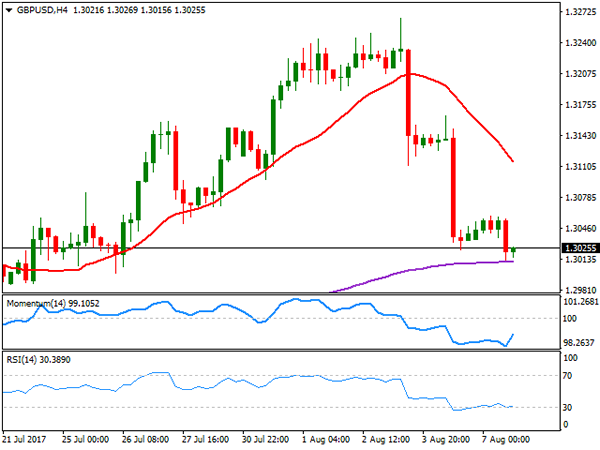
The GBP/USD pair edged lower for third consecutive day, ending the day around 1.3025 after trading as low as 1.3013. News over the weekend showed that the UK IS prepared to pay up to €40 billion as part of a deal to leave the European Union, according to a local newspaper that quoted "sources familiar with the matter," although negotiations have shown little progress over the last few weeks. Uncertainty surrounding Brexit is one of the factors weighing on the pair as noted by the Bank of England last week, when policy makers decided to keep their monetary policy on hold. This Tuesday the UK macroeconomic calendar will remain empty, with the focus on Thursday data, which includes industrial and manufacturing production, the NIESR GDP estimate and the trade balance. In the meantime, the pair remains biased lower, as in the 4 hours chart, the price is pressuring its 200 EMA, around 1.3005 while the 20 SMA extended further lower above the current level. The Momentum indicator aims modestly higher in the mentioned time frame, but the RSI indicator remains flat around 30, this last reflecting limited buying interest around the pair.
Support levels: 1.3000 1.2965 1.2920
Resistance levels: 1.3070 1.3110 1.3150
GOLD
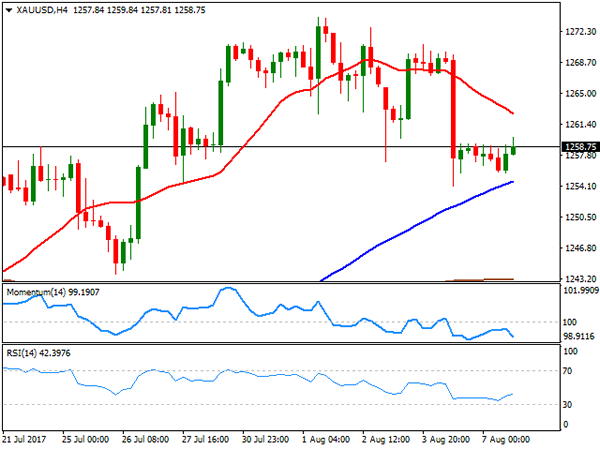
Gold prices remained range bound this Monday, with spot recovering from a daily low of 1,255.69 to end the day pretty much flat at $1,258.75 a troy ounce. The dollar traded firmer against its major rivals, keeping the safe-haven commodity steady near the two- week low posted last Friday. Fed’s Bullard comments on rates, however, limited the downside as he said that he is comfortable with current rates, somehow indicating no rush in implementing the third rate hike promised by the Central Bank at the end of 2016. Technically, the daily chart shows that spot met buying interest around a bullish 20 DMA, which heads north a few points above a flat 100 DMA. In the same chart, however, the Momentum indicator extended its decline, now poised to break below its 100 level, whilst the RSI indicator stabilized around 54. In the shorter term, and according to the 4 hours chart, the risk is towards the downside, as the price remains well below a bearish 20 SMA, whilst the Momentum indicators accelerated south within negative territory as the RSI indicator consolidates around 41.
Support levels: 1,254.10 1,245.20 1,235.20
Resistance levels: 1,265.30 1,274.05 1,283.30
WTI CRUDE OIL
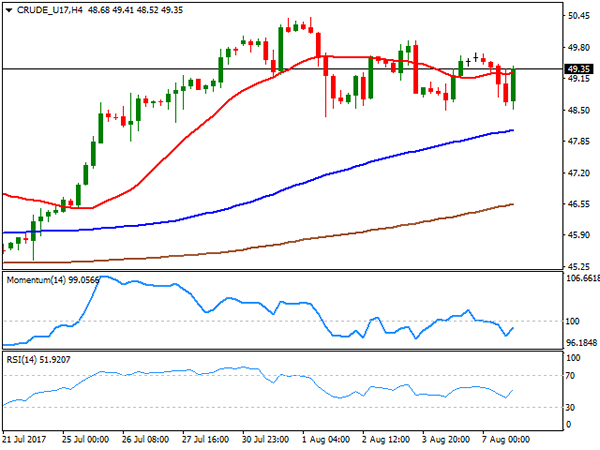
Oil prices edged lower on Monday, but trimmed most of their intraday losses ahead of the close, with West Texas Intermediate crude futures settling at $49.35 a barrel. Major oil producers are is undergoing a two-day meeting in Abu Dhabi, focusing on the compliance level to the output cut pact made last November. Nevertheless, market players will likely wait for US stockpiles data before taking fresh decisions on oil. In the meantime, the daily chart shows that the black gold remains below a flat 200 DMA but above the 20 and 100 DMAs, whilst the Momentum indicator aims north within positive territory, whilst the RSI indicator turned modestly lower, now around 59. In the 4 hours chart, the price is currently struggling with a flat 20 SMA, while technical indicators have turned higher within negative territory, now around their mid-lines, not enough to confirm an upward extension, at this point. The pair presents multiple intraday lows around 48.50, with a break below the level probably opening doors for a steeper decline.
Support levels: 48.50 47.90 47.20
Resistance levels: 49.65 50.20 50.85
DJIA
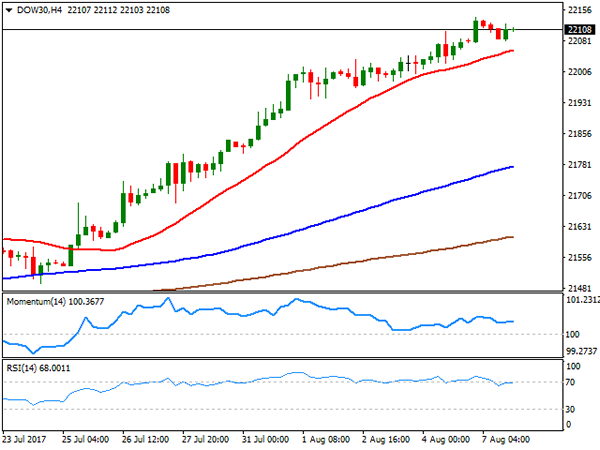
US equities closed modestly higher this Monday, with the Dow posting its ninth consecutive record close, settling at 22,118.42, up daily basis by 25 points. The Nasdaq Composite gained 0.51%, to end at 6,388.77, while the S&P added 4 points, to 2,480.91. Action was limited in the financial world as the NFP dust settled, and investors began the search for the next catalyst. Within the Dow, Apple was the best performer, adding 1.57%, followed by Goldman Sachs that gained 1.25%. United Technologies led decliners with a 2.49% loss, followed by Walt Disney that shed 1.40%. The technical outlook remains positive for the benchmark, as the daily chart for the Dow shows that technical indicators keep advancing despite being in extreme overbought territory, whilst the 20 DMA further advanced below the current level. In the 4 hours chart, technical indicators have turned marginally higher after a period of consolidation within positive territory, whilst the price stands above a bullish 20 SMA, maintaining the risk towards the upside.
Support levels: 22,070 22,023 21,982
Resistance levels: 22,137 22,180 22,225
FTSE100
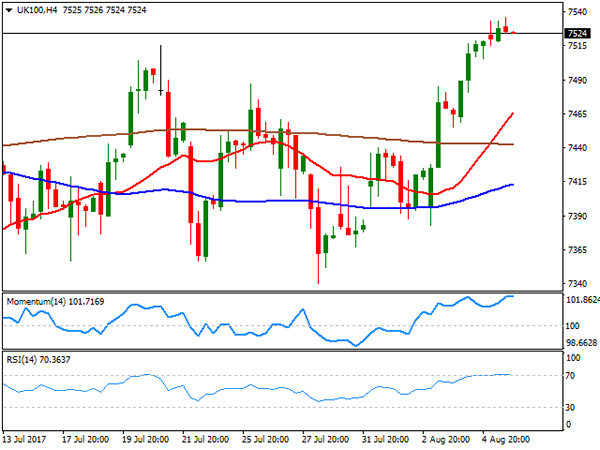
The FTSE 100 added 20 points or 0.27% this Monday to end at 7,531.94 a fresh 2-month high, underpinned by an advance in mining-related equities and a weak Pound. An advance in iron ore prices backed the mining sector, with Anglo American leading the way higher, up 3.11%, followed by Glencore that gained 2.59% and Rio Tinto that closed 2.57% higher. Paddy Power Betfair led decliners, closing 4.67% lower, followed by Pearson that shed 3.81%, with retailers under pressure after Visa said that household spending fell by 0.8% in July within the UK. The daily chart for the index shows that it advanced further above its 20 and 100 DMAs, while technical indicators hold well into positive territory, although losing their bullish strength. In the 4 hours chart, technical indicators have also lost upward strength, but within overbought territory, but the index settled well above a bullish 20 SMA that finally crossed above the 200 SMA, all of which suggesting the advance may continue this Tuesday.
Support levels: 7,487 7,440 7,392
Resistance levels: 7,540 7,572 7,600
DAX
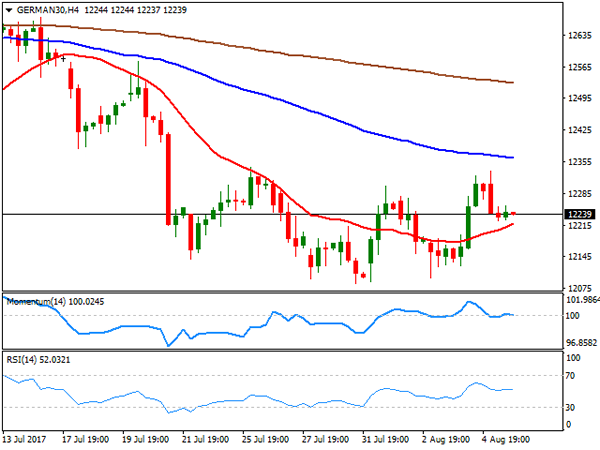
The German DAX closed the day 540 points lower at 12,257.17, as trading within European equities was choppy. Denting German shares were local soft macroeconomic industrial production figures, although gains in banking related equities maintained losses limited. Most members closed lower, with Fresenius being the worst performer, down 1.50%. Deutsche Telekom, on the other hand, led advancers adding 1.43%. Commerzbank added 0.66%, while Deutsche Bank shed 0.62%. From a technical point of view, the index remains biased lower, as an intraday advance met selling interest around a bearish 20 DMA that extended its slide below the 100 DMA, whilst technical indicator have lost their upward momentum within positive territory. In the shorter term, and according to the 4 hours chart, the index remains a few points above a modestly bullish 20 SMA, but below the 100 and 200 SMAs, whilst technical indicators turned flat around their mid-lines, failing to give clear directional clues.
Support levels: 12,210 12,174 12,128
Resistance levels: 12,275 12,323 12,381