
The EUR/USD currency pair
Technical indicators of the currency pair:
Prev Open: 1.16265
Open: 1.16699
% chg. over the last day: +0.25
Day’s range: 1.16607 – 1.16841
52 wk range: 1.0637 – 1.2012
The EUR/USD currency pair has become stable after a prolonged fall. At the moment, the trading instrument is consolidating. Local support and resistance levels are 1.1645 and 1.1685, respectively. Investors expect a debate between Donald Trump and Joe Biden, as well as updates on a new stimulus package in the US. Positions should be opened from key levels.
At 17:00 (GMT+3:00), CB consumer confidence index will be published.
We also recommend paying attention to the speeches by the FOMC representatives.
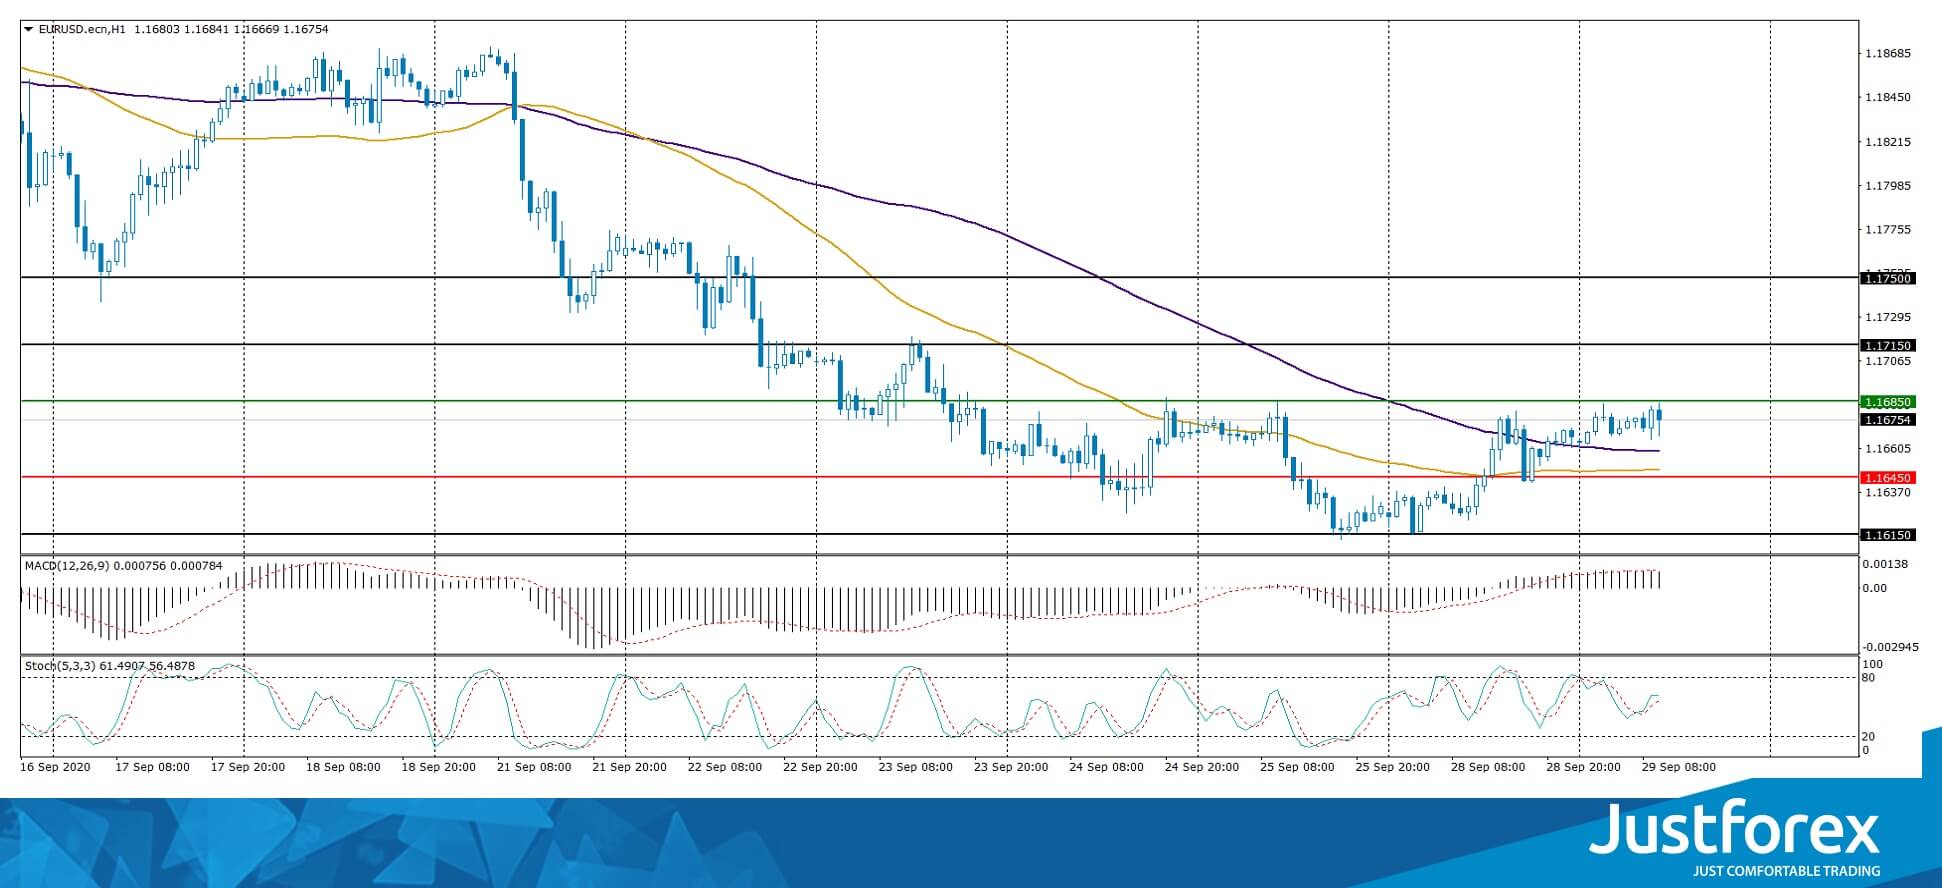
Indicators do not give accurate signals: the price is consolidating near the 100 MA.
The MACD histogram is in the positive zone, which indicates the bullish sentiment.
Stochastic Oscillator is in the neutral zone, the %K line is above the %D line, which gives a signal to buy EUR/USD.
Trading recommendations
Support levels: 1.1645, 1.1615, 1.1600
Resistance levels: 1.1685, 1.1715, 1.1750
If the price fixes above 1.1685, EUR/USD quotes are expected to correct. The movement is tending to 1.1715-1.1750.
An alternative could be a decline in the EUR/USD currency pair to 1.1615-1.1590.
The GBP/USD currency pair
Technical indicators of the currency pair:
Prev Open: 1.27618
Open: 1.28319
% chg. over the last day: +0.49
Day’s range: 1.28308 – 1.28846
52 wk range: 1.1409 – 1.3516
GBP/USD quotes have been growing. During yesterday’s and today’s trading sessions, the British pound added more than 120 points in price. At the moment, the trading instrument is consolidating. The GBP/USD currency pair is testing local support and resistance levels: 1.2830 and 1.2885, respectively. Further growth of GBP/USD quotes is possible. Financial market participants expect up-to-date information concerning the Brexit negotiations. Positions should be opened from key levels.
The publication of important UK economic reports is not planned.
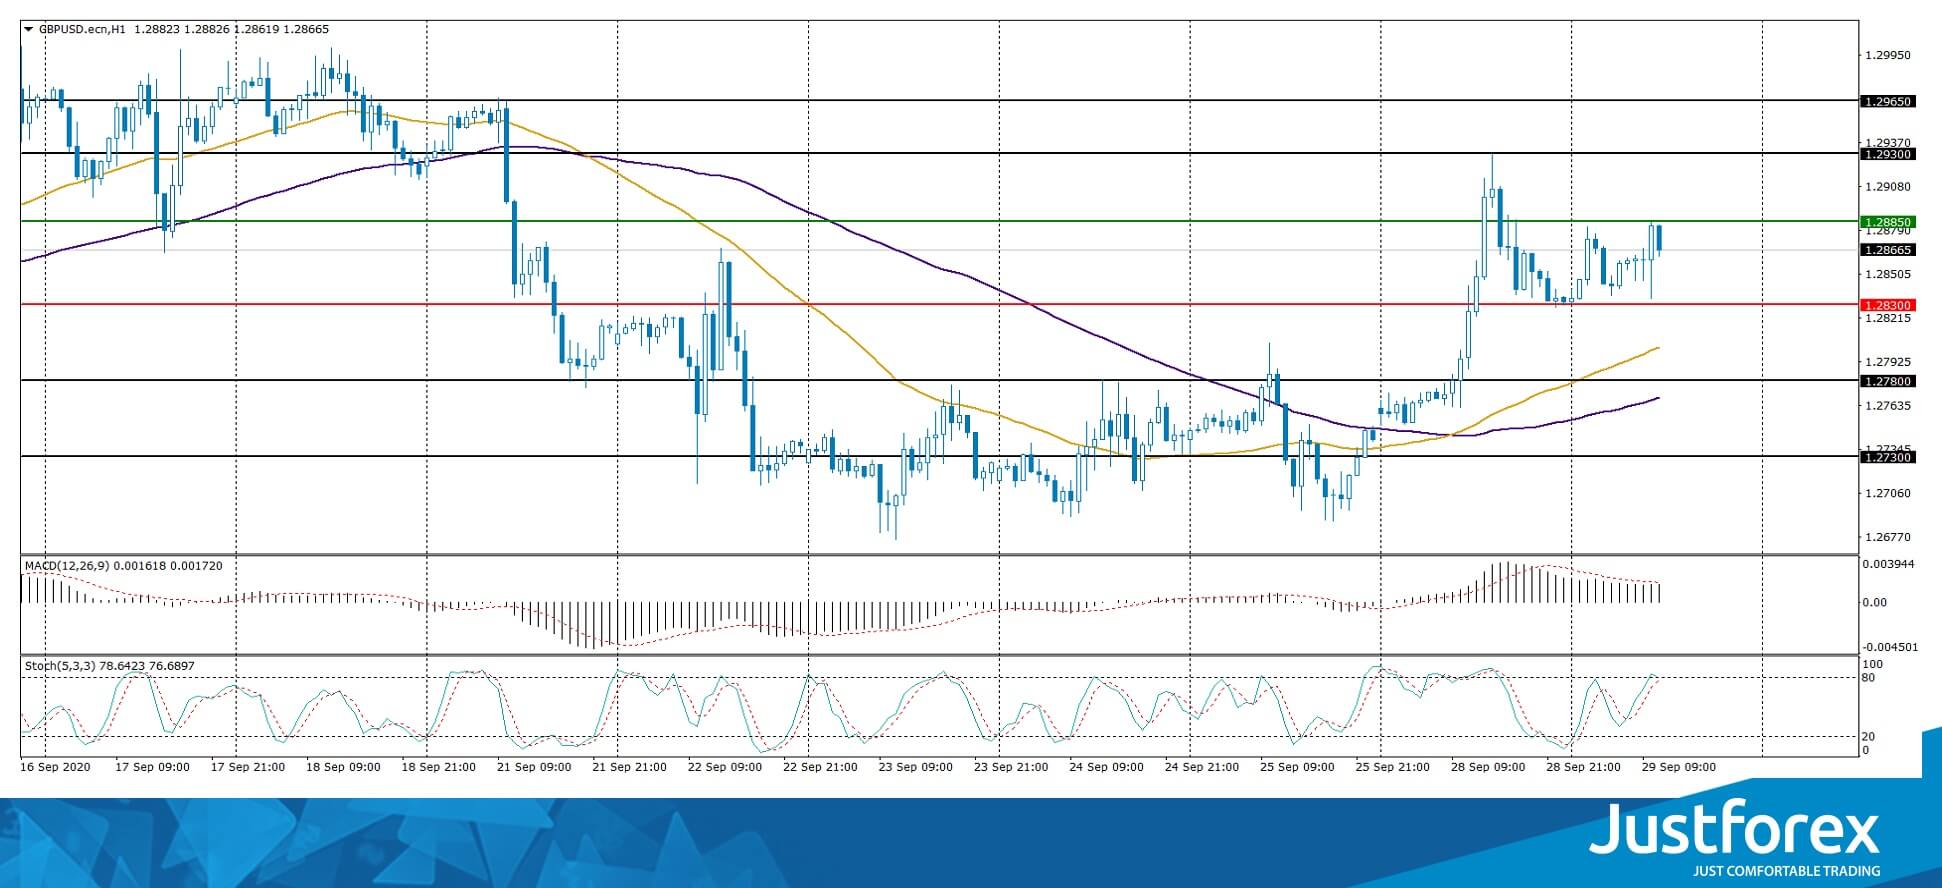
Indicators signal the power of buyers: the price has fixed above 50 MA and 100 MA.
The MACD histogram is in the positive zone, which indicates the bullish sentiment.
Stochastic Oscillator is near the overbought zone, the %K line has started crossing the %D line. There are no signals at the moment.
Trading recommendations
Support levels: 1.2830, 1.2780, 1.2730
Resistance levels: 1.2885, 1.2930, 1.2965
If the price fixes above 1.2885, further growth of the GBP/USD currency pair is expected. The movement is tending to 1.2930-1.2970.
An alternative could be a drop in GBP/USD quotes to 1.2800-1.2760.
The USD/CAD currency pair
Technical indicators of the currency pair:
Prev Open: 1.33820
Open: 1.33682
% chg. over the last day: -0.07
Day’s range: 1.33560 – 1.33920
52 wk range: 1.2949 – 1.4669
USD/CAD quotes continue to consolidate. There is no defined trend. At the moment, the local support and resistance levels are 1.3355 and 1.3390, respectively. Investors expect additional drivers. In the near future, a technical correction of the trading instrument is possible. We recommend paying attention to the dynamics of “black gold” prices. Positions should be opened from key levels.
The news feed on Canada’s economy is calm.
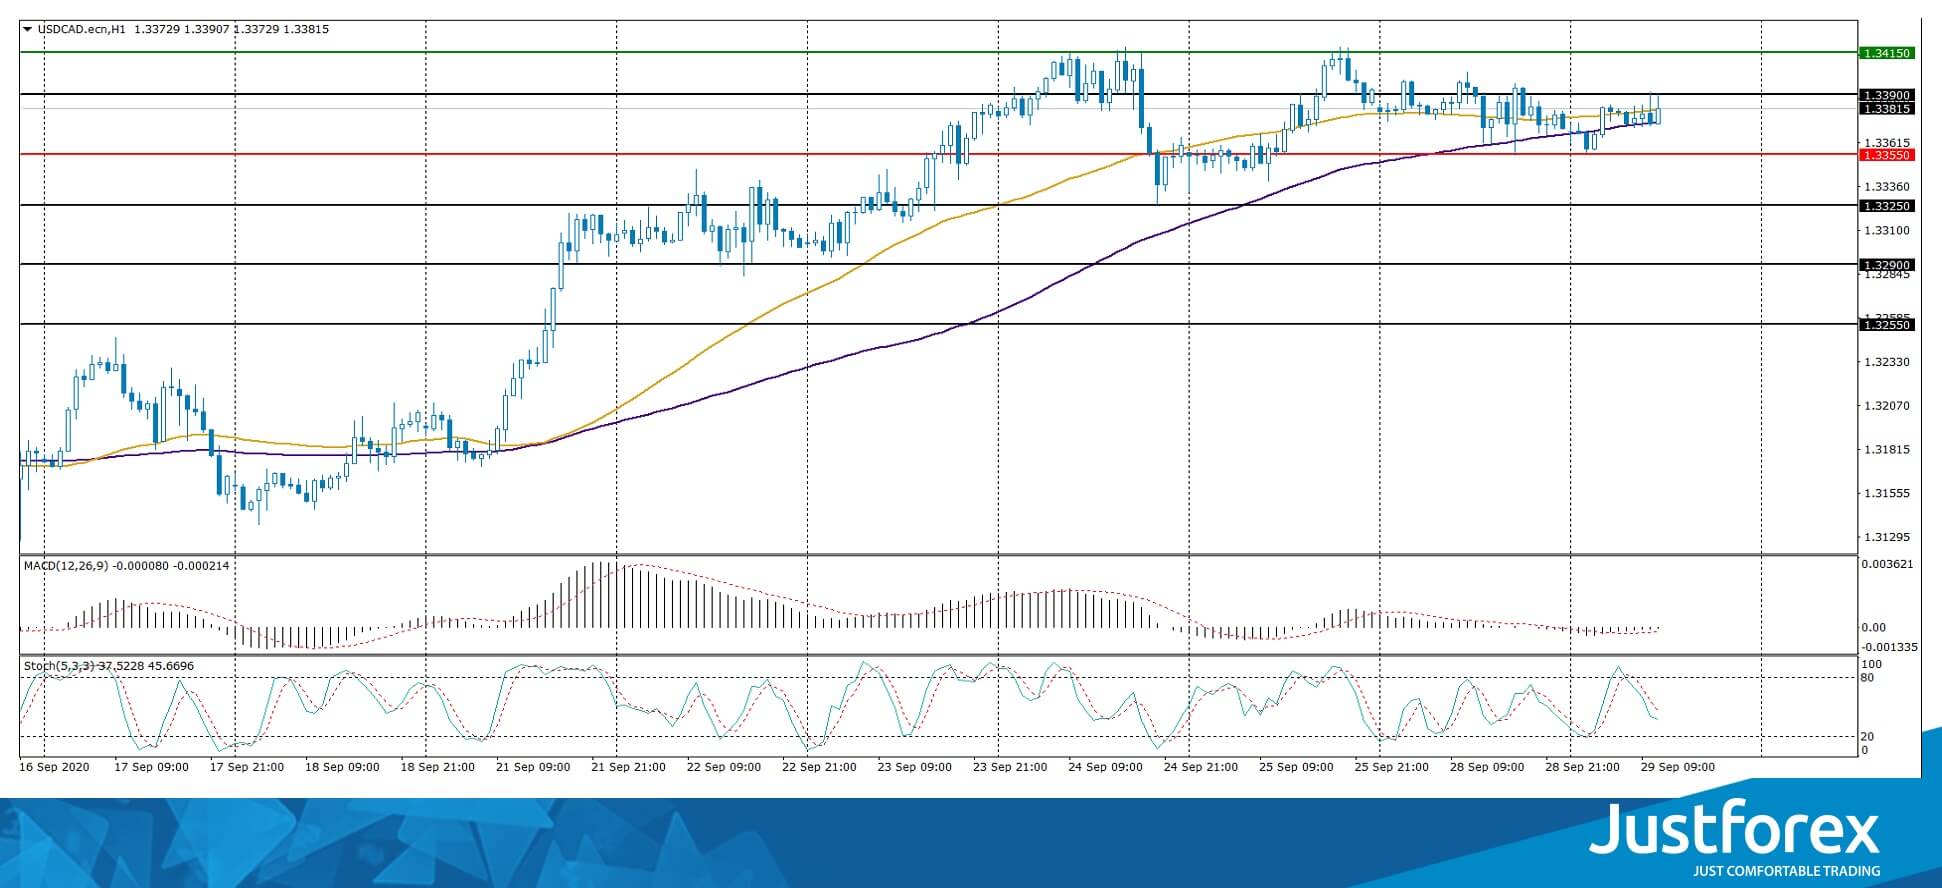
Indicators do not give accurate signals: the price has crossed the 50 MA and 100 MA.
The MACD histogram is near the 0 mark. There are no signals at the moment.
Stochastic Oscillator is in the neutral zone, the %K line is below the %D line, which indicates the bearish sentiment.
Trading recommendations
Support levels: 1.3355, 1.3325, 1.3290
Resistance levels: 1.3390, 1.3415, 1.3450
If the price fixes above 1.3415, further growth in USD/CAD quotes is expected. The movement is tending to 1.3450-1.3470.
An alternative could be a decrease in the USD/CAD currency pair to 1.3325-1.3290.
The USD/JPY currency pair
Technical indicators of the currency pair:
Prev Open: 105.480
Open: 105.461
% chg. over the last day: -0.09
Day’s range: 105.342 – 105.707
52 wk range: 101.19 – 112.41
The USD/JPY currency pair is still being traded in flat. The technical pattern is ambiguous. The trading instrument is consolidating near two-week highs. USD/JPY quotes are testing the level of 105.70. The 105.35 level is the nearest support. Investors expect additional drivers. We recommend paying attention to the dynamics of the US government bonds yield. Positions should be opened from key levels.
The news feed on Japan’s economy is quite calm.
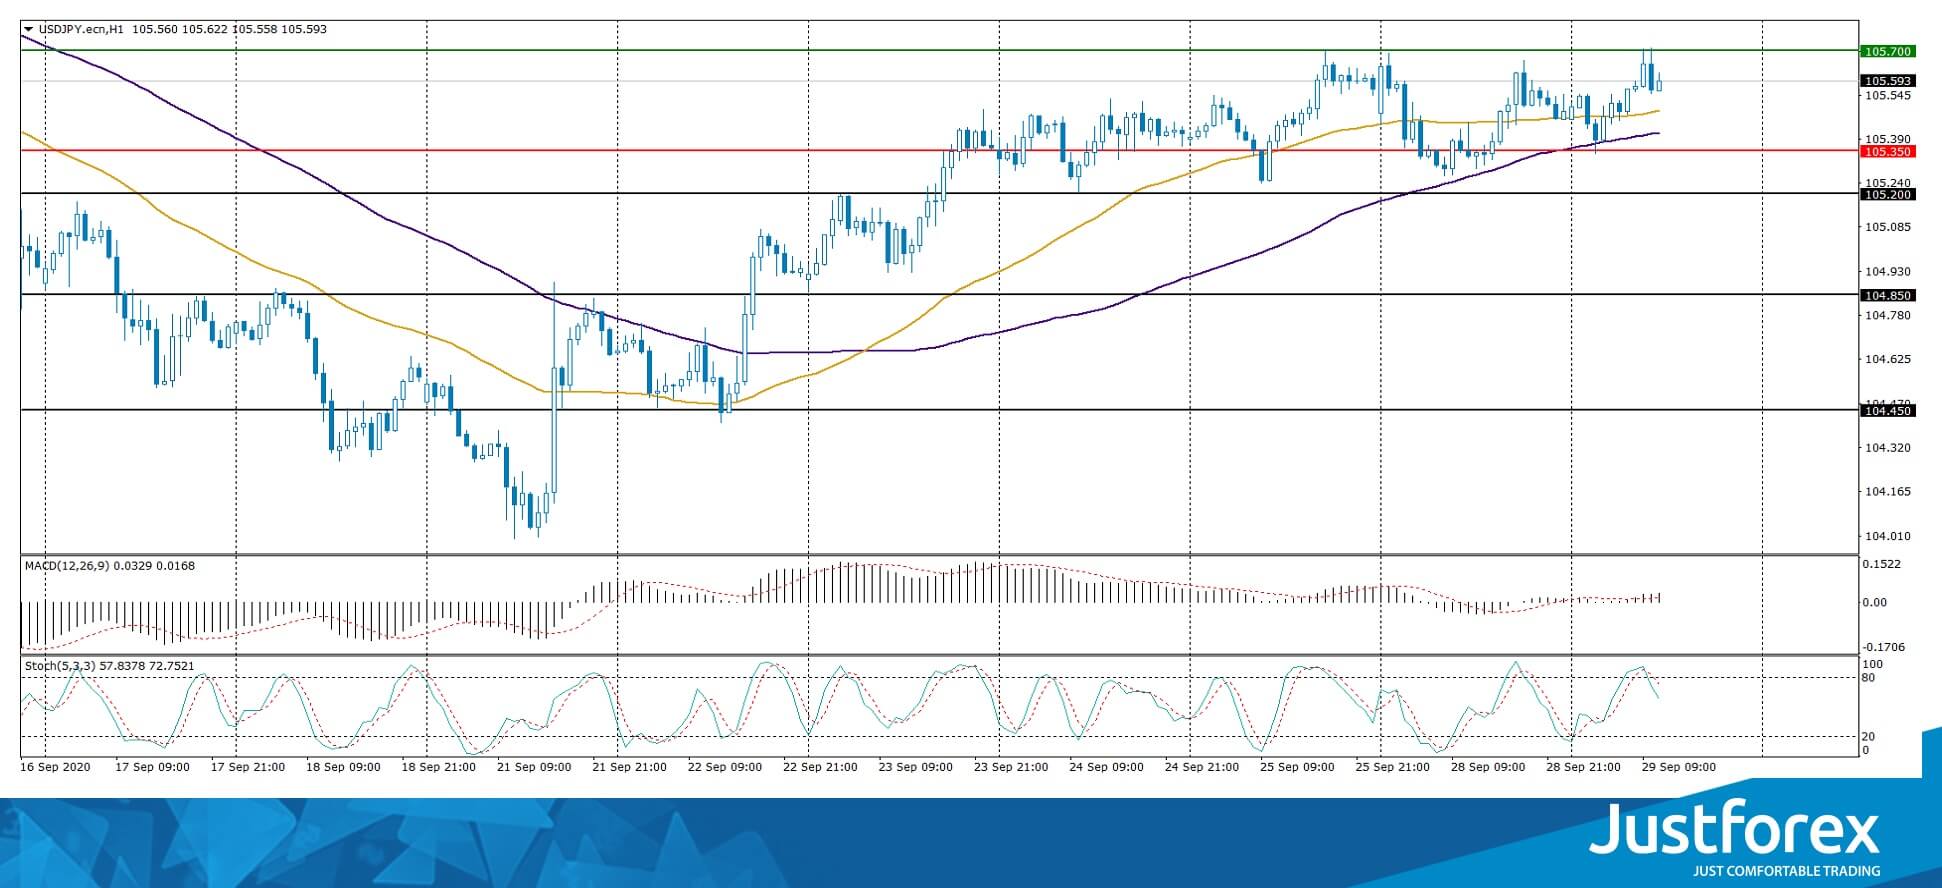
Indicators do not give accurate signals: the price is consolidating near 50 MA and 100 MA.
The MACD histogram has started growing, which indicates the bullish sentiment.
Stochastic Oscillator is in the neutral zone, the %K line is below the %D line, which gives a signal to sell USD/JPY.
Trading recommendations
Support levels: 105.35, 105.20, 104.45
Resistance levels: 105.70, 106.00
If the price fixes above 105.70, further growth in USD/JPY quotes is expected. The movement is tending to 106.00-106.30.
An alternative could be a decline in the USD/JPY currency pair to 105.00-104.80.


