The EUR/USD currency pair
Technical indicators of the currency pair:
Prev Open: 1.2141
Prev Close: 1.2119
% chg. over the last day: -0.18%
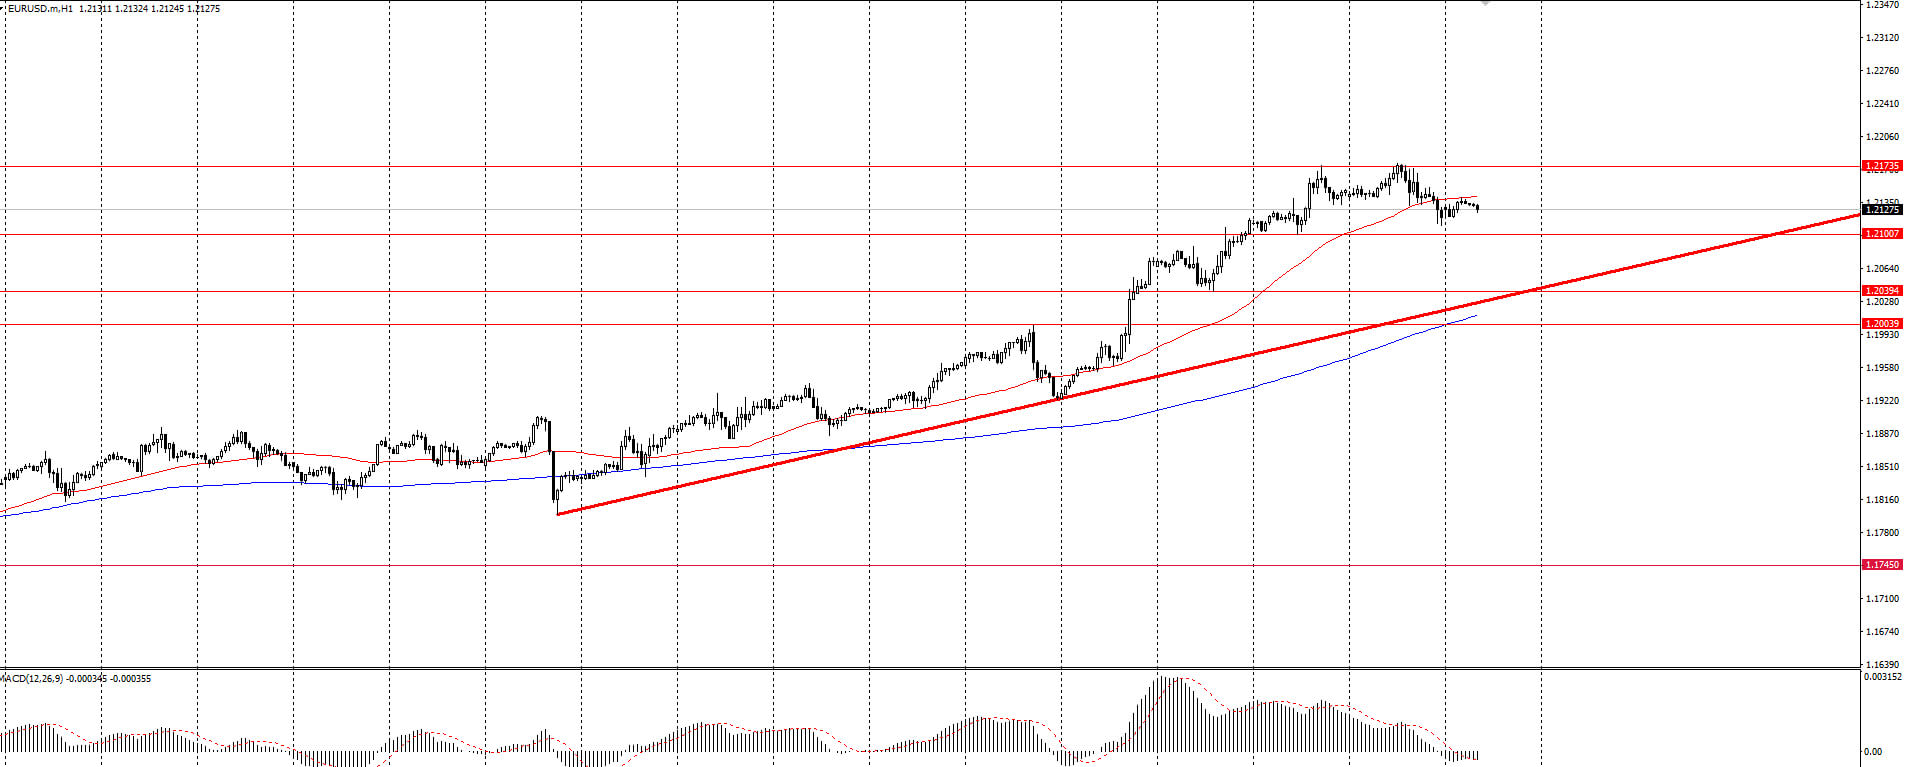
On Friday, EUR/USD was traded in a downtrend and showed -0.18%. An uptrend is observed on the chart, which indicates the predominance of purchases on this asset. On the hourly timeframe, the price is being traded above the moving average MA 200. On the H4 timeframe, the situation is similar. The MACD indicator is currently in the negative zone on H1. Based on the above, it is worth considering only buy positions while the price is above MA 200 on H1.
Trading recommendations
Support levels: 1.2100,1.2039,1.2000
Resistance levels: 1.2173
The main scenario for trading EUR/USD is looking to buy entry points. Now the currency pair is making a correction. It is best to look for buy entry points when the price rolls back to the trend line or to the level of 1.2039. With the opening of long positions, quotes can reach the level of 1.2173. If the price can break through and fix above the level of 1.2173, quotes may go to 1.2200. It is also worth noting that divergence is observed on the H1 timeframe, which may signal the beginning of a pair correction.
Alternative scenario: if the price fixes below the level of 1.2039 on the H1 timeframe and below MA 200 on the H1, the currency pair may decline to the level of 1.2000.
The GBP/USD currency pair
Technical indicators of the currency pair:
Prev Open: 1.3438
Prev Close: 1.3431
% chg. over the last day: -0.05%
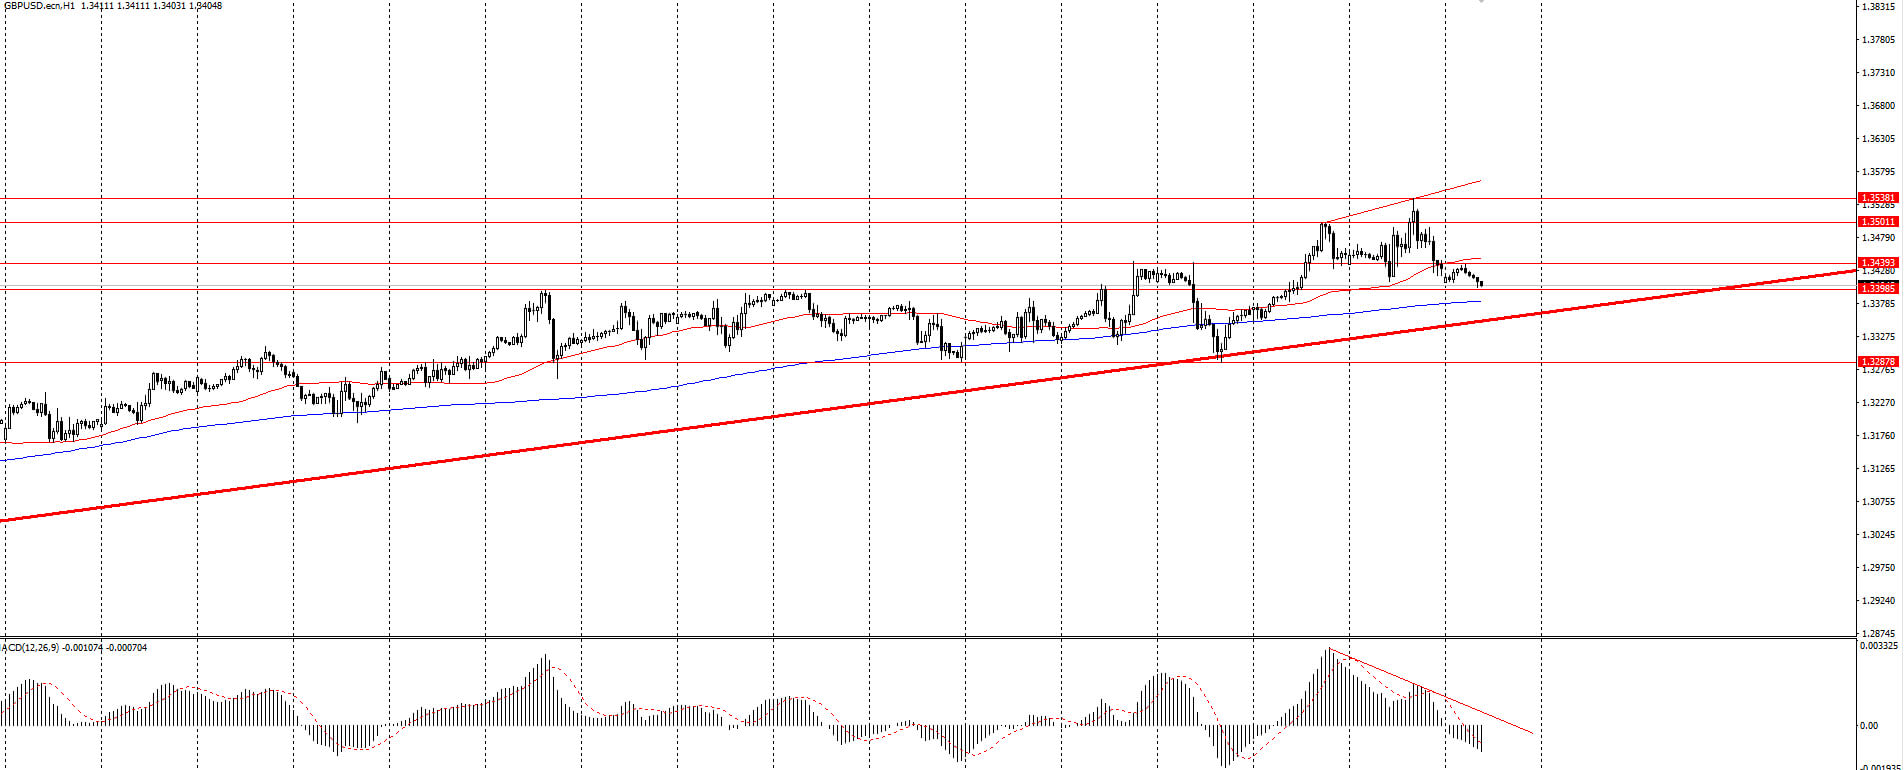
On Friday, the GBP/USD currency pair was traded within the range 1.3415 – 1.3530 and showed a dynamics of -0.05%. On the hourly chart, GBP/USD is being traded above the moving average MA 200 H1. The situation is similar on the four-hour chart. The MACD indicator is in the negative zone on H1. An uptrend is maintained. Based on the above, it’s probably worth holding to bull trading and as long as the currency pair remains above MA 200 H1, it’s necessary to look for buy entry points.
Trading recommendations
Support levels: 1.3398, 1.3287
Resistance levels: 1.3439 1.3500, 1.3538
The main scenario: look for buy entry points. Now the pair is making a correction. Buying an asset should be considered at the level of 1.3398, as well as when the price rolls back to the trend line. With the opening of long positions, quotes can go to the level of 1.3500. It is also worth noting that divergence is observed on the MACD on the H1 timeframe. This may signal the beginning of a pair correction.
Alternative scenario: if the price fixes below 1.3398, you can consider selling the asset to the trend line.
The USD/JPY currency pair
Technical indicators of the currency pair:
Prev Open: 103.84
Prev Close: 104.19
% chg. over the last day: +0.33%
On Friday, the USD/JPY currency pair was traded in an uptrend and closed the day with a result of +0.33%. On the hourly chart, the currency pair has fixed below the moving average MA 200. On the four-hour chart, the price is below MA 200. MACD indicator on the H1 is in the positive zone. Based on the above, you can try to look for entry points to sell the asset.
Trading recommendations
Support levels: 103.84, 103.65, 103.18
Resistance levels: 104.22, 104.75
The main scenario: consider selling an asset. It is best to look for entry points when the price breaks through the level of 103.84 and fixes below it. With the opening of short positions, quotes can go to the level of 103.65.
An alternative scenario assumes consolidation above the level of 104.22 with a subsequent increase to the level of 104.75.
The USD/CAD currency pair
Technical indicators of the currency pair:
Prev Open: 1.2858
Prev Close: 1.2785
% chg. over the last day: -0.57%
Yesterday the USD/CAD currency pair was traded in a downtrend and closed at -0.57%. On the H1 timeframe, USD/CAD is below the moving average MA 200. On the four-hour chart, the price is below the moving average. Based on the above, it is worth considering selling an asset.
Trading recommendations
Support levels: 1.2770
Resistance levels: 1.2868, 1.2928, 1.2985, 1.3010,1.3091
The main scenario: we recommend considering the sale of an asset. It is best to look for a sell entry point when the price rolls back to the trend line or to the resistance level of 1.2868 when a signal is generated on lower timeframes.
Alternative scenario: if the price can break the trend line and fix above the level of 1.2868, you can consider a buy position to the level of 1.2928.