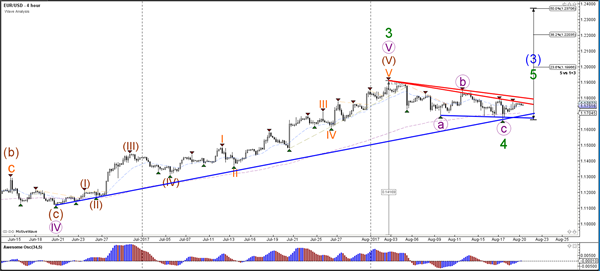
Currency pair EUR/USD
The EUR/USD is building a bull flag continuation chart pattern above the long-term trend line (blue), local support (blue), and long-term moving average, which favours a wave 4 (green) correction. A bullish break above resistance (red) would confirm the end of wave 4 and start of wave 5.
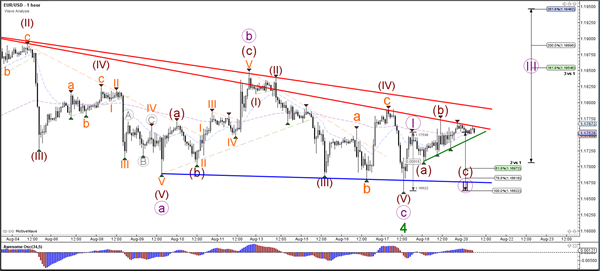
The EUR/USD seems to be building a wave 1-2 (purple) as long as price stays above the 100% Fib level of wave 2 vs 1. A break above resistance (red) line could see the start of wave 3.
Currency pair USD/JPY
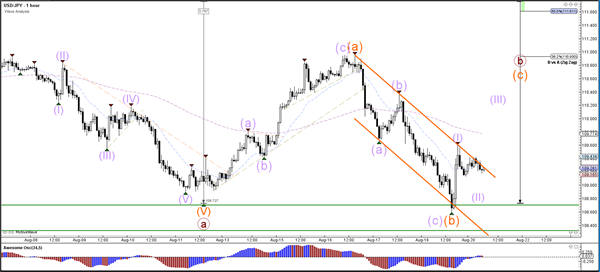
The USD/JPY has retested key support zone (green lines), which will act as bounce or break spot. A bullish bounce could see price expand a wave B (brown) correction via an ABC (orange) flat whereas a bearish break would indicate a downtrend continuation and the completion of wave B (brown) at 111 (where A orange is now).
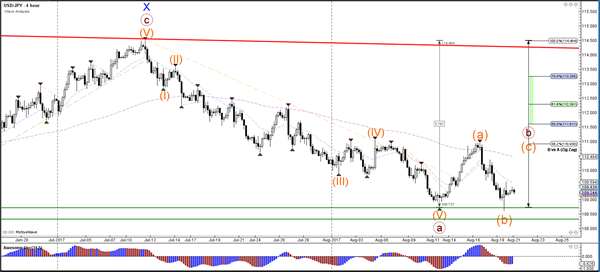
The USD/JPY is testing the resistance trend line of the bearish channel (orange lines).
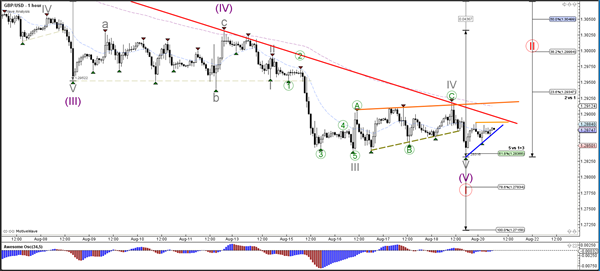
Currency pair GBP/USD
The GBP/USD could have completed a 5th wave (purple) within wave 1 (red). A bearish bounce at the resistance trend line (red) could see price move lower towards the Fib targets of wave 5.
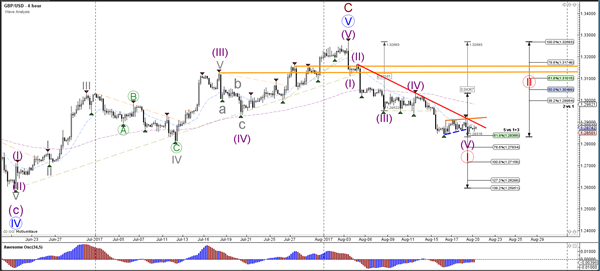
A GBP/USD bullish break above resistance (red/orange) could see the start of a wave 2 (red).