
DXY:
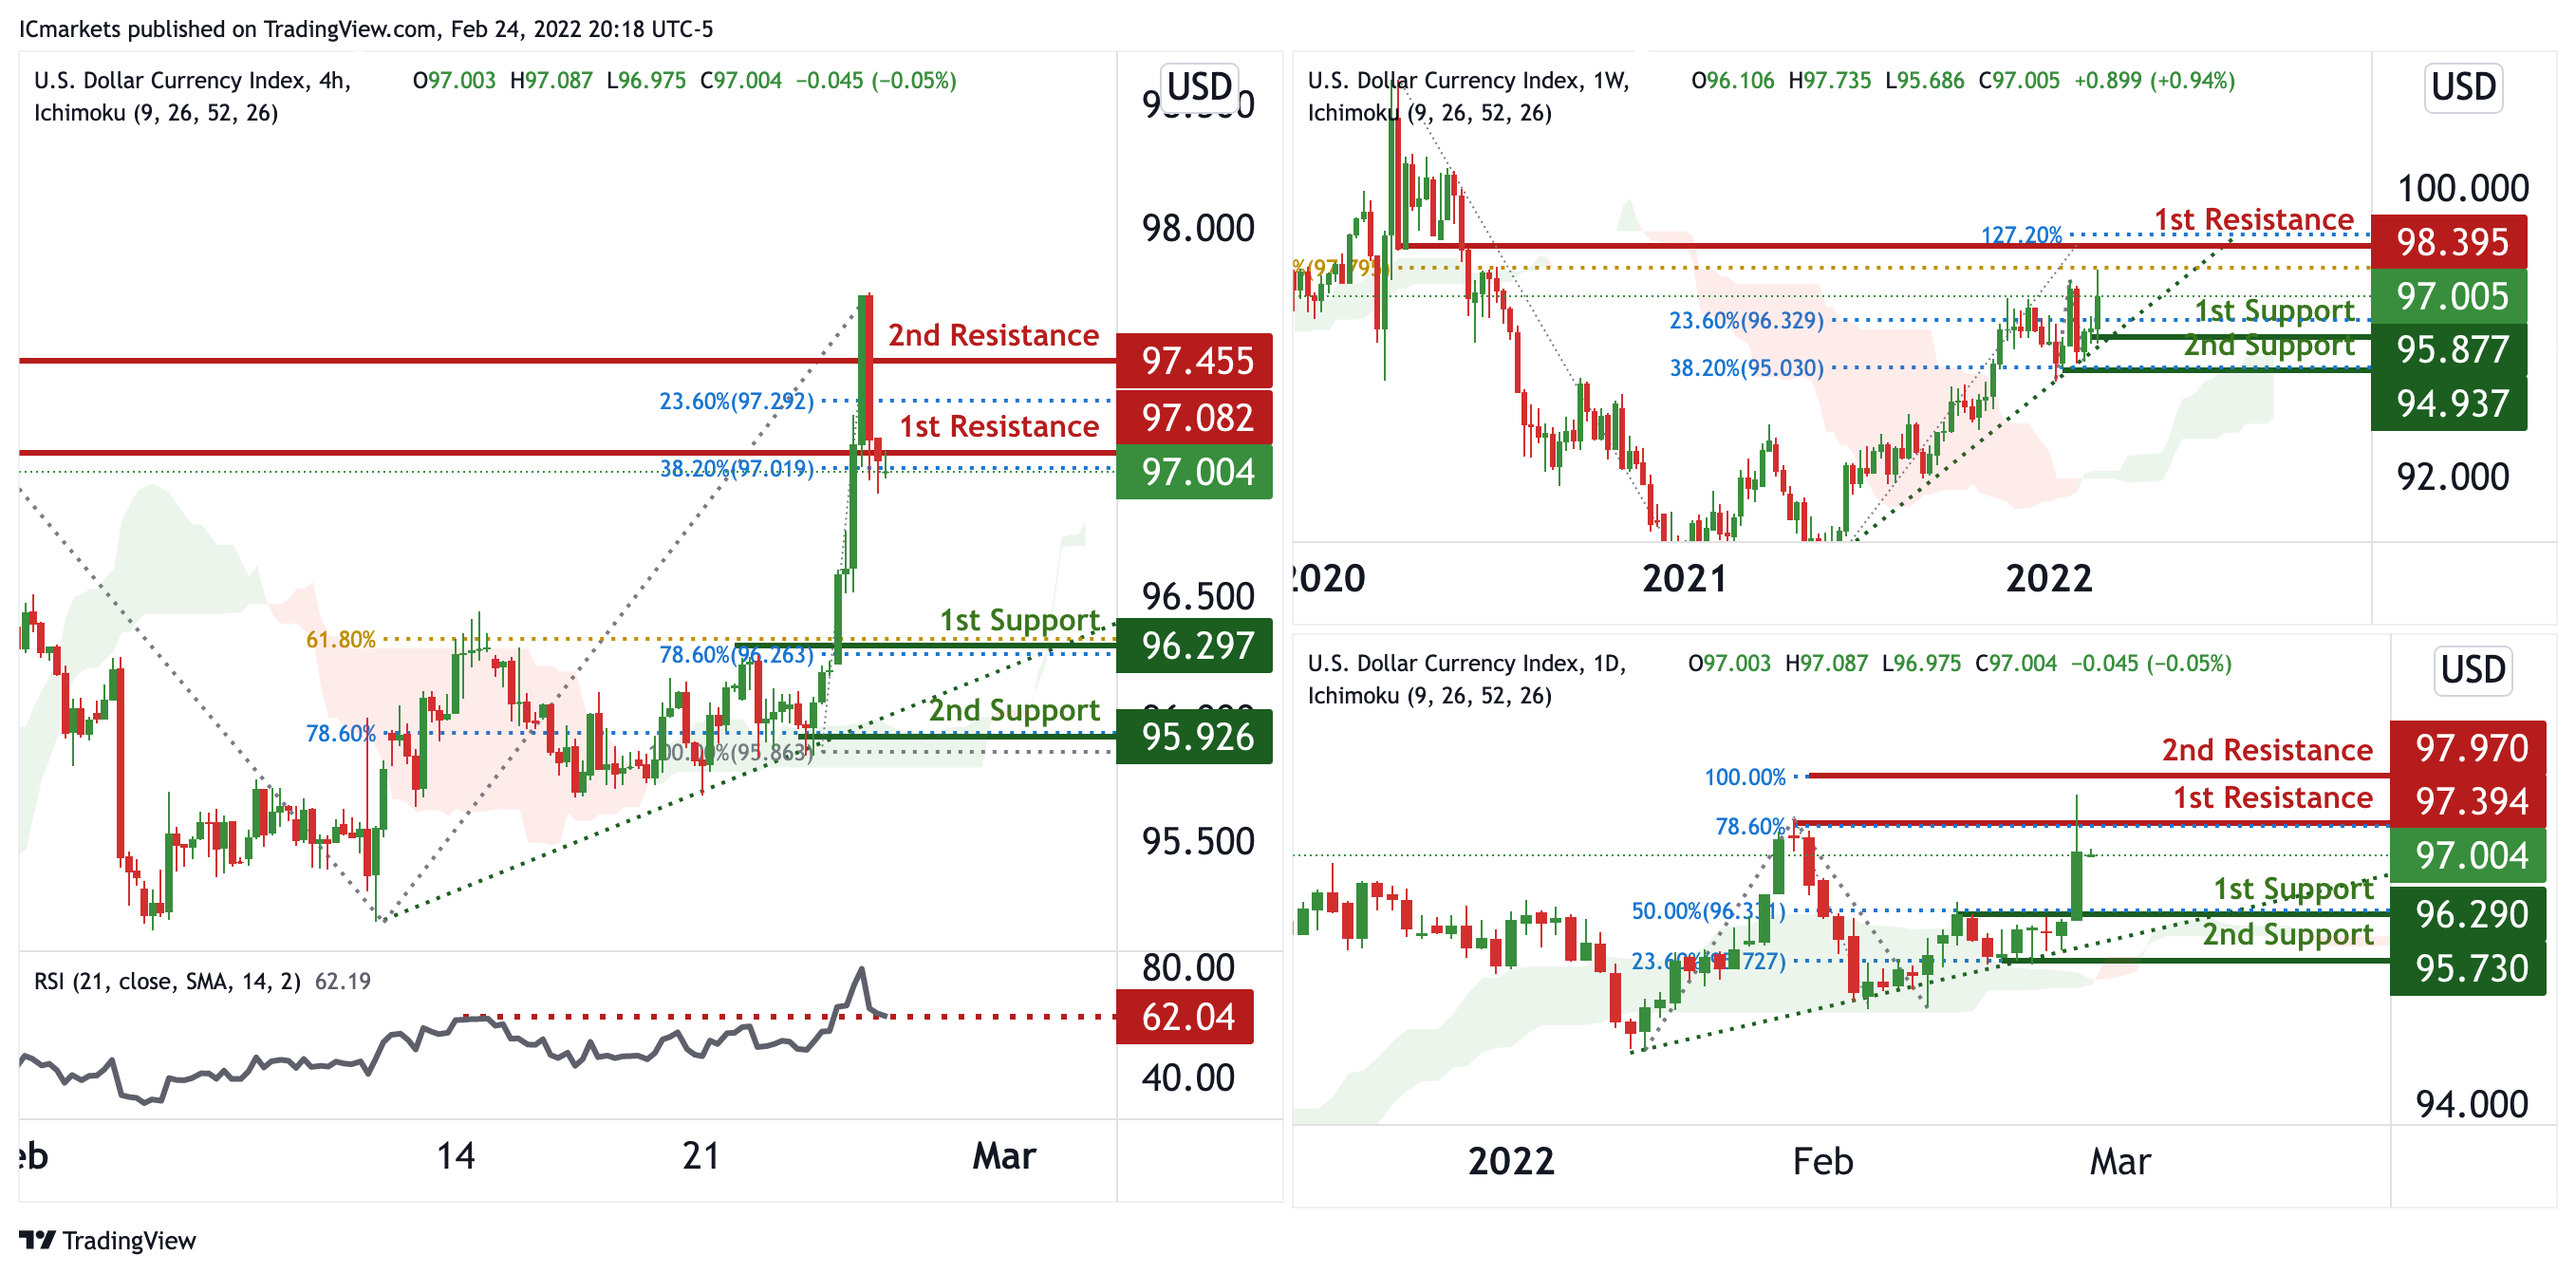
On the weekly, prices are on bullish momentum and abiding to our ascending trendline. We see potential for bullish momentum to climb from our 1st support at 95.877 in line with 23.6% Fibonacci retracement towards our 1st resistance at 98.395 in line with 127.2% Fibonacci extension and 61.8% Fibonacci retracement. Prices are trading above our ichimoku cloud support.
On the daily, prices are on a bullish momentum and abiding to a bullish trendline. We see potential for further bullish continuation from our 1st support at 96.290 in line with 50% Fibonacci retracement towards our 1st resistance at 97.394 in line with 78.6% Fibonacci extension. Prices are abiding to our ascending trendline support and also trading above our ichimoku clouds, further supporting our bullish bias.
On the H4 timeframe, prices are on bullish momentum and abiding to an daily ascending trendline. We see the potential for bearish dip from our 1st resistance at 97.082 in line with 38.2% Fibonacci retracement towards our 1st support at 96.297 in line with 78.6% Fibonacci retracement and 61.8% Fibonacci extension. RSI is at a level where dips occurred previously further supporting our bearish bias.
Areas of consideration:
- H4 time frame, 1st resistance at 97.082
- H4 time frame, 1st support at 96.297
XAU/USD (GOLD):
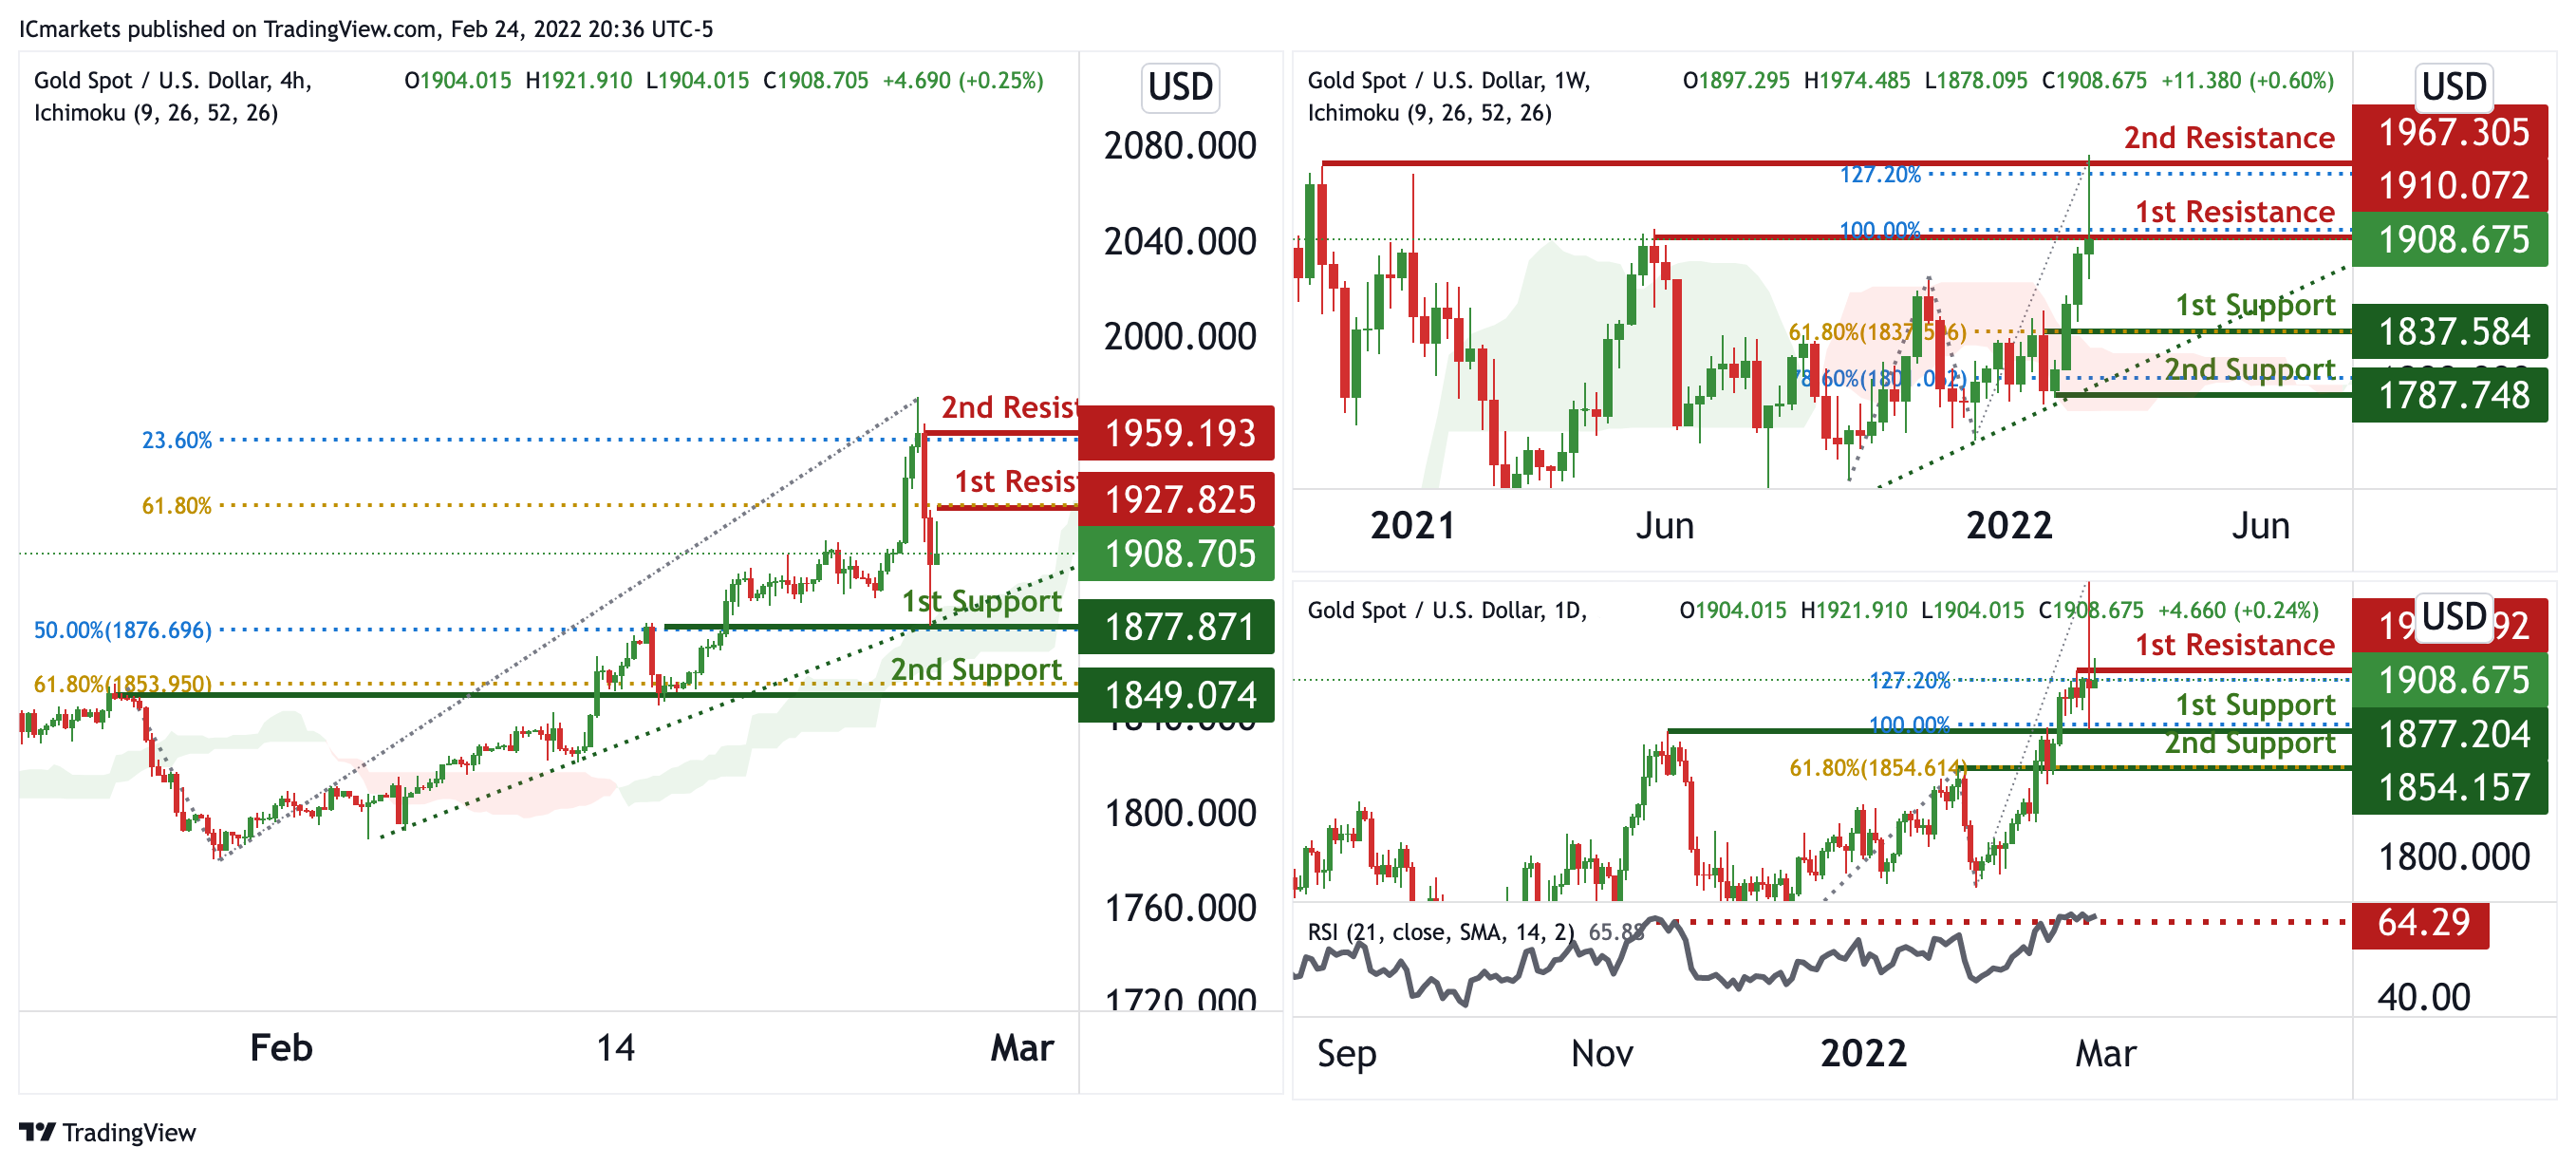
On the weekly, prices are on bullish momentum and abiding to our ascending trendline. We see the potential for prices to do a short pullback from our 1st resistance at 1908.675 in line with 100% Fibonacci extension towards our 1st support at 1837.584 in line with 61.8% Fibonacci retracement and ascending trendline support. Ichimoku are forecasting bearish clouds.
On the daily, prices are at a swing high. We see potential for a dip from our 1st resistance at 1914.2 in line with 127.2% Fibonacci extension towards our 1st support at 1877.204 in line with 100% Fibonacci extension. Our bias is further supported by RSI being at levels where dips previously occurred.
On the H4 chart, prices are abiding to our daily ascending trendline. We see potential for a bounce from our 1st support at 1877.871 in line with 78.6% Fibonacci extension towards our 1st resistance at 1927.825 in line with 61.8% Fibonacci retracement. Our bullish bias is further supported by ichimoku clouds showing bullish momentum.
Areas of consideration:
- 4h 1st support at 1877.871
- 4h 1st resistance at 1927.825
GBP/USD:
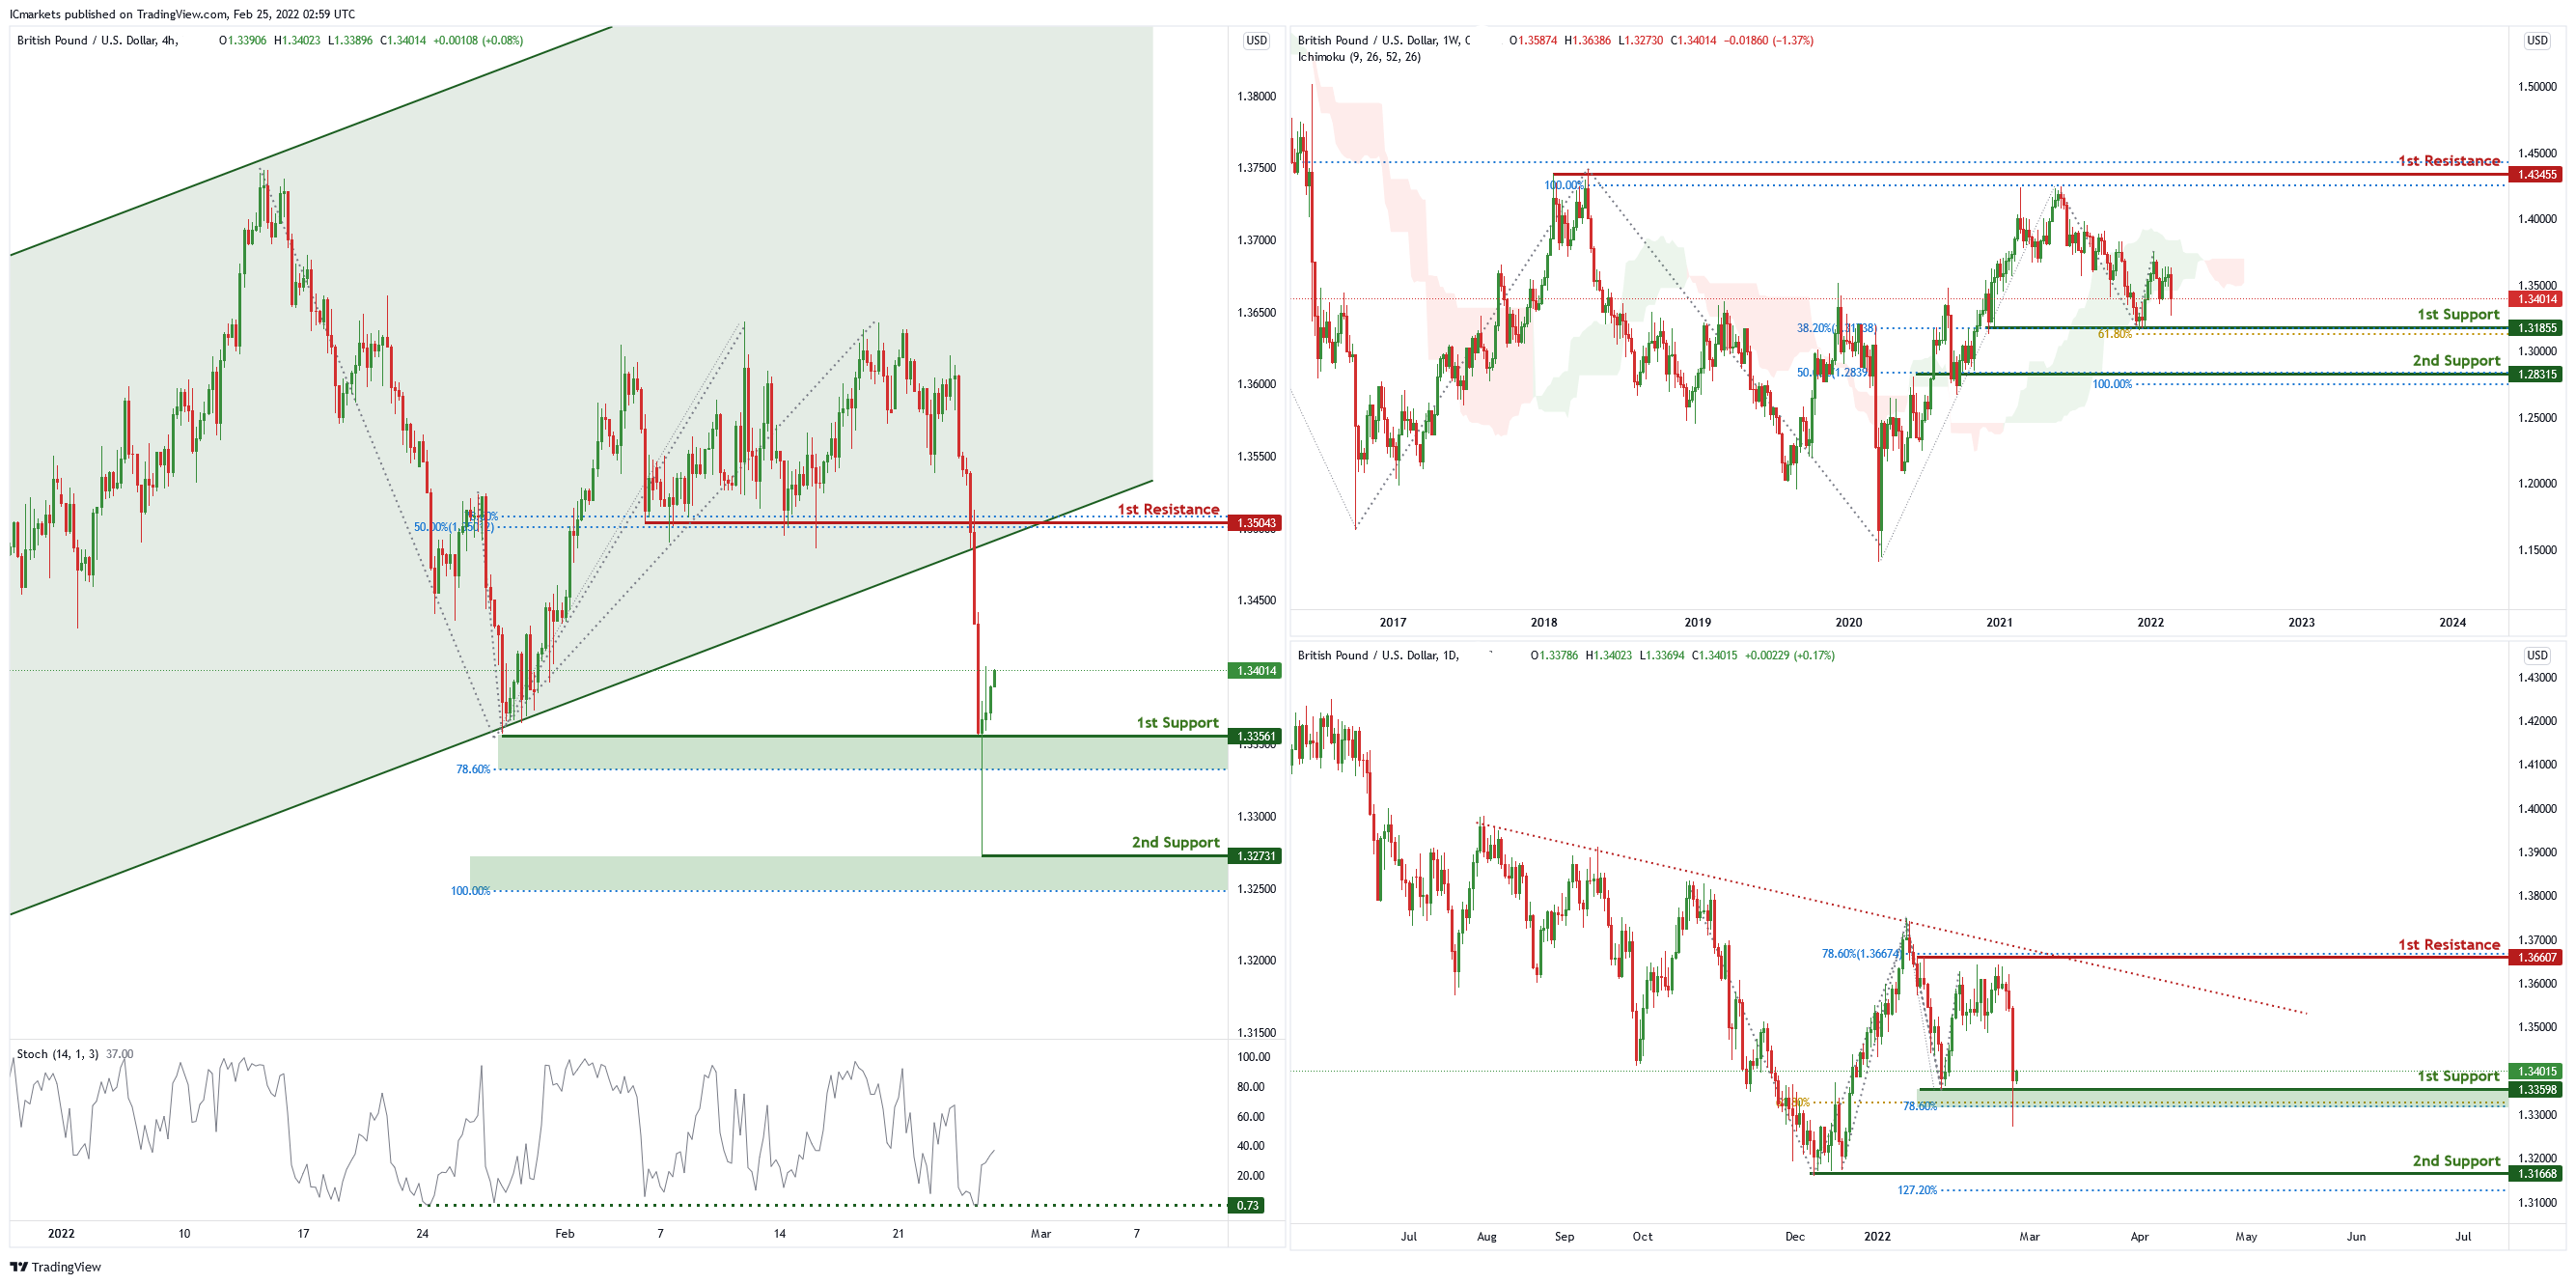
On the weekly chart , price has recently bounced off the 1st support level of 1.31885 which is also 38.2% Fibonacci retracement and 61.8% Fibonacci projection. Price can potentially go to the 1st resistance level of 1.42498 which is also 100% Fibonacci projection and 50% Fibonacci retracement. Our bullish bias is supported by the ichimoku cloud indicator.
On the daily chart , price is abiding by a descending trendline . Price can potentially bounce from the 1st support level of 1.33598 in line with 78.6% Fibonacci retracement and 61.8% Fibonacci projection to the 1st resistance level of 1.36607 in line with 78.6% Fibonacci retracement. Our bullish bias is supported by technical indicators
On the H4 chart , price has recently broken out of the ascending channel and is near 1st support level of 1.33561 in line with 78.6% Fibonacci projection. Price can potentially bounce from this level to 1st resistance level of 1.35043 in line with 50% Fibonacci retracement and 78.6% Fibonacci projection. Our bullish bias is supported by the stochastic indicator as it is at support level
Areas of consideration
- H4 1st resistance at 1.35043
- H4 1st support at 1.33561
USD/CHF:
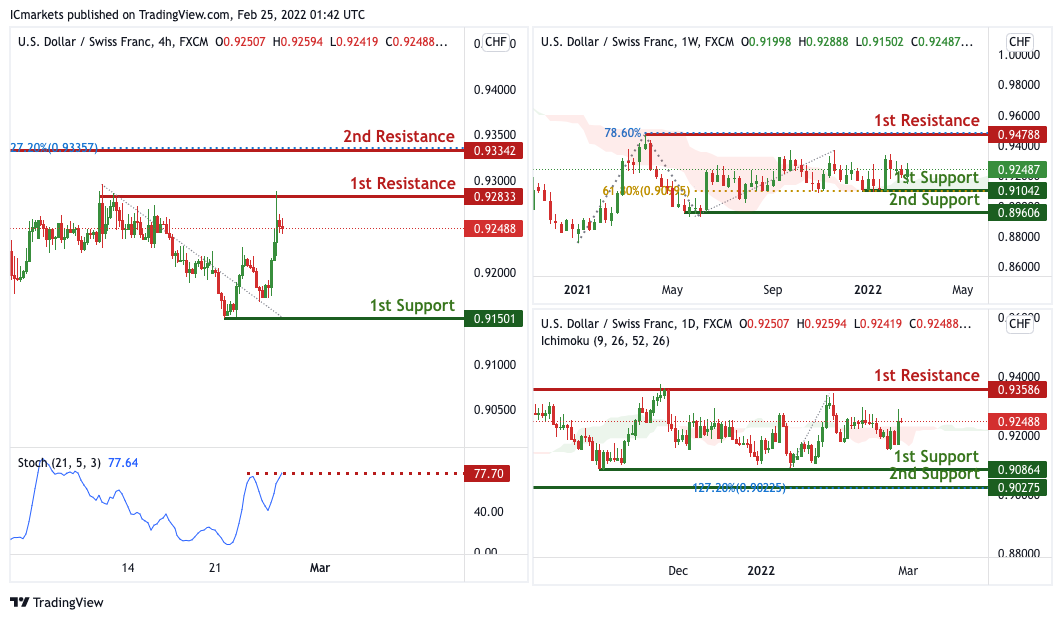
On the Weekly, with price moving above the ichimoku cloud, we can expect bullish continuation from our 1st support at 0.91042 in line with 61.8% Fibonacci retracement towards our 1st resistance at 0.94788 which is a strong resistance and in line with 78.6% Fibonacci projection. Alternatively, price may break 1st support structure and head for 2nd support, which coincides with horizontal swing low support at 0.89606.
On the Daily, with price moving above the ichimoku cloud, we can expect bullish continuation from our 1st support at 0.90864 in line with 38.2% Fibonacci retracement towards our 1st resistance at 0.93586 which is a strong resistance and in line with 127.2% Fibonacci extension. Alternatively, price may break 1st support structure and head for 2nd support, which coincides with horizontal swing low support at 0.90275.
On the H4 timeframe, prices are on bearish momentum and abiding to our descending trendline. We see the possibility of bearish continuation from our 1st resistance at 0.92833 in line with the horizontal swing high resistance towards our 1st support at 0.91501 in line with 100% Fibonacci projections. Our bearish bias is further supported by how price is expected to reverse off the stochastics.
Areas of consideration :
- H4 1st resistance at 0.92833
- H4 1st support at 0.91501
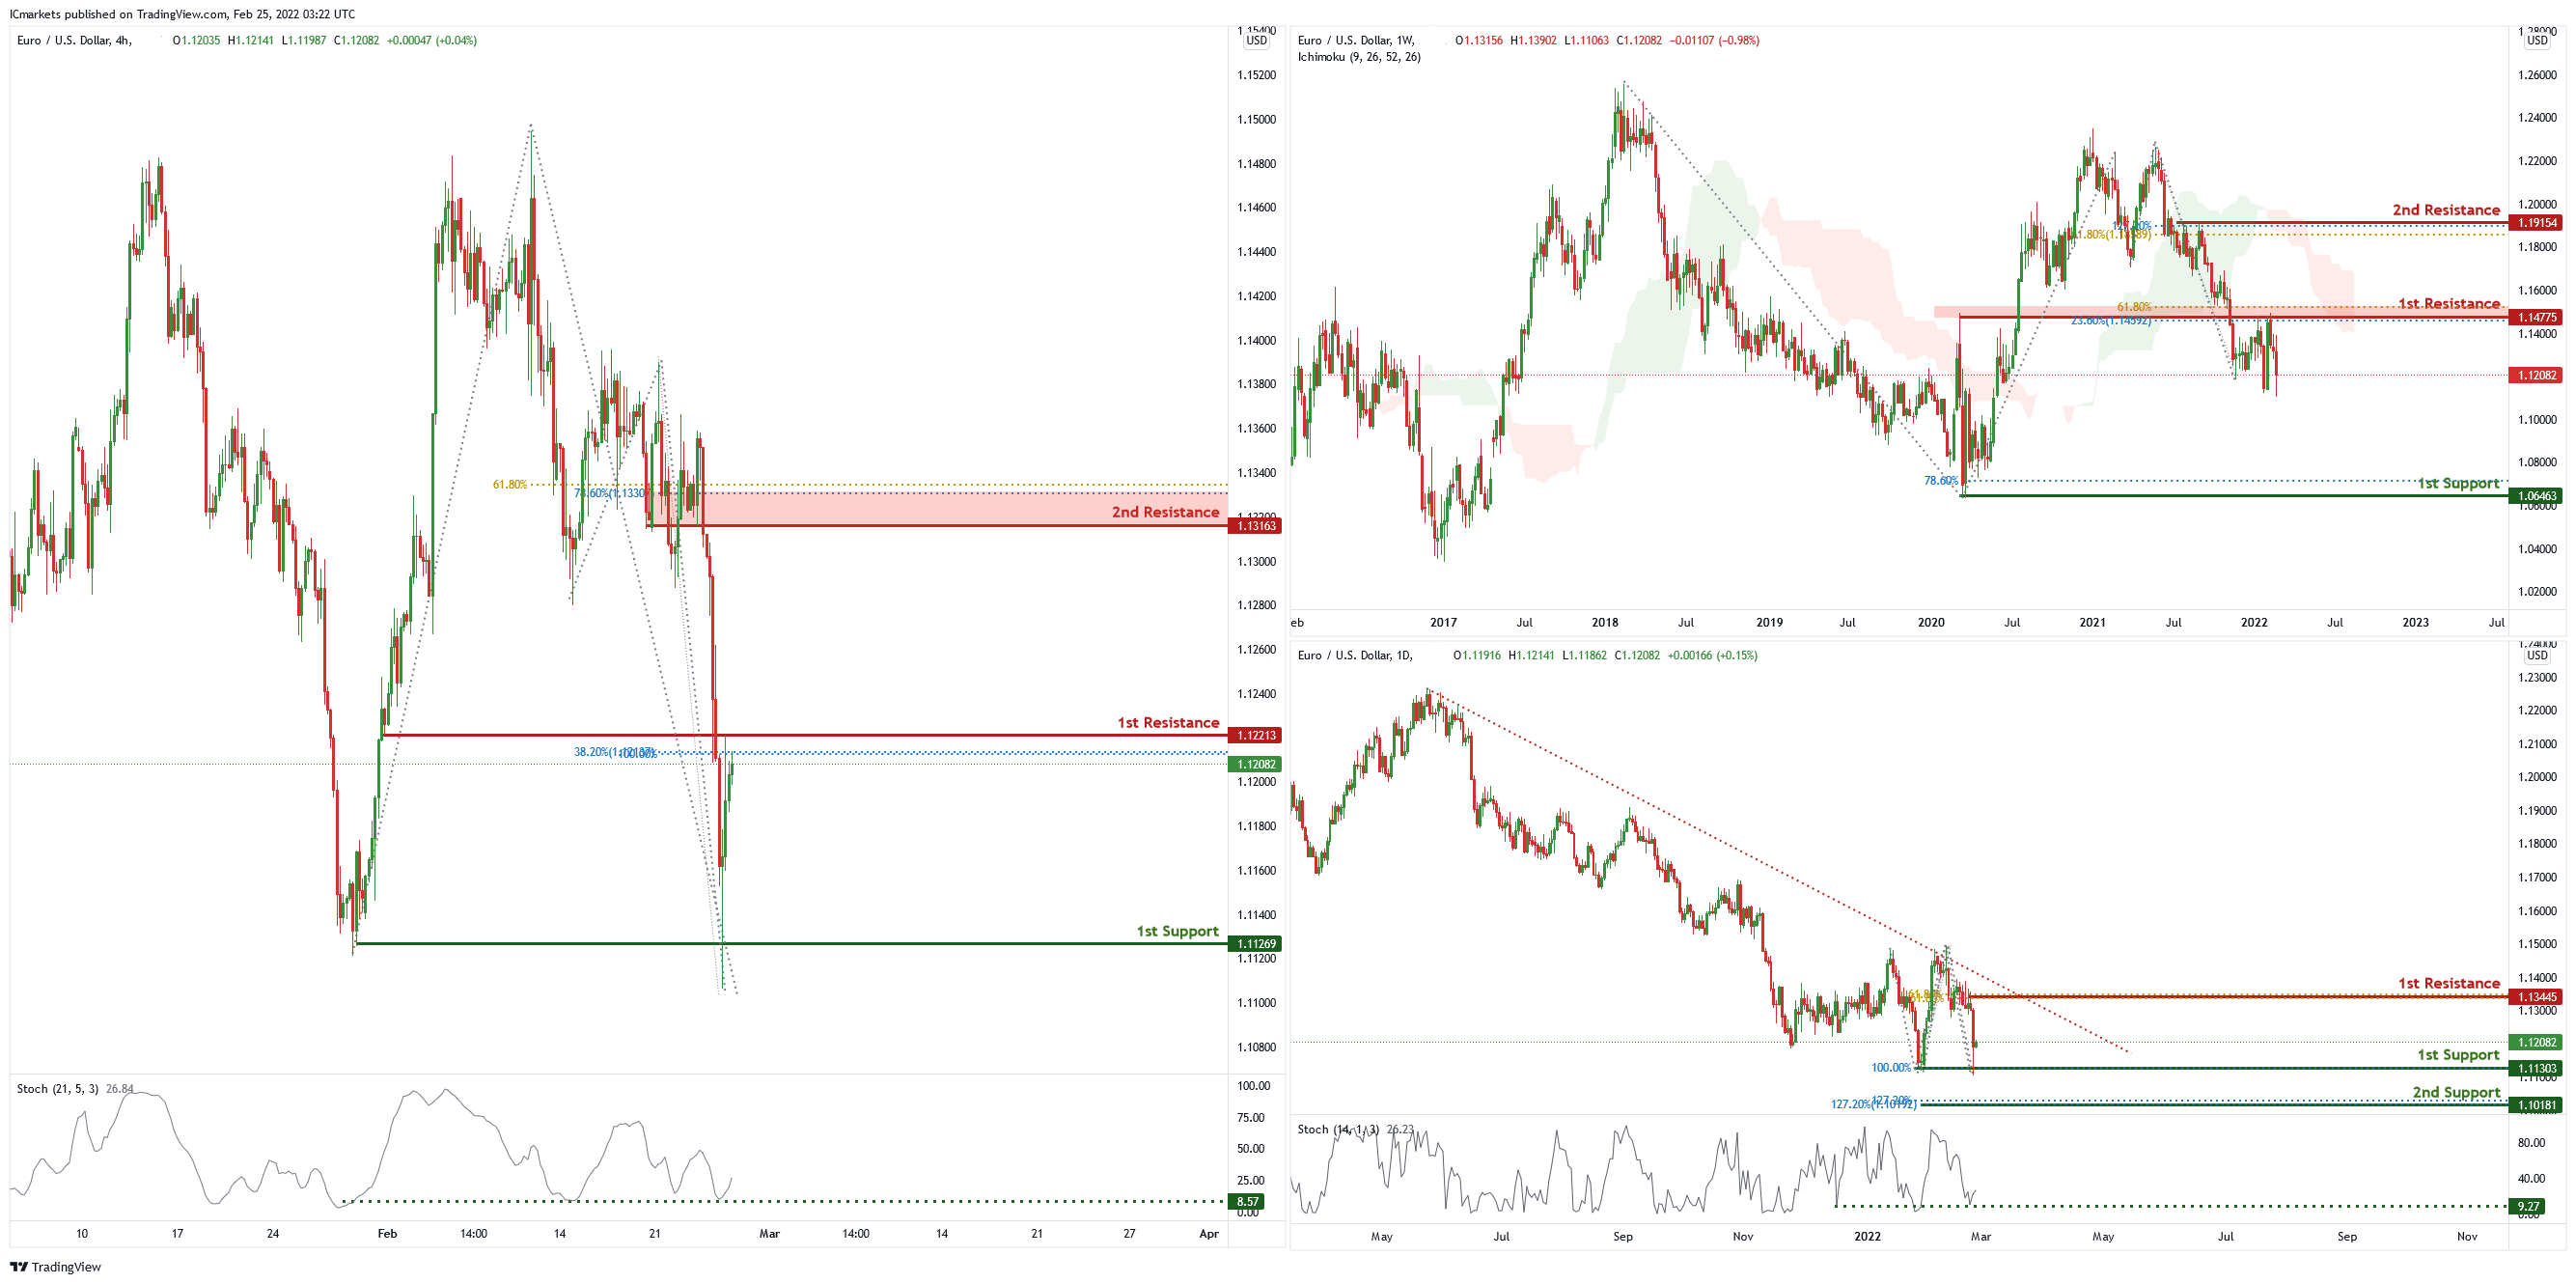
EUR/USD :
On the weekly chart, price is near 1st resistance level of 1.14226 which is also 61.8% Fibonacci projection and 23.6% Fibonacci retracement. Price can potentially dip to the 1st support level of 1.06475 which is 78.6% Fibonacci projection. Our bearish bias is supported by the ichimoku cloud indicator as price is trading below it.
On the daily chart, price is abiding by the descending trendline and is near 1st support level of 1.11303 in line with 100% Fibonacci projection and graphical swing low. Price can potentially bounce to the 1st resistance level of 1.13445 in line with 61.8% Fibonacci retracement and 61.8% Fibonacci projection. Our bullish bias is supported by the stochastic indicator as it is at support level.
On the H4 chart, price is near 1st resistance level of 1.12213 in line with 38.2% Fibonacci retracement and 100% Fibonacci projection. Price can potentially go to the 2nd resistance level of 1.13163 in line with 61.8% Fibonacci projection and 78.6% Fibonacci retracement. Our bullish bias is supported by the stochastic indicator as it is near support level
- H4 1st resistance at 1.12213
- H4 2nd resistance at 1.13163
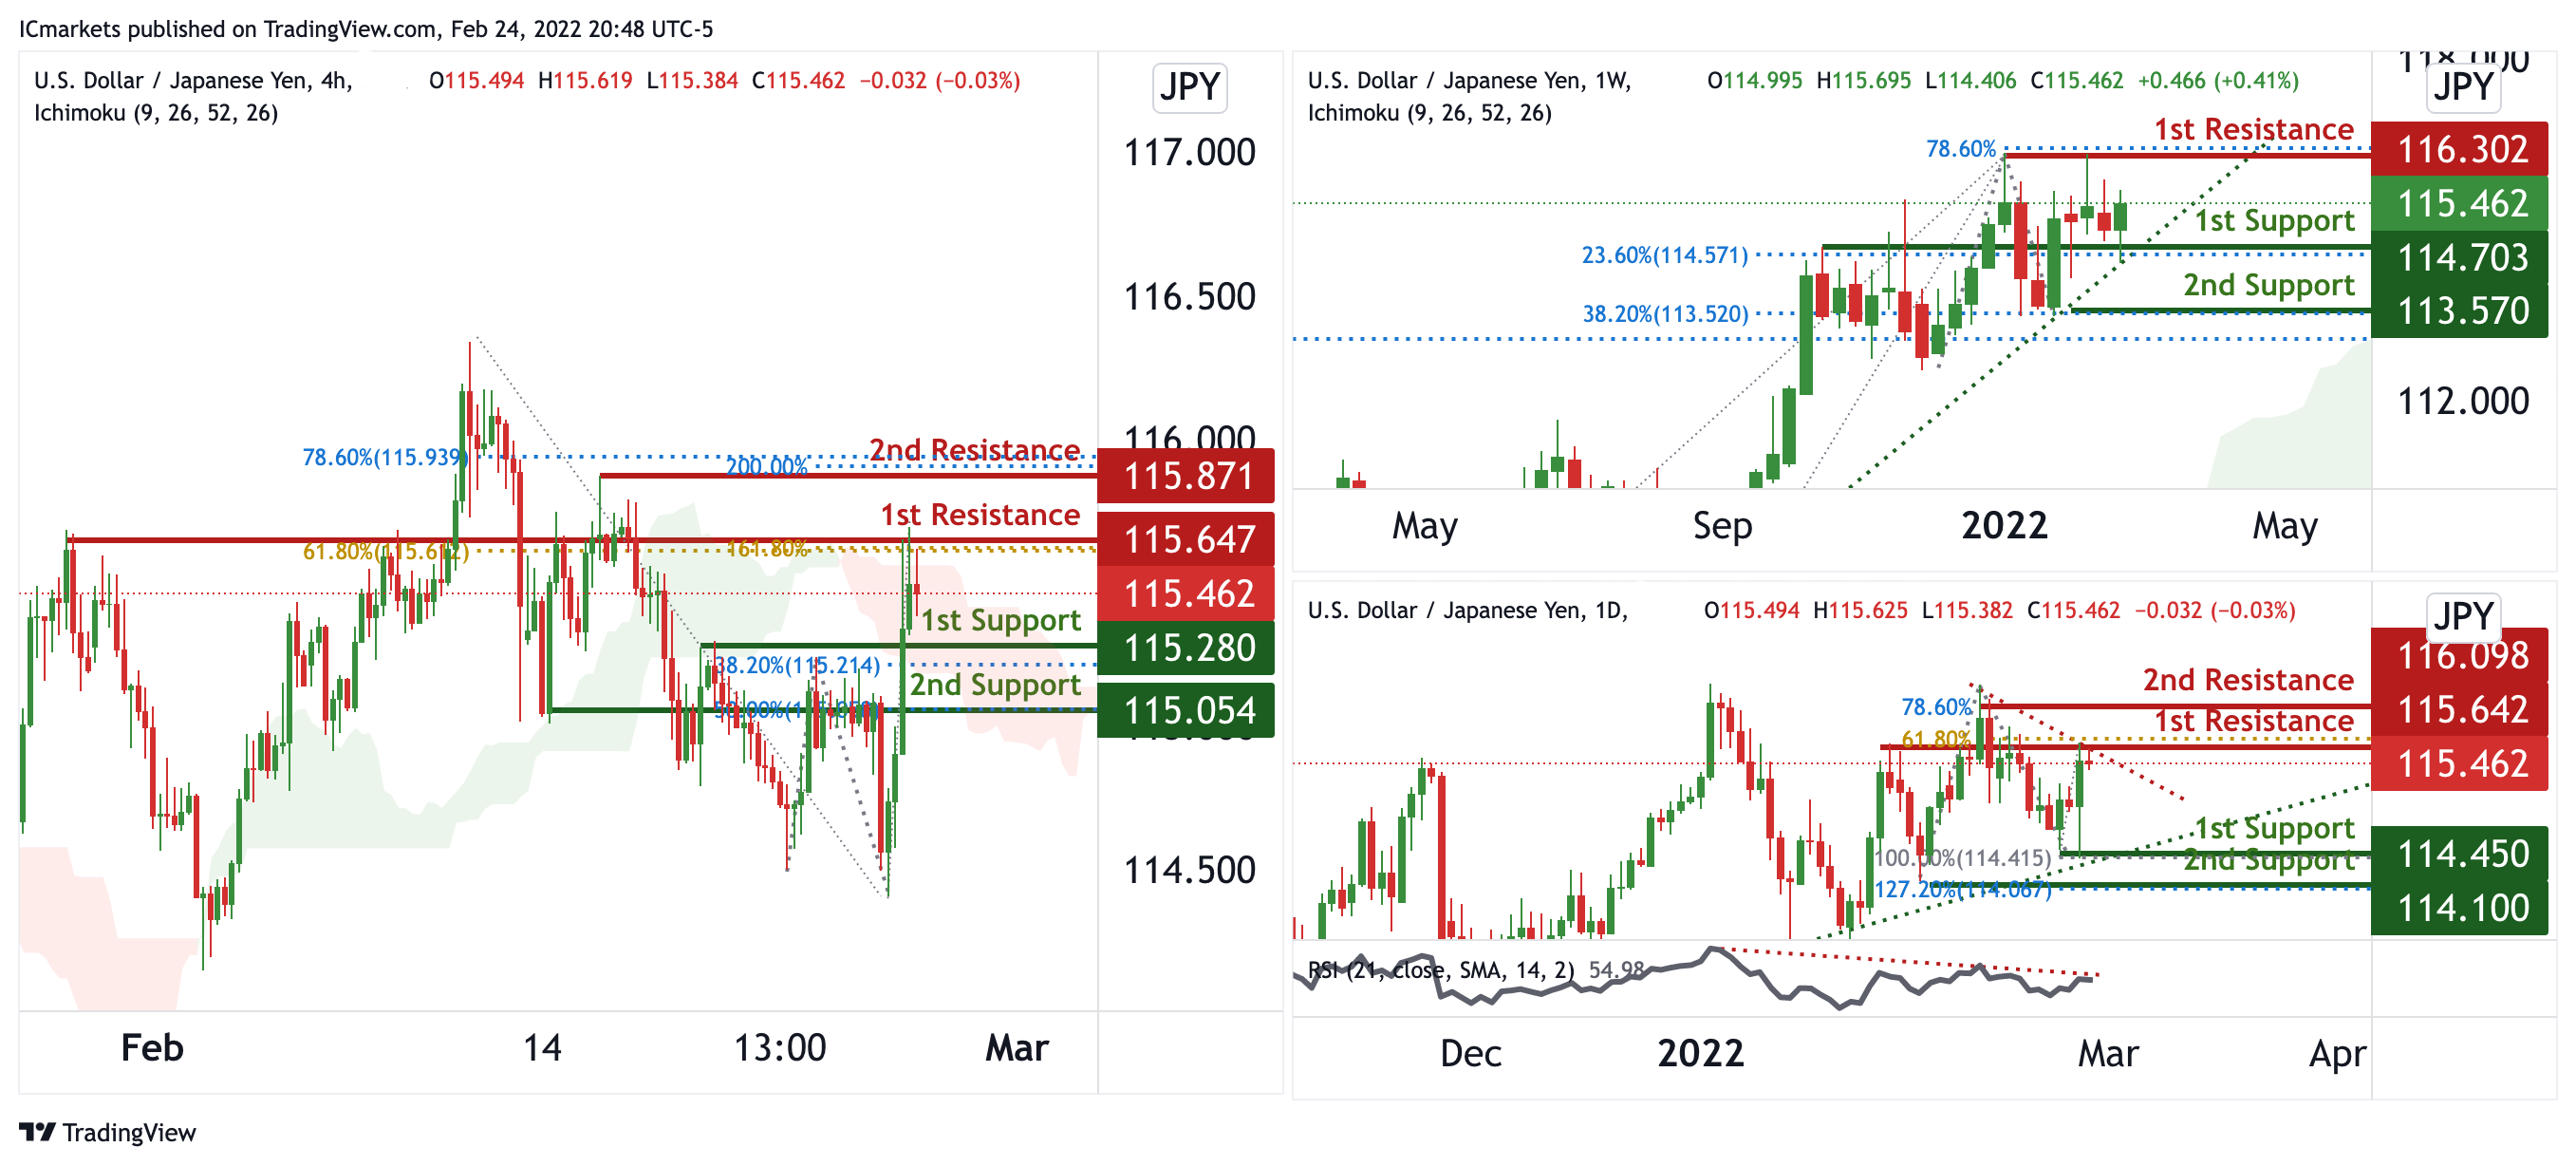
USD/JPY
On the weekly, prices are on bullish momentum and abiding to our ascending trendline. We see potential for bullish momentum to climb from our 1st support at 114.703 in line with 23.6% Fibonacci retracement towards our 1st resistance at 116.302 in line with 78.6% Fibonacci extension. Prices are trading above our ichimoku cloud support.
On the daily, prices are consolidating in a triangle. We see potential for a dip from our 1st resistance at 115.642 in line with 61.8% Fibonacci retracement towards our 1st support at 114.450 in line with 100% Fibonacci retracement. RSI is depicting bearish momentum and ichimoku is showing red clouds, further supporting our bearish bias.
On the H4 timeframe, prices are at a strong resistance and pivot. We see the potential for bearish dip from our 1st resistance at 115.647 in line with 61.8% Fibonacci retracement and 161.8% Fibonacci projection towards our 1st support at 115.280 in line with 38.2% Fibonacci retracement and 61.8% Fibonacci extension. Ichimoku is forecasting bearish momentum.
Areas of consideration:
- H4 time frame, 1st resistance at 115.647
- H4 time frame, 1st support at 115.280
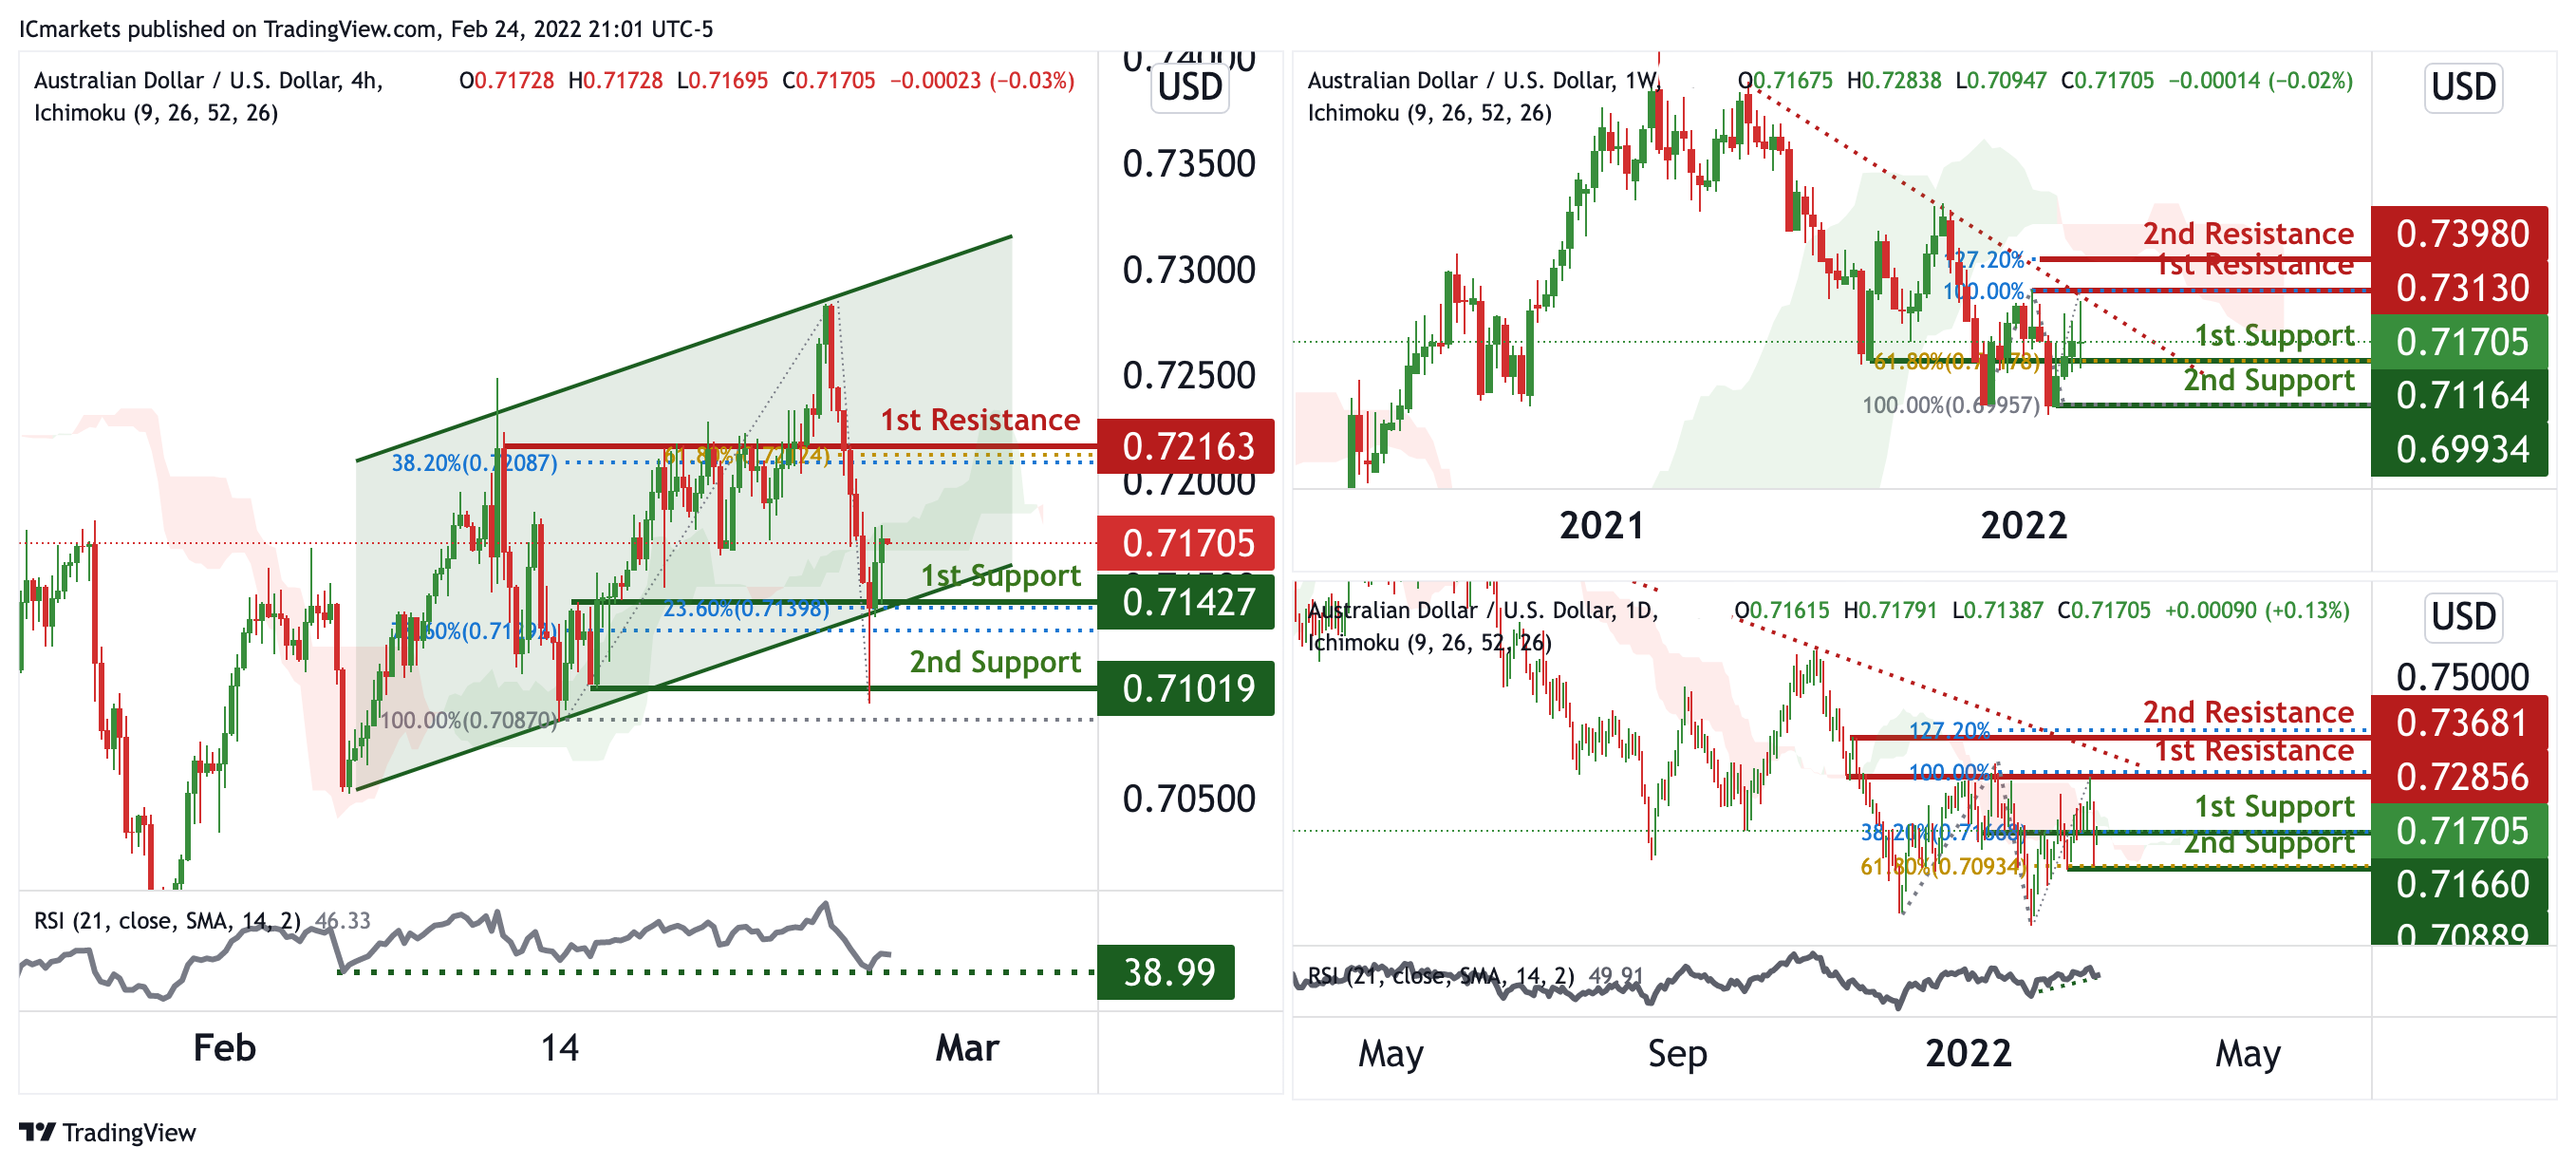
AUD/USD:
On the weekly, prices are on bearish momentum and abiding to our descending trendline. We see the potential for prices to do a short pullback from our 1st resistance at 0.7313 in line with 100% Fibonacci extension towards our 1st support at 0.71164 in line with 61.8% Fibonacci retracement. Ichimoku are forecasting bearish clouds, supporting our bearish bias.
On the daily, prices are bearish momentum and abiding to our descending trendline, and also at a swing high. We see potential for a bounce from our 1st support at 0.71705 in line with 38.2% Fibonacci retracement towards our 1st resistance at 0.72856 in line with 100% Fibonacci extension. Our bias is further supported by RSI being on bullish momentum.
On the H4 chart, prices are abiding to our bullish channel. We see potential for a bounce from our 1st support at 0.74127 in line with 23.6% Fibonacci retracement and 78.6% Fibonacci extension towards our 1st resistance at 0.72163 in line with 61.8% Fibonacci extension and 38.2% FIbonacci retracement. Our bullish bias is further supported by ichimoku clouds showing bullish momentum and RSI being at levels where bounces previously occurred.
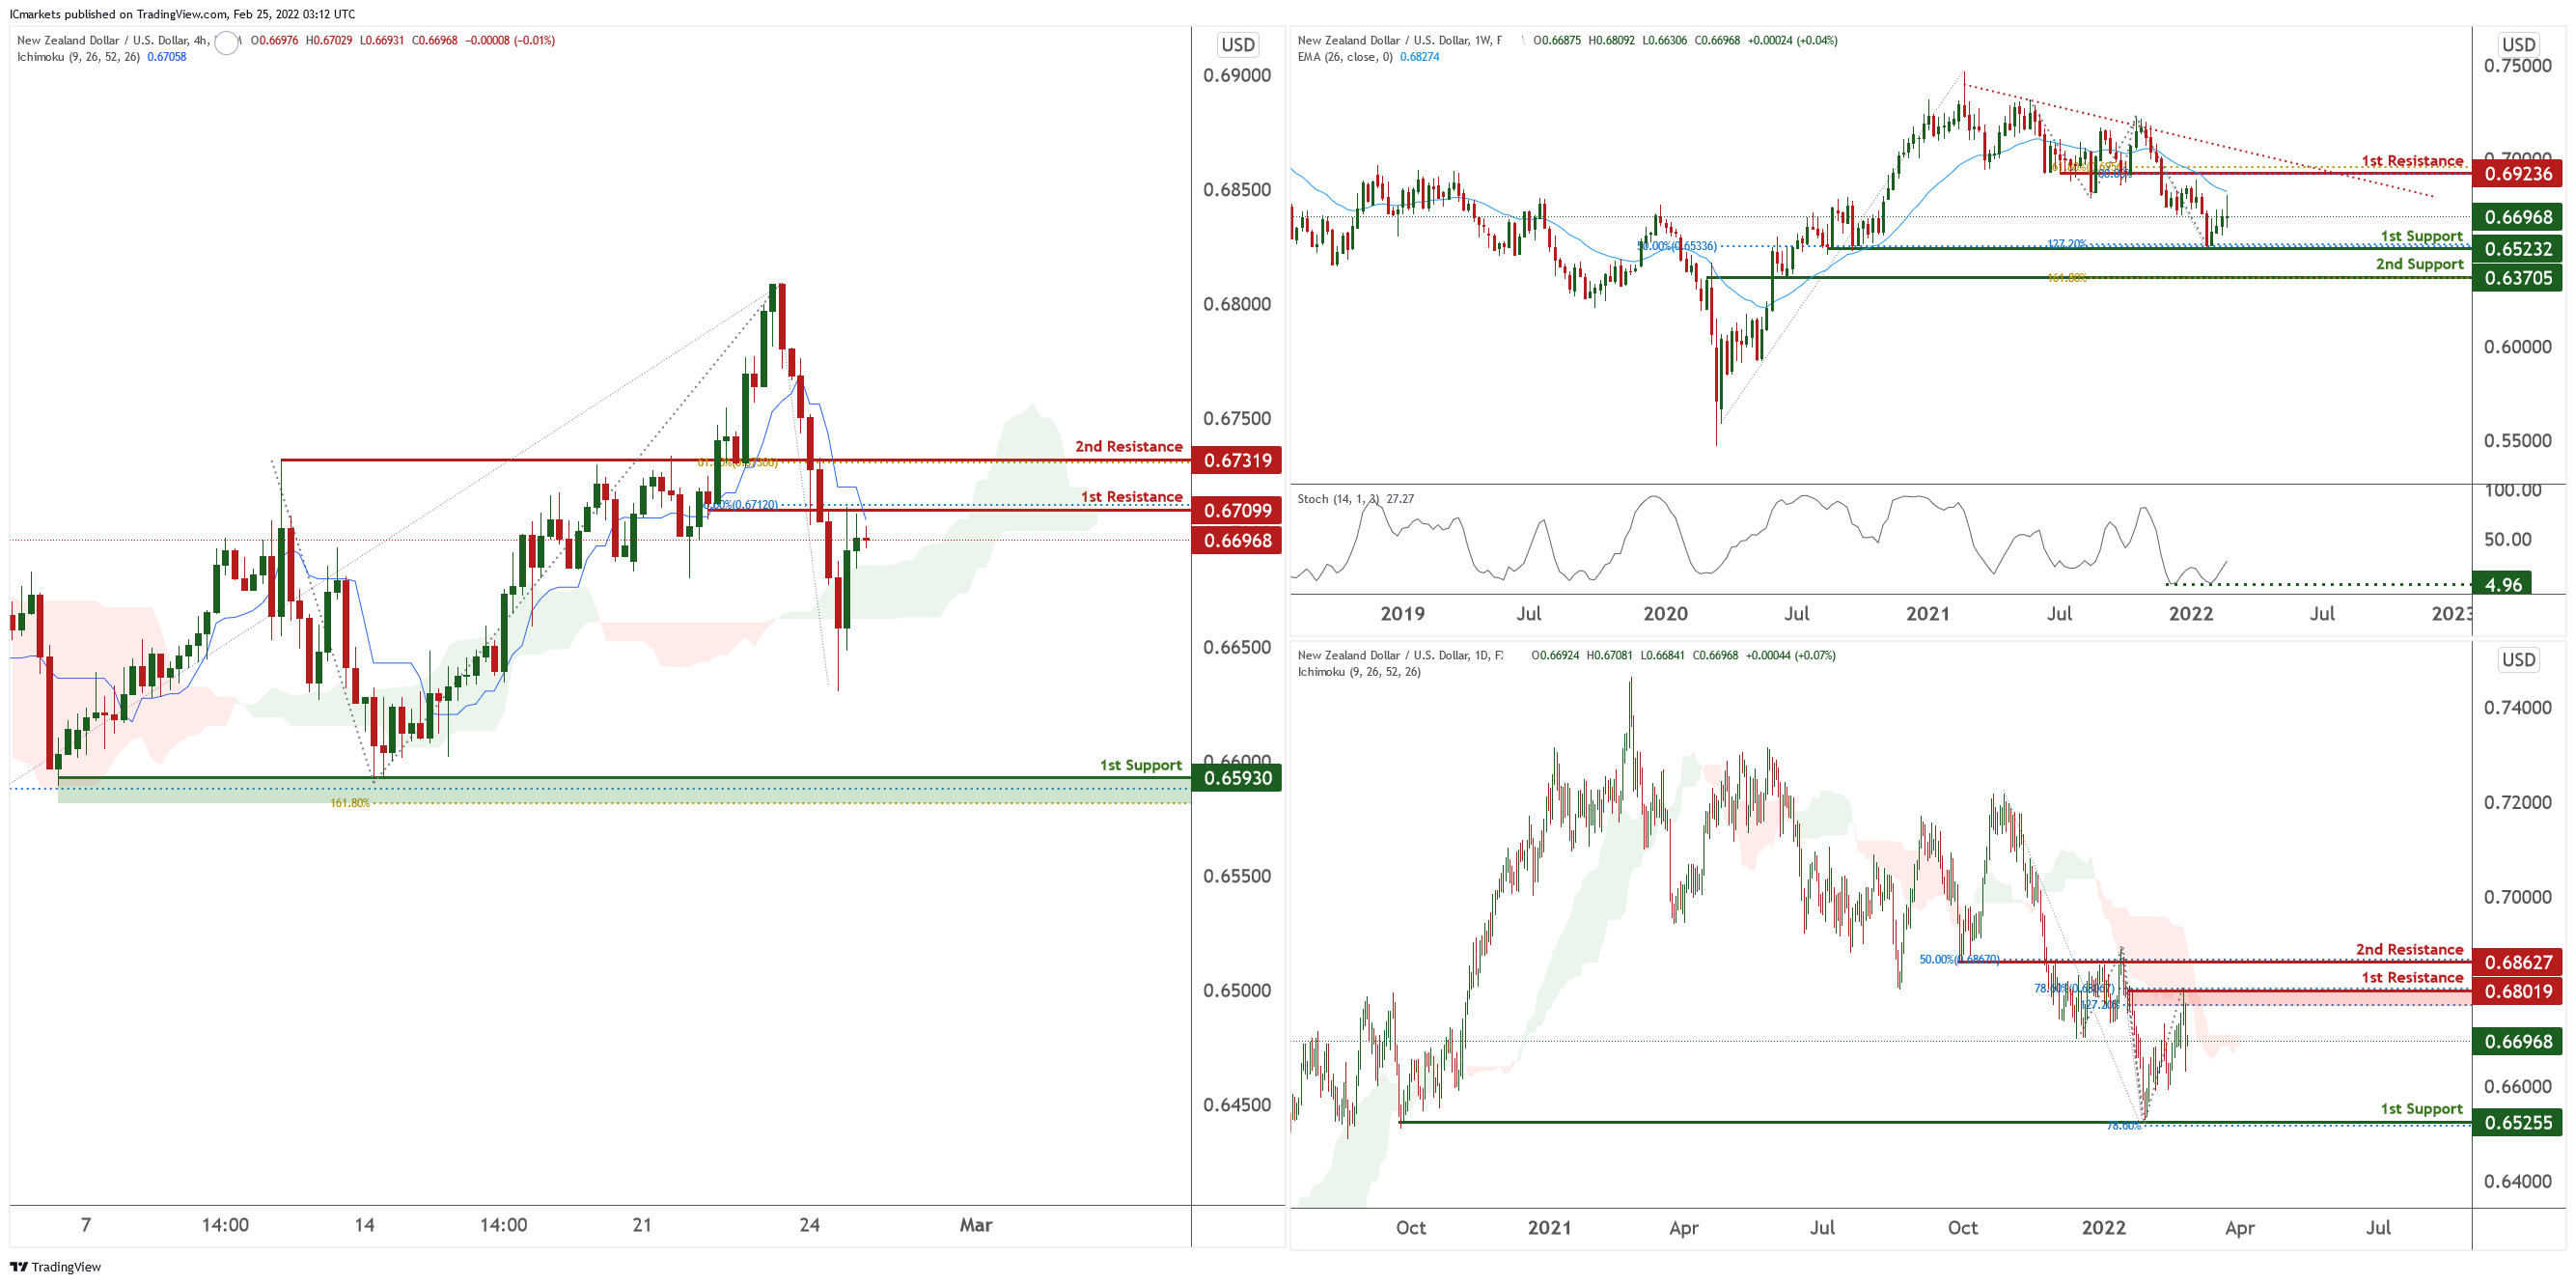
NZD/USD:
On the weekly time frame price is abiding by a descending trendline and near 1st support level of 0.65232 in line with 50% Fibonacci retracement and 127.2% Fibonacci projection. Price can go to the 1st resistance level of 0.69236 in line with 100% Fibonacci projection and 61.8% Fibonacci retracement. Our bullish bias is supported by stochastic indicator as it is near support level
On the daily chart, price is near 1st resistance level of 0.68019 in line with 78.6% Fibonacci retracement and 127.2% Fibonacci projection. Price can potentially dip to the 1st support level of 0.65255 in line with 78.6% Fibonacci projection. Our bearish bias is supported by the ichimoku cloud indicator as the price is trading below it.
On the daily chart price is near 1st resistance level of 0.67099 in line with 50% Fibonacci retracement. Price can potentially dip to the 1st support level of 0.65930 in line with 78.6% Fibonacci retracement and 161.8% Fibonacci projection. Our bearish bias is supported by technical indicators.
Areas of consideration:
- H4 time frame, 1st resistance at 0.67099
- H4 time frame, 1st support at 0.65930
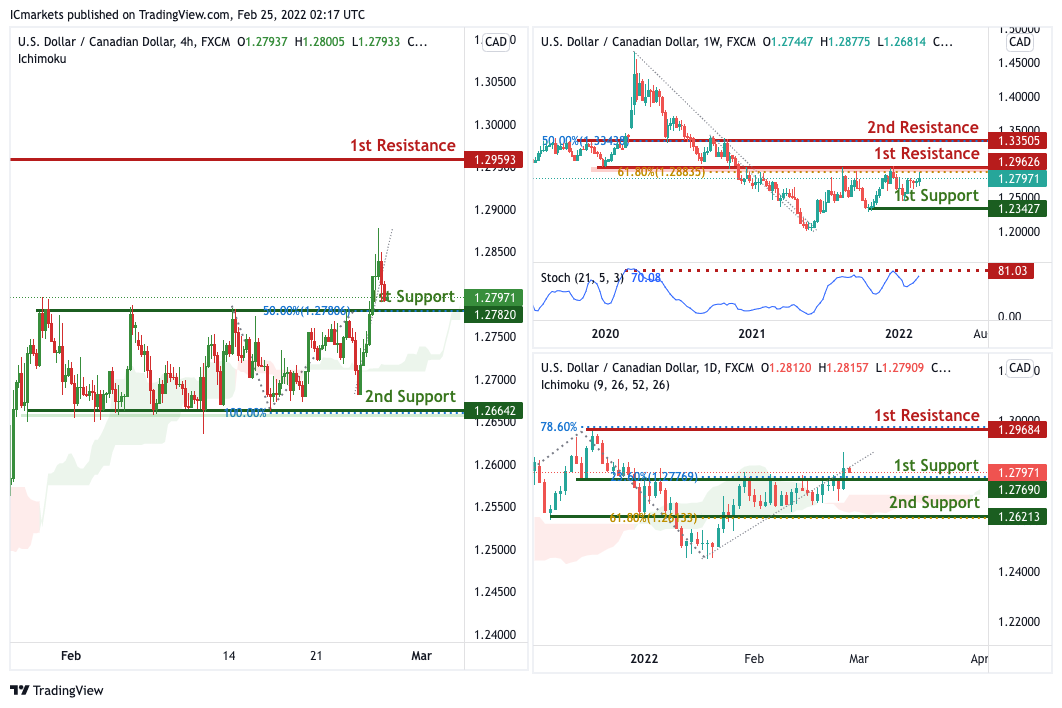
USD/CAD:
On the Weekly, We see the possibility of bearish continuation from our 1st resistance at 1.29626 in line with horizontal swing high resistance towards our 1st support at 1.23427 in line with the 100% Fibonacci extension level. Our bearish bias is further supported by prices reversing off the stochastic indicator. On the Daily, with price moving above the ichimoku cloud, we can expect bullish continuation from our 1st support at 1.27690 in line with 38.2% Fibonacci retracement towards our 1st resistance at 1.29684 which is a strong resistance and in line with 127.2% Fibonacci extension. Alternatively, price may break 1st support structure and head for 2nd support, which coincides with the ascending trendline and 38.2% Fibonacci retracement at 1.26213.
On the H4, with price moving above the ichimoku cloud, we can expect bullish continuation from our 1st support at 1.27971 in line with 38.2% Fibonacci retracement towards our 1st resistance at 1.29593 which is a strong resistance and in line with 127.2% Fibonacci extension. Alternatively, price may break 1st support structure and head for 2nd support, which coincides with the ascending trendline and 38.2% Fibonacci retracement at 1.26642.
Areas of consideration:
- H4 time frame, 1st support at 1.26642
- H4 time frame, 1st resistance at 1.27971
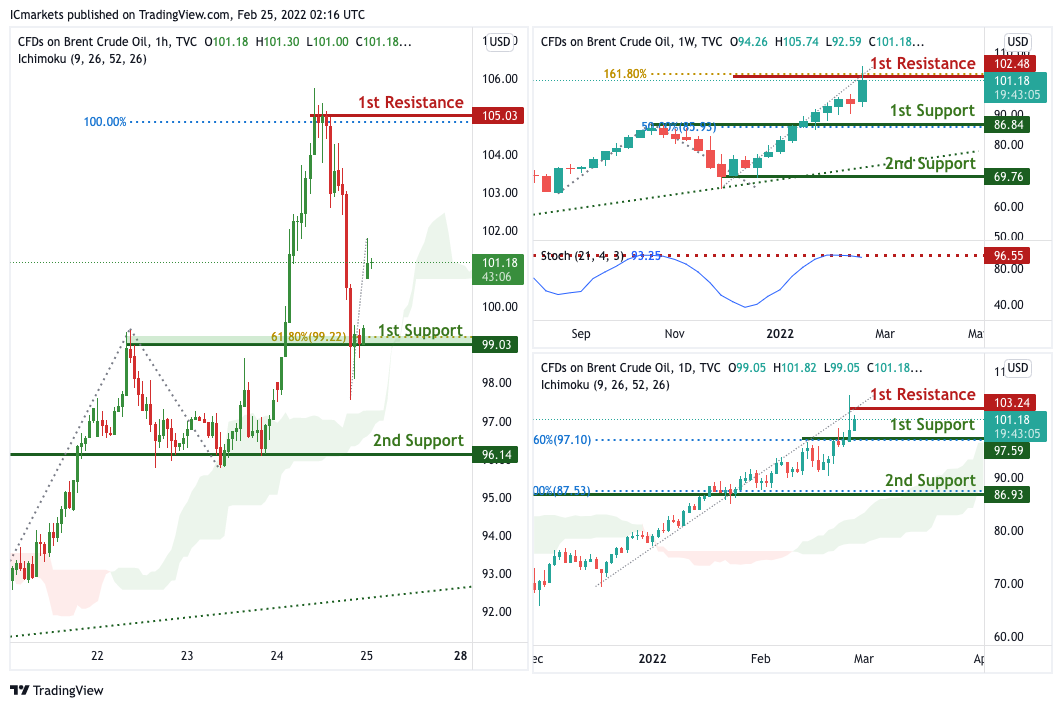
OIL:
On the Weekly, with price moving above the ichimoku cloud, we can expect bullish continuation from our 1st support at 86.84 in line with 38.2% Fibonacci retracement towards our 1st resistance at 101.18 which is a strong resistance and in line with 127.2% Fibonacci extension. Alternatively, price may break 1st support structure and head for 2nd support, which coincides with the ascending trendline and 38.2% Fibonacci retracement at 67.76.
On the Daily, with price moving above the ichimoku cloud, we can expect bullish continuation from our 1st support at 97.59 in line with 38.2% Fibonacci retracement towards our 1st resistance at 103.24 which is a strong resistance and in line with 127.2% Fibonacci extension. Alternatively, price may break 1st support structure and head for 2nd support, which coincides with the ascending trendline and 38.2% Fibonacci retracement at 86.93.
On the H4, with price moving above the ichimoku cloud, we can expect bullish continuation from our 1st support at 99.03 in line with 38.2% Fibonacci retracement towards our 1st resistance at 105.03 which is a strong resistance and in line with 127.2% Fibonacci extension. Alternatively, price may break 1st support structure and head for 2nd support, which coincides with the ascending trendline and 38.2% Fibonacci retracement at 96.14.
Areas of consideration:
- H4 time frame, 1st resistance of 105.03
- H4 time frame, 1st support of 99.03
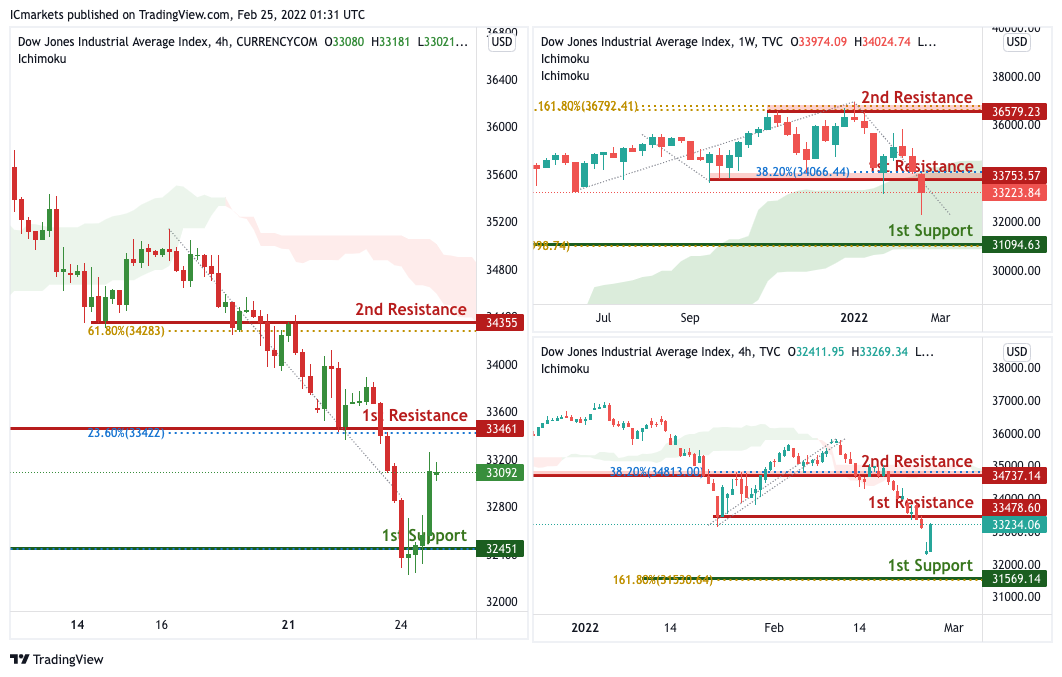
Dow Jones Industrial Average:
On the Weekly timeframe, We see the possibility of bearish continuation from our 1st resistance at 33753 in line with horizontal overlap resistance towards our 1st support at 31094 in line with the horizontal swing low support. Alternatively, price may break 1st resistance and head for 2nd resistance at 36579 in line with the 50% Fibonacci retracement level. Our bearish bias is further supported by how price is moving below the ichimoku cloud
On the Daily timeframe, We see the possibility of bearish continuation from our 1st resistance at 33478 in line with horizontal overlap resistance towards our 1st support at 31569 in line with the horizontal swing low support. Alternatively, price may break 1st resistance and head for 2nd resistance at 34737 in line with the 50% Fibonacci retracement level. Our bearish bias is further supported by how price is moving below the ichimoku cloud
On the H4 timeframe, We see the possibility of bearish continuation from our 1st resistance at 33461 in line with horizontal overlap resistance towards our 1st support at 32451 in line with the horizontal swing low support. Alternatively, price may break 1st resistance and head for 2nd resistance at 34355 in line with the 50% Fibonacci retracement level. Our bearish bias is further supported by how price is moving below the ichimoku cloud
Areas of consideration :
- H4 1st support at 34451
- H4 1st resistance at 33461


