
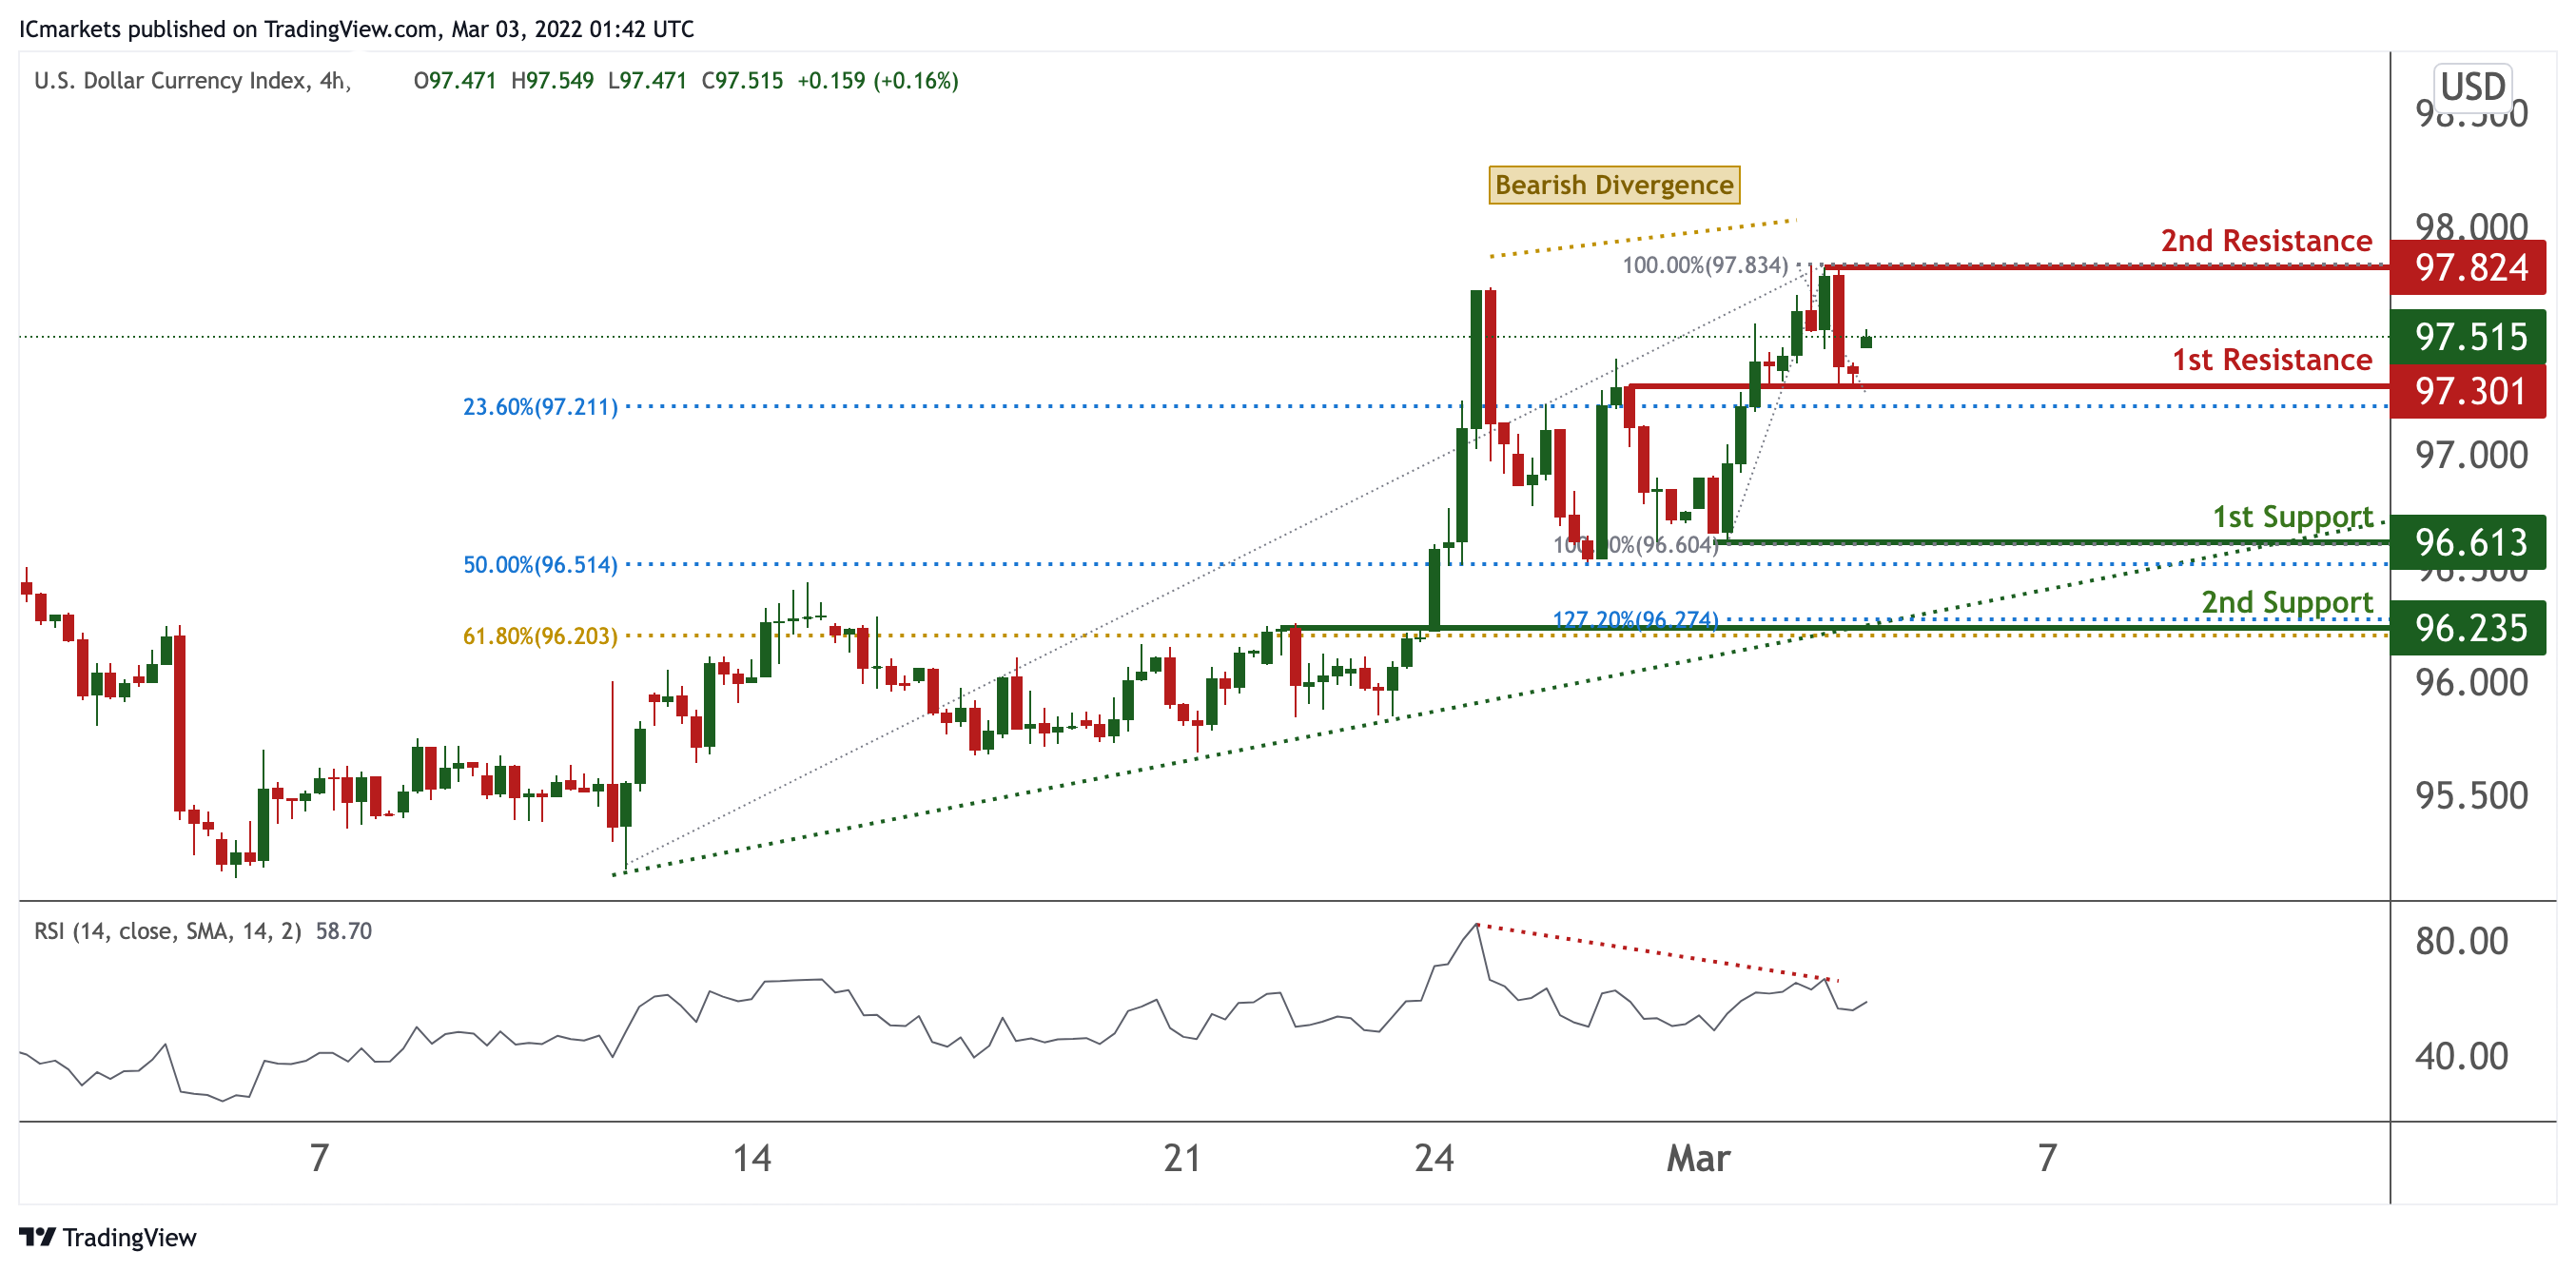
DXY:
On the H4 timeframe, prices are at pivot and in line with a recent swing high. We see the potential for a dip from our 1st resistance at 97.301 in line with 23.6% Fibonacci retracement towards our 1st support at 96.613 in line with 50% Fibonacci retracement and 100% Fibonacci retracement. Bearish divergence is spotted on RSI, further supporting our bearish bias.
Areas of consideration:
- H4 time frame, 1st resistance at 97.301
- H4 time frame, 1st support at 96.613
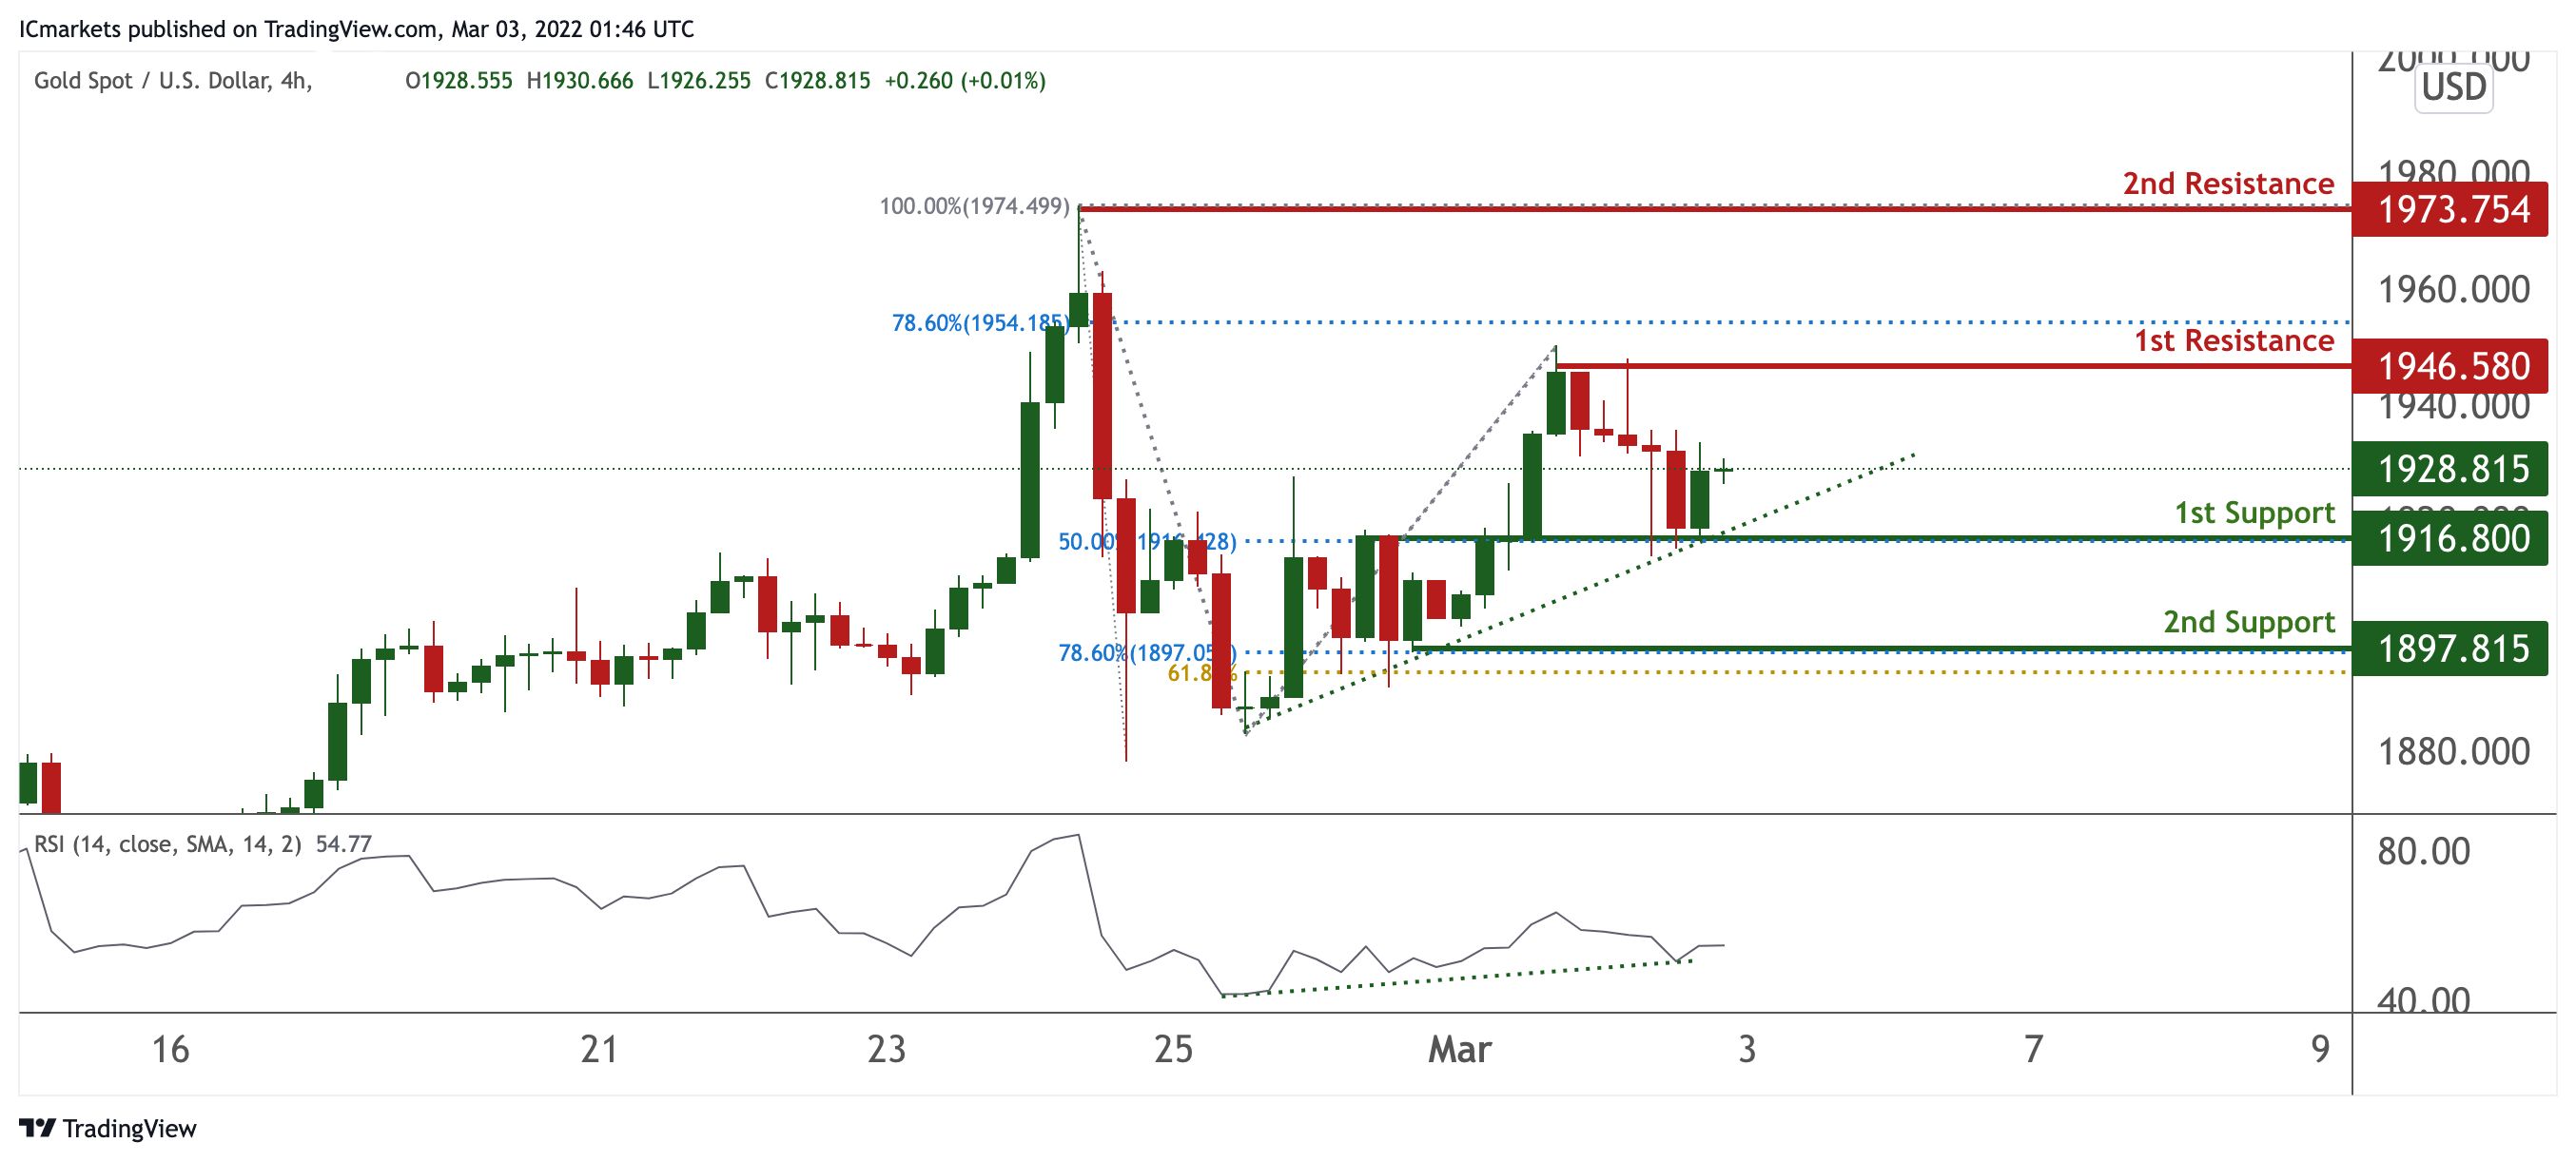
XAU/USD (GOLD):
On the H4 chart, prices are on bullish momentum and abiding to our ascending trendline support. We see potential for a bounce from our 1st support at 1916.8 in line with 50% Fibonacci retracement towards our 1st resistance at 1946.580 in line with 78.6% Fibonacci retracement. Our bullish bias is further supported by RSI being on bullish momentum.
Areas of consideration:
- 4h 1st support at 1916.8
- 4h 1st resistance at 1946.580
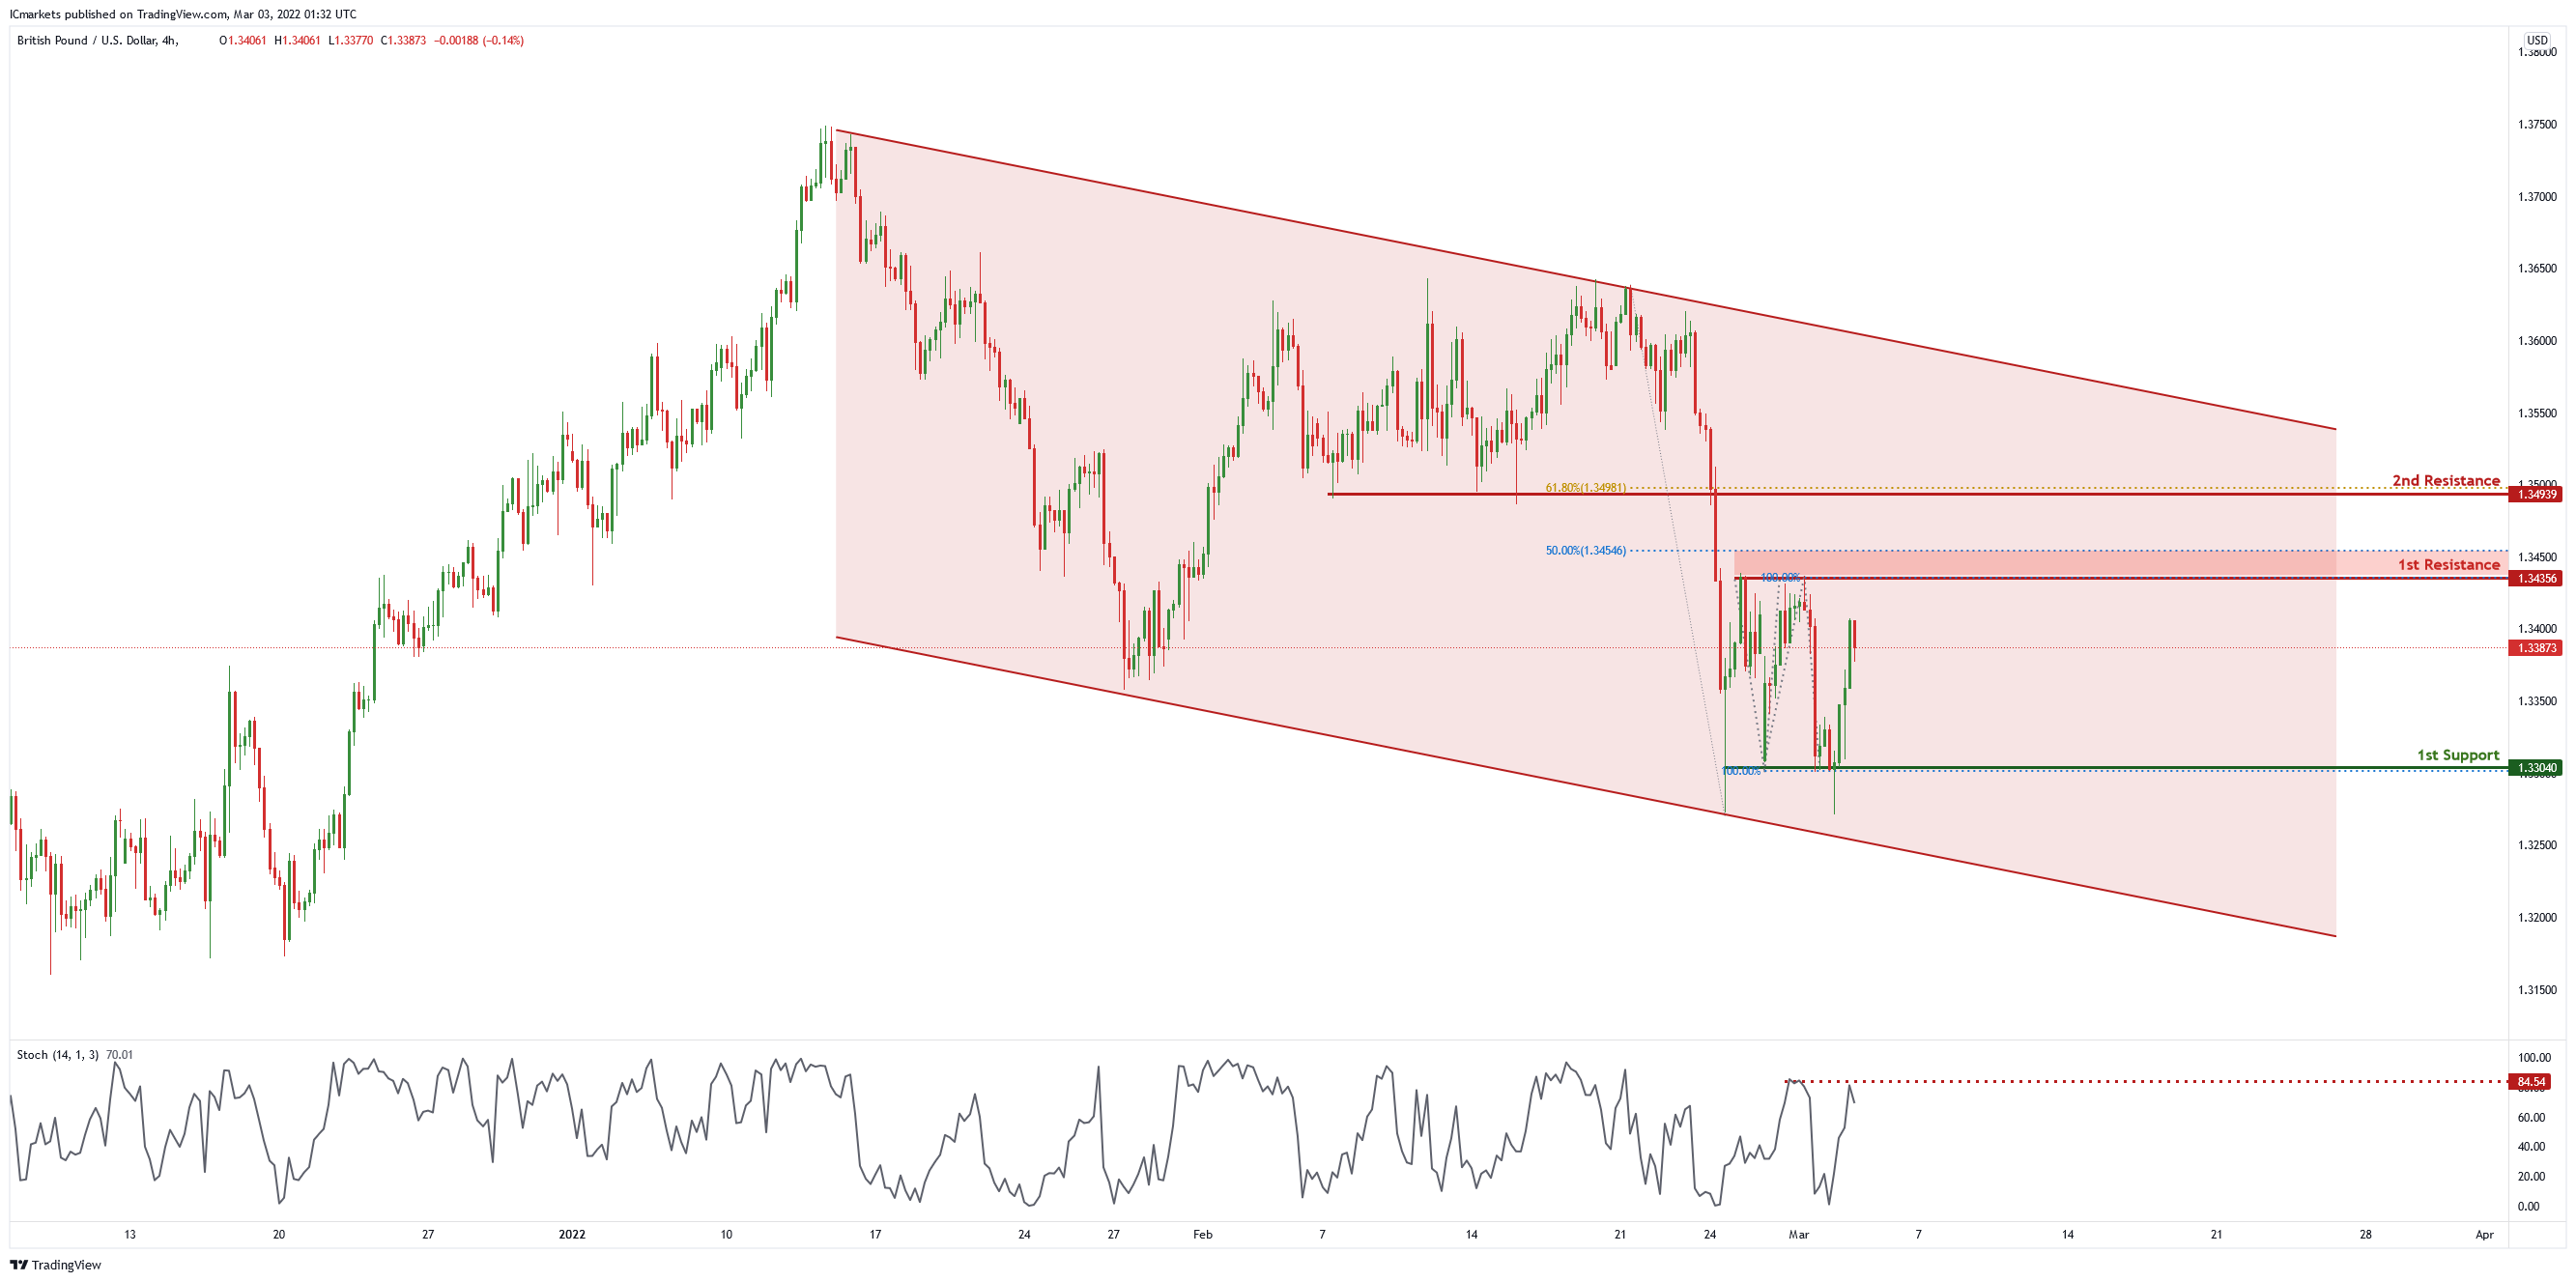
GBP/USD
On the H4 chart , price is trading in a descending channel and near 1st support level of 1.33040 in line with 100% Fibonacci projection. Price can potentially go to the 1st resistance level of 1.34356 in line with 50% Fibonacci retracement and 100% Fibonacci projection. Our bearish bias is supported by the stochastic indicator as it is at resistance level.
Areas of consideration
- H4 1st resistance at 1.34356
- H4 1st support at 1.33040
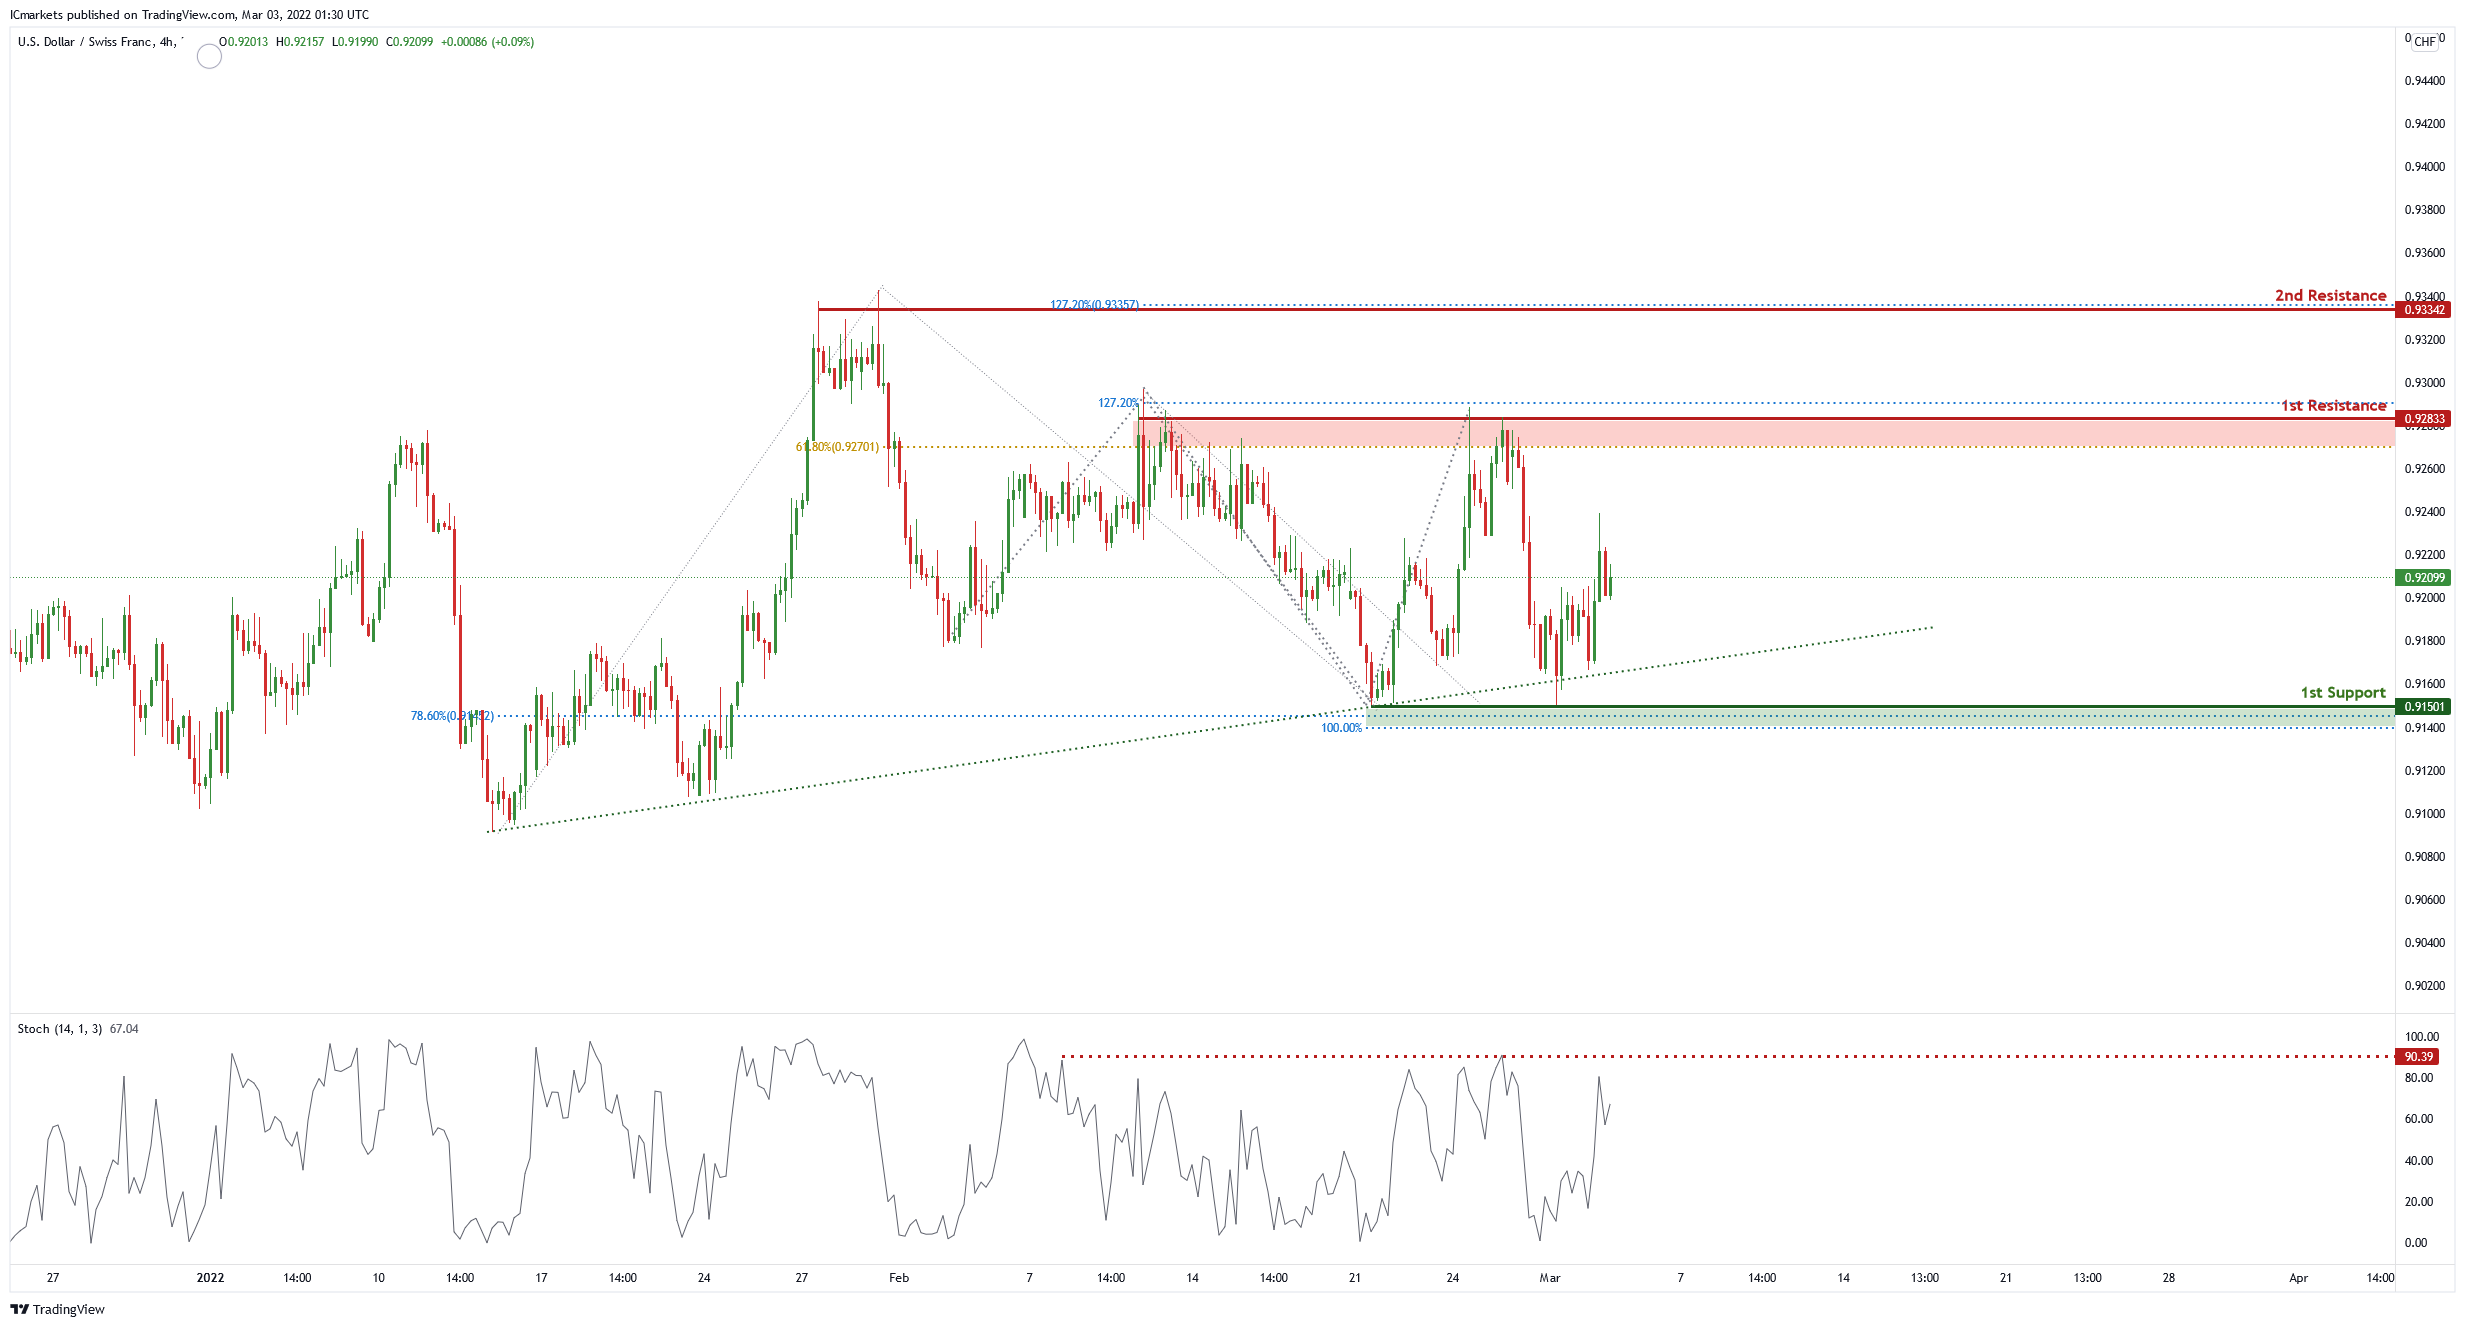
USD/CHF:
On the H4, price is abiding by an ascending trendline and near 1st support level of 0.91663 in line with 78.% Fibonacci projection. Price can potentially bounce to the 1st resistance level of 0.92251 in line with 50% Fibonacci retracement and 100% Fibonacci projection. Our bullish bias is supported by the stochastic indicator as it is at support level.
Areas of consideration
- 1st support level at 0.91663
- 1st resistance level at 0.92251
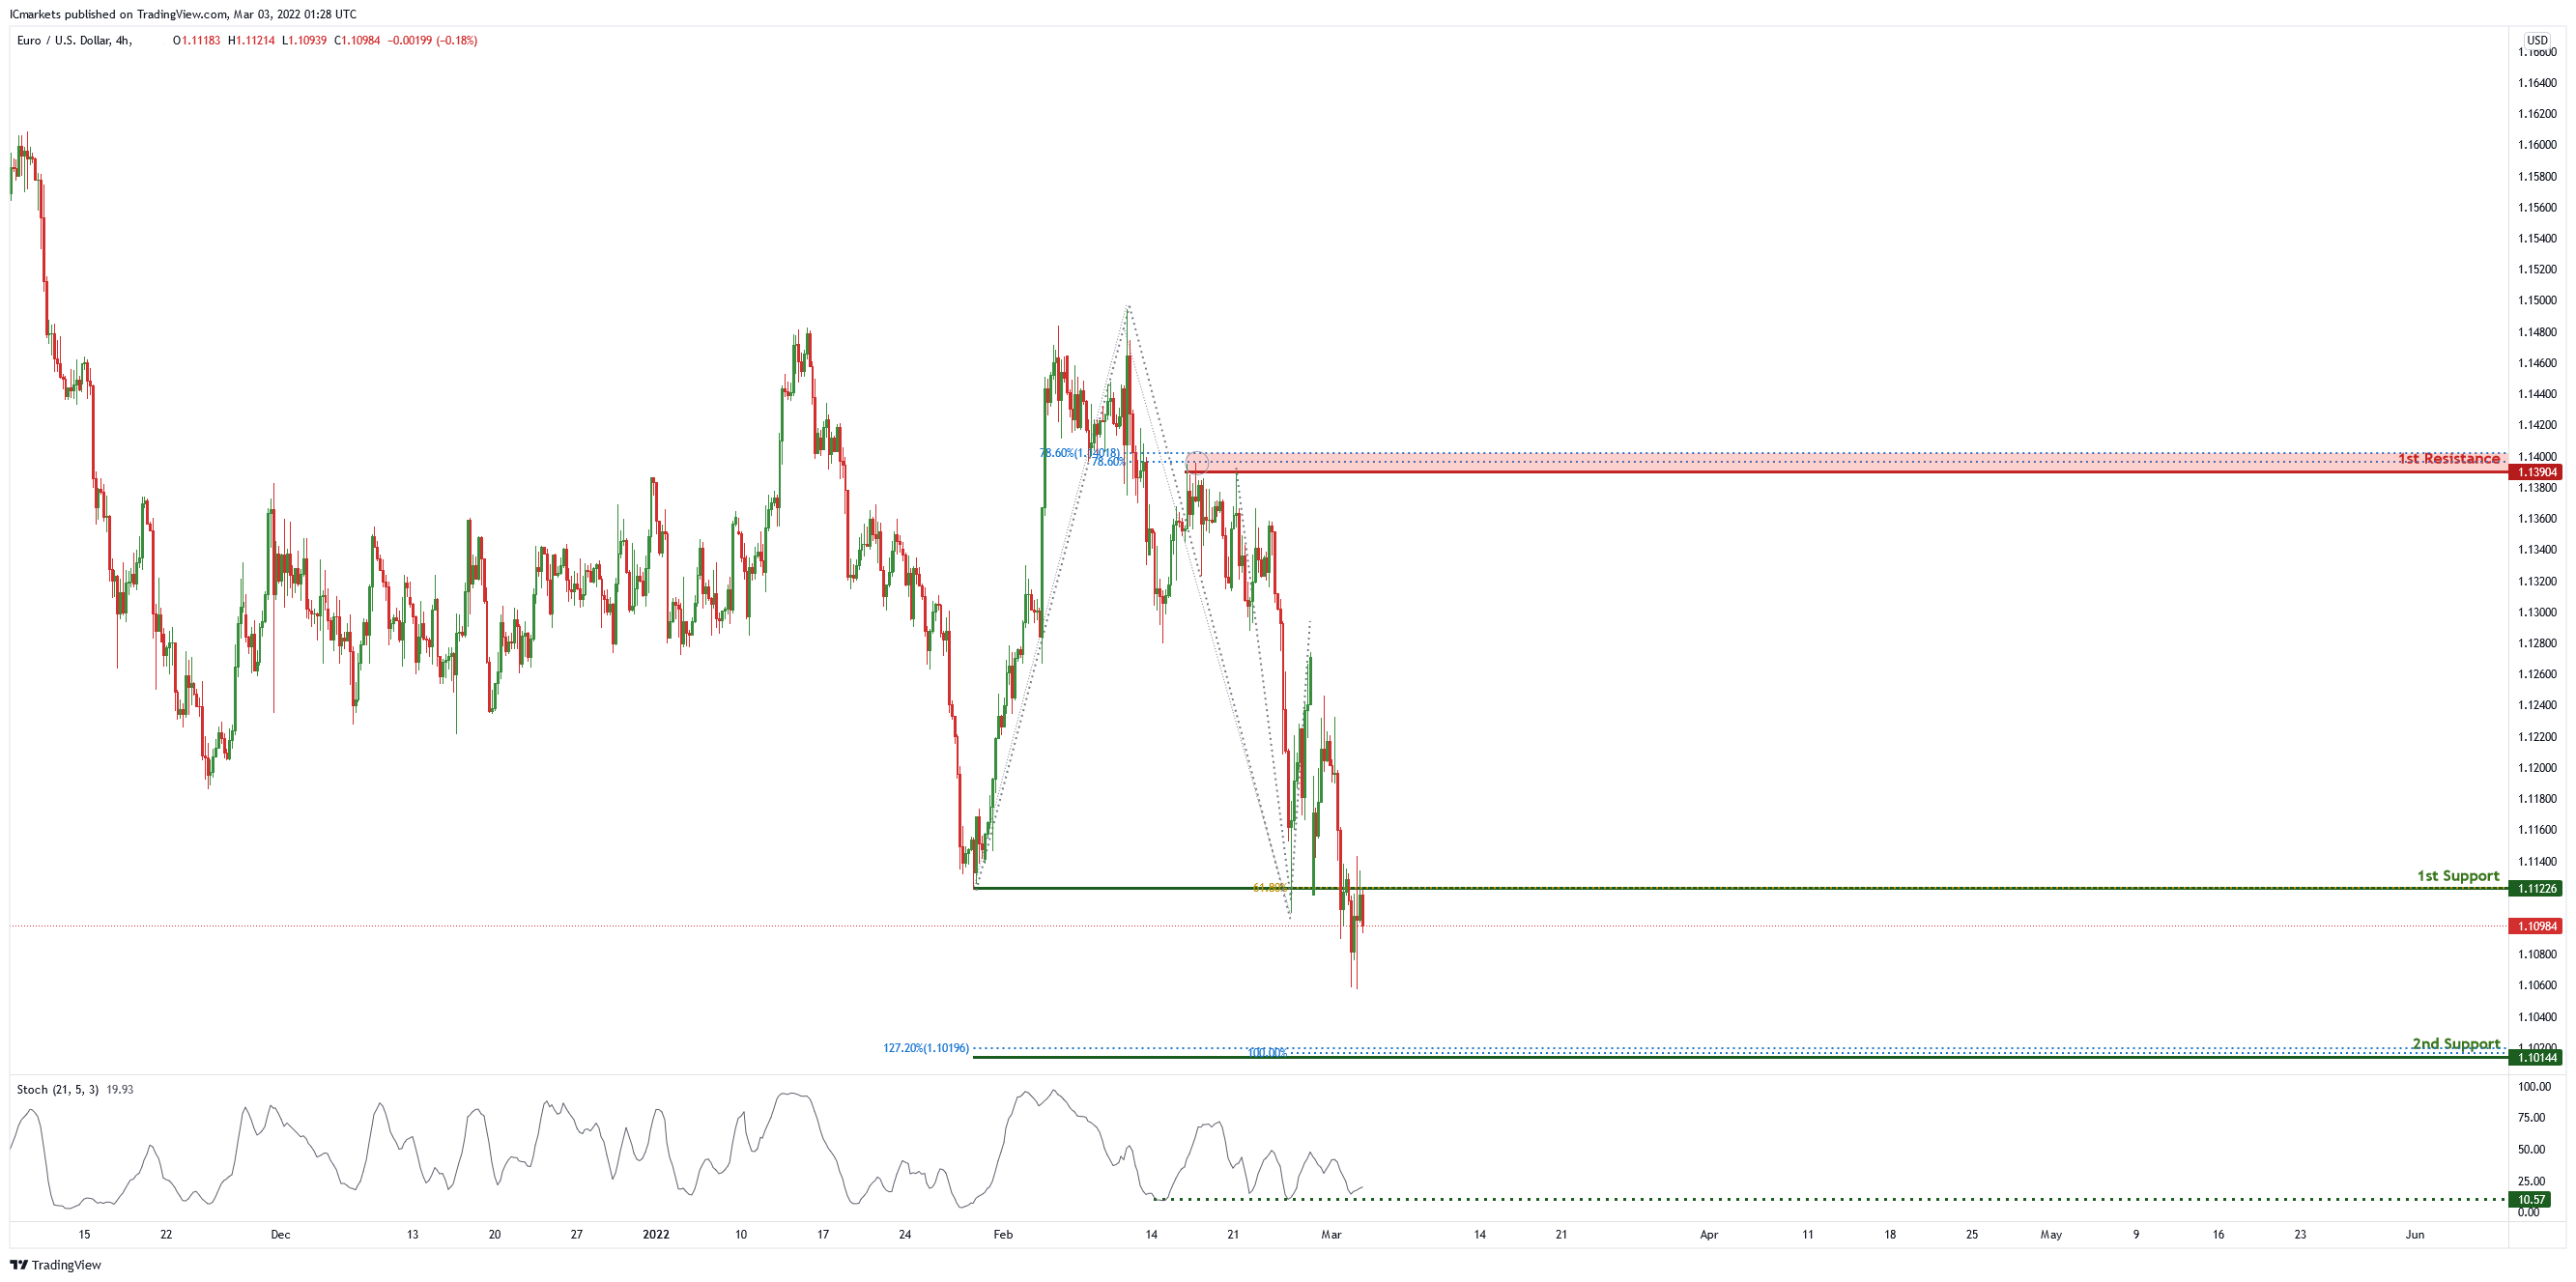
EUR/USD :
On the H4 chart price is near 1st support level of 1.11226 in line with 61.8% Fibonacci projection. Price can potentially go to the 1st resistance level of 1.13904 in line with 78.6% Fibonacci retracement and 78.6% Fibonacci projection. Our bullish bias is supported by the stochastic indicator as it is near support level.
Areas of consideration :
- H4 1st support at 1.11226
- H4 1st resistance at 1.13904
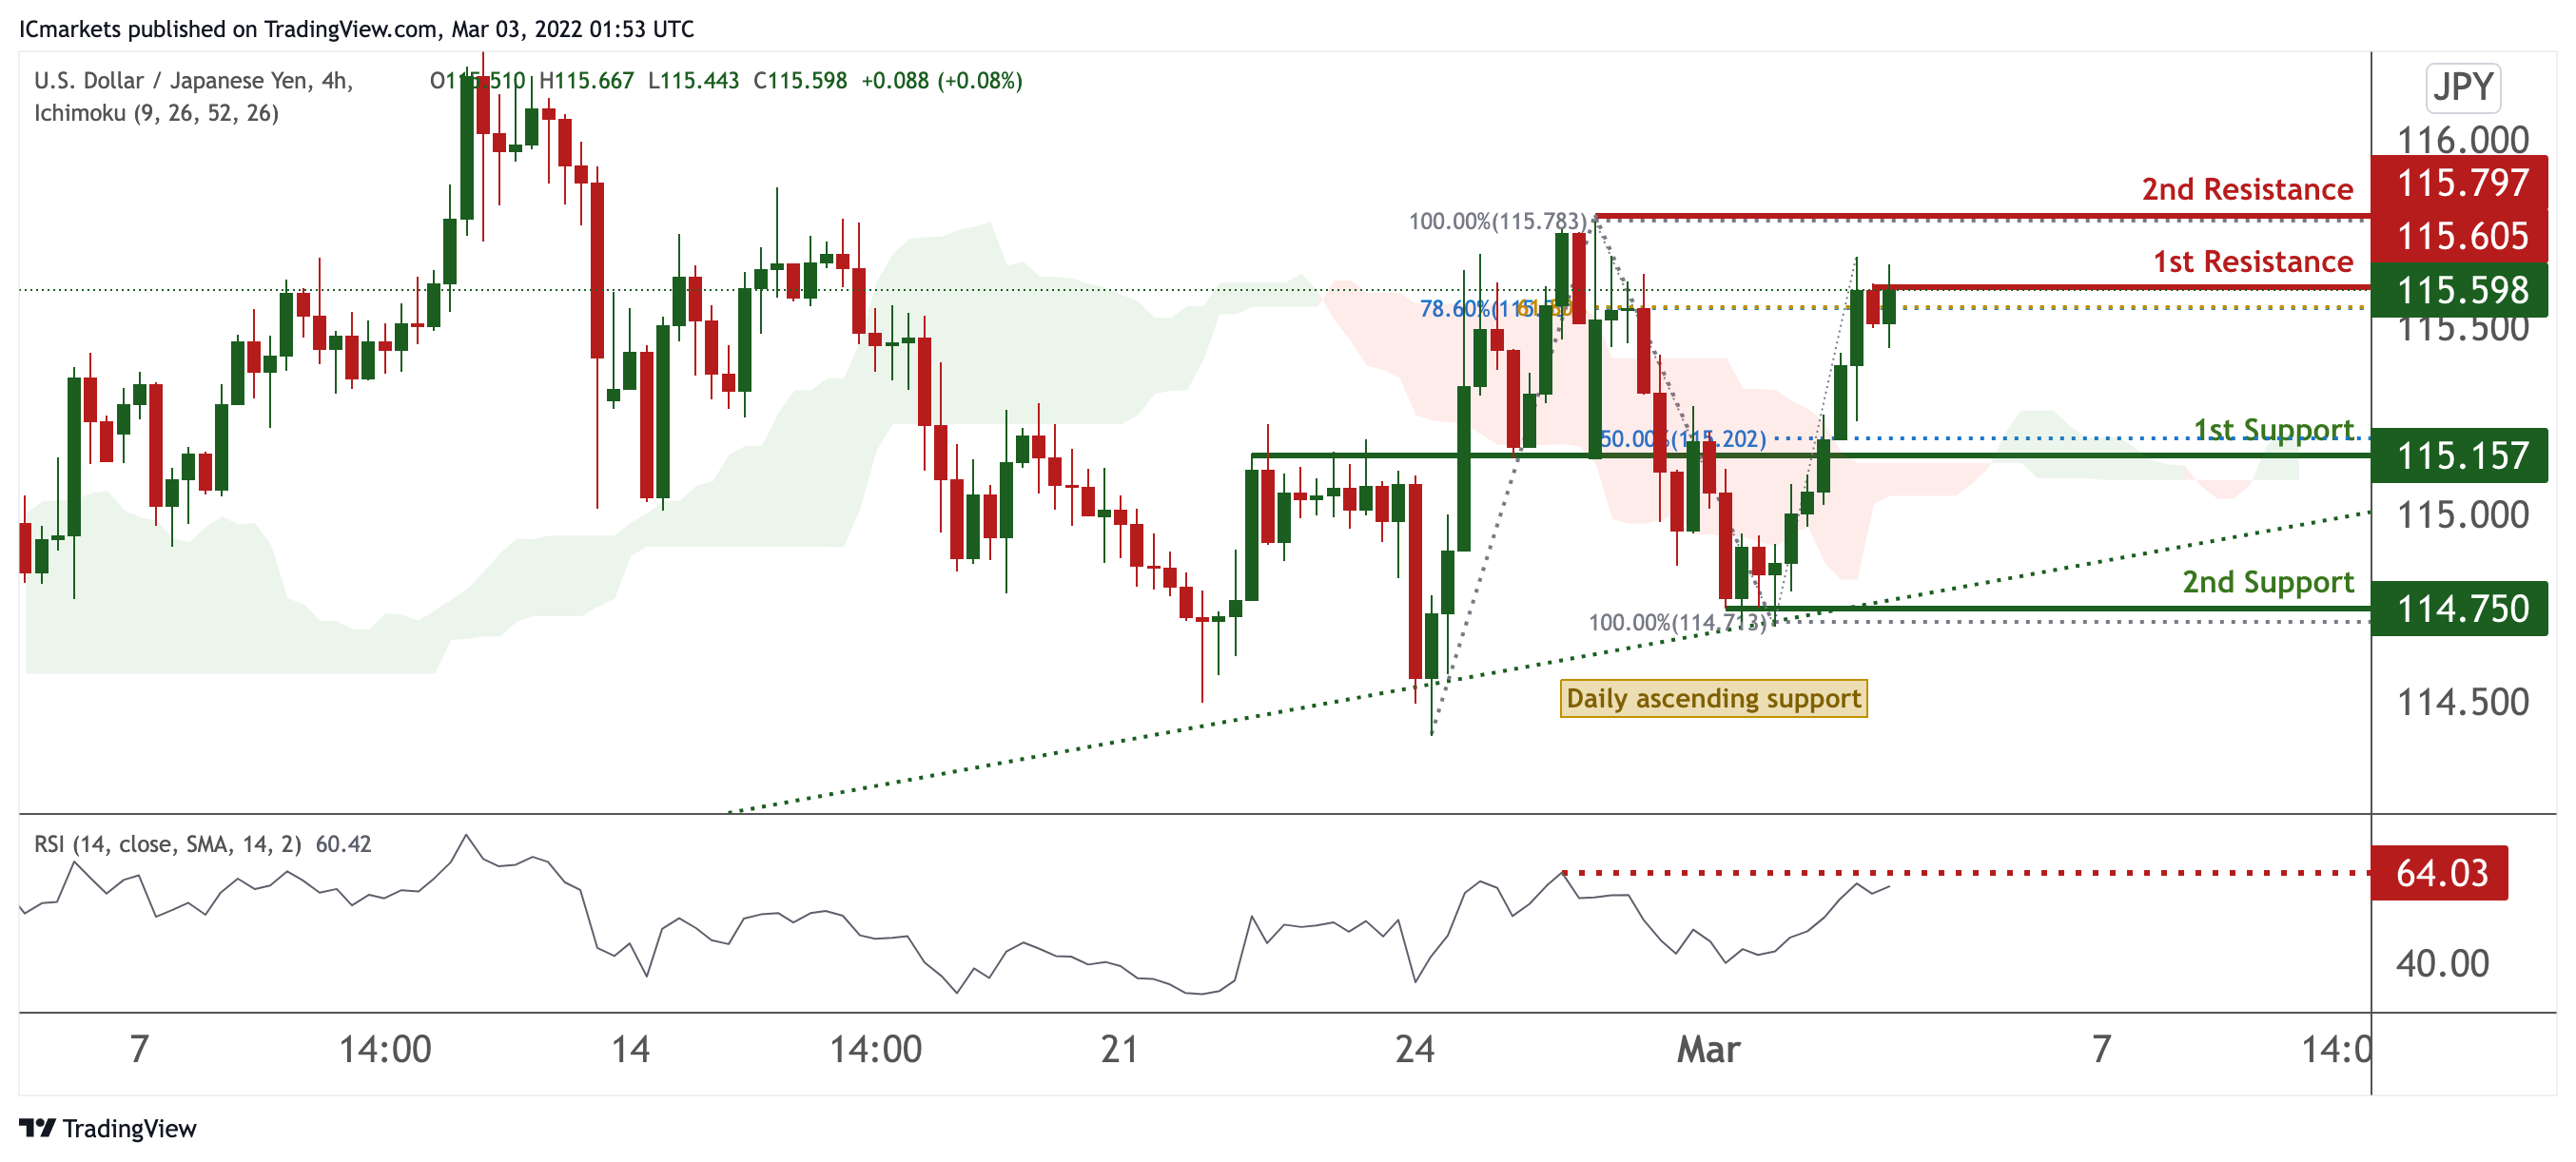
USD/JPY
On the H4 timeframe, prices have recently bounced off a strong graphical overlap and also 1st resistance. We see the potential for further bearish dip from our 1st resistance at 115.605 in line with 78.6% Fibonacci retracement and 61.8% Fibonacci retracement towards our 1st support at 115.157 which is in line with 50% Fibonacci retracement. Our bearish bias is RSI being at levels where dips occurred previously..
Areas of consideration:
- H4 time frame, 1st resistance at 115.605
- H4 time frame, 1st support at 115.157
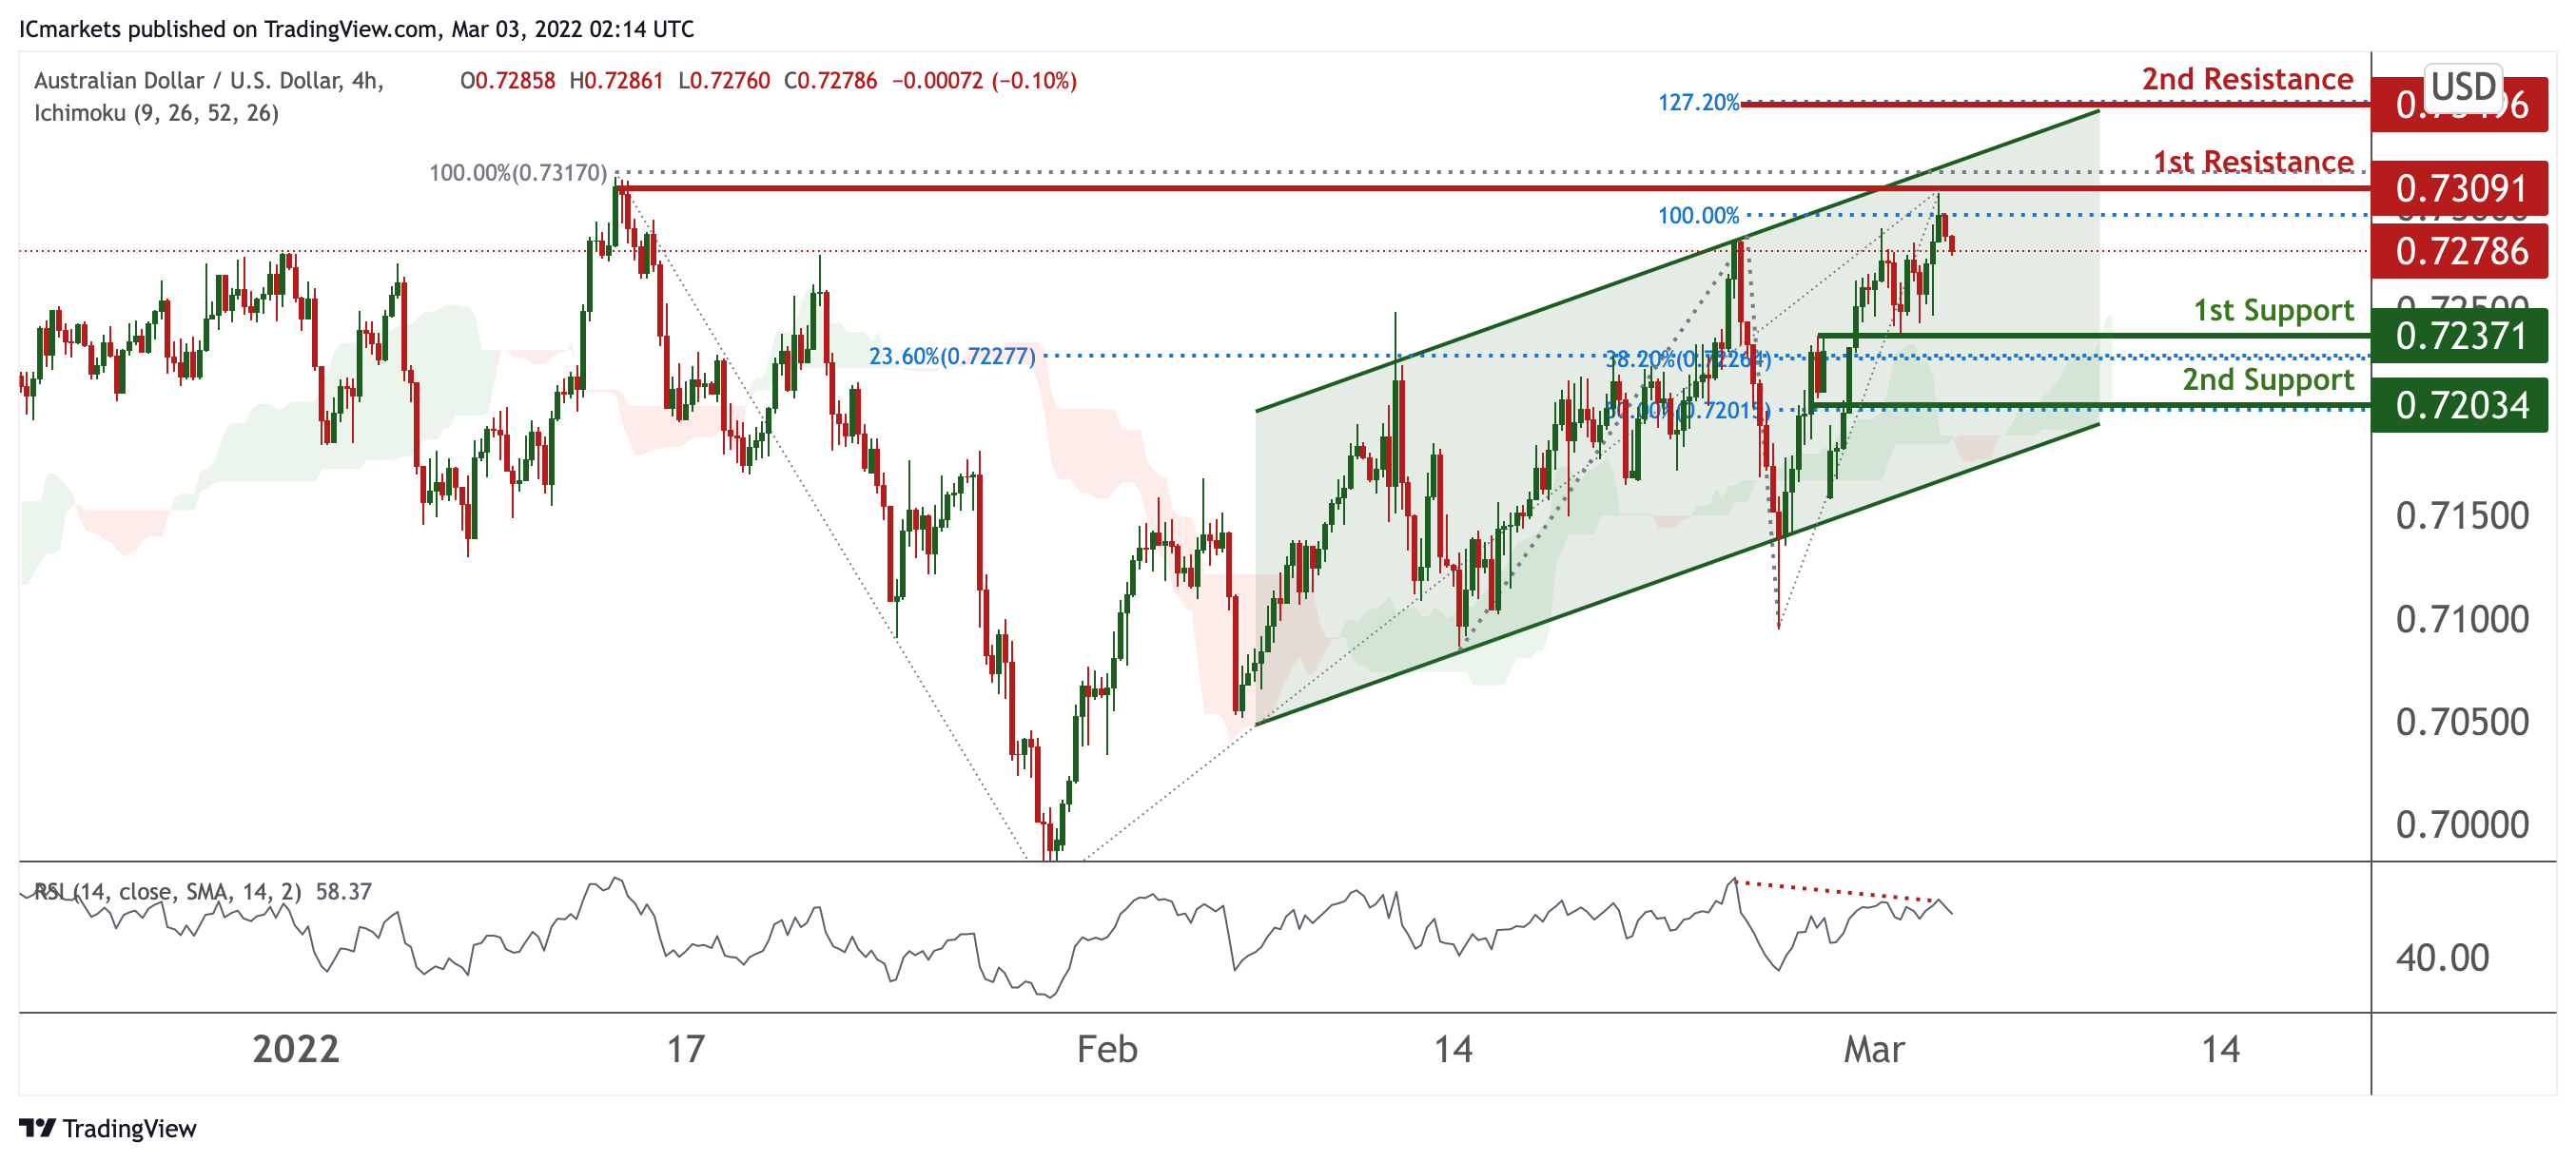
AUD/USD:
On the H4 chart, prices are consolidating in a parallel channel. We see potential for bearish dip from our 1st resistance at 0.73091 in line with 100% Fibonacci retracement and towards our 1st support at 0.73072 which is in line with 23.6% Fibonacci retracement and 38.2% Fibonacci retracement. Alternatively, price can potentially climb higher to the 2nd resistance level at 0.73496 in line with 127.2% Fibonacci projection. Our bearish bias is further supported by bearish divergence spotted on RSI.
Areas of consideration :
- H4 1st support at 0.73072
- H4 1st resistance at 0.73091
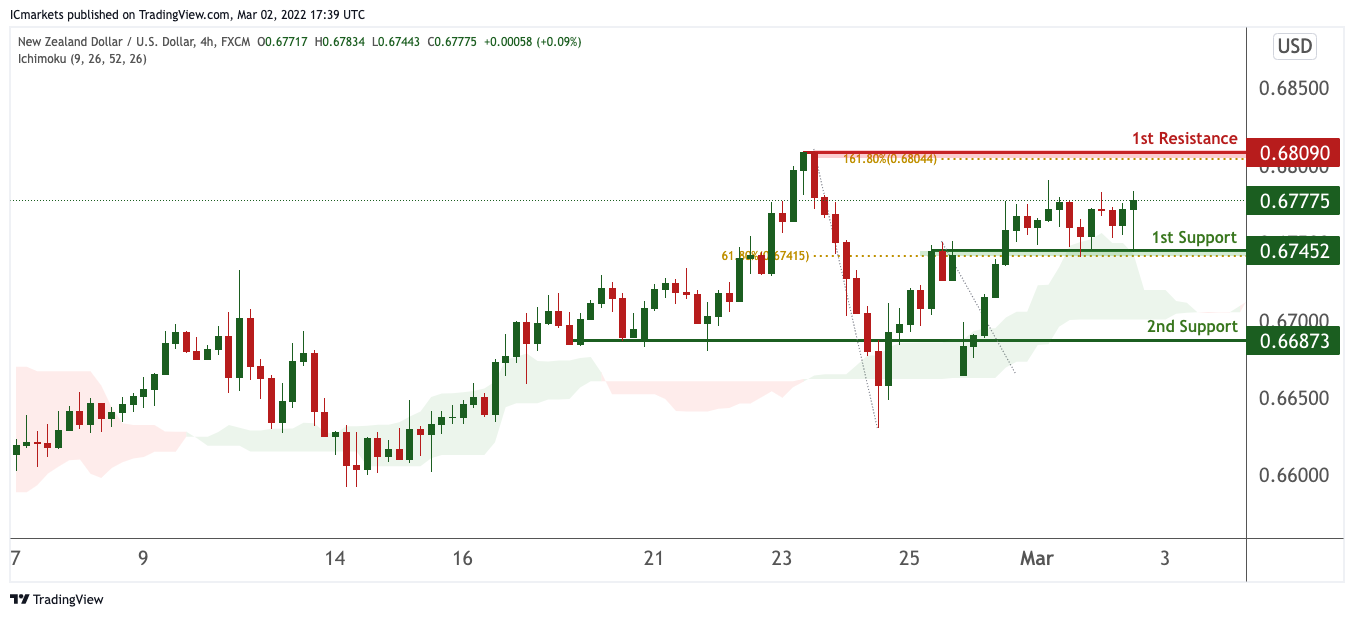
NZD/USD:
On the H4 chart, price is near 1st support level of 0.67452 in line with horizontal overlap support and 61.8% Fibonacci retracement. Price can potentially rise to the 1st resistance level of 0.68090 in line with the horizontal swing high resistance and 161.8% Fibonacci extension level. Alternatively, price may break 1st support and head for 2nd support at 0.66873. Our bullsh bias is supported by how price is expected to bounce off the support of the ichimoku cloud.
Areas of consideration:
- H4 time frame, 1st resistance at 0.68090
- H4 time frame, 1st support at 0.67452
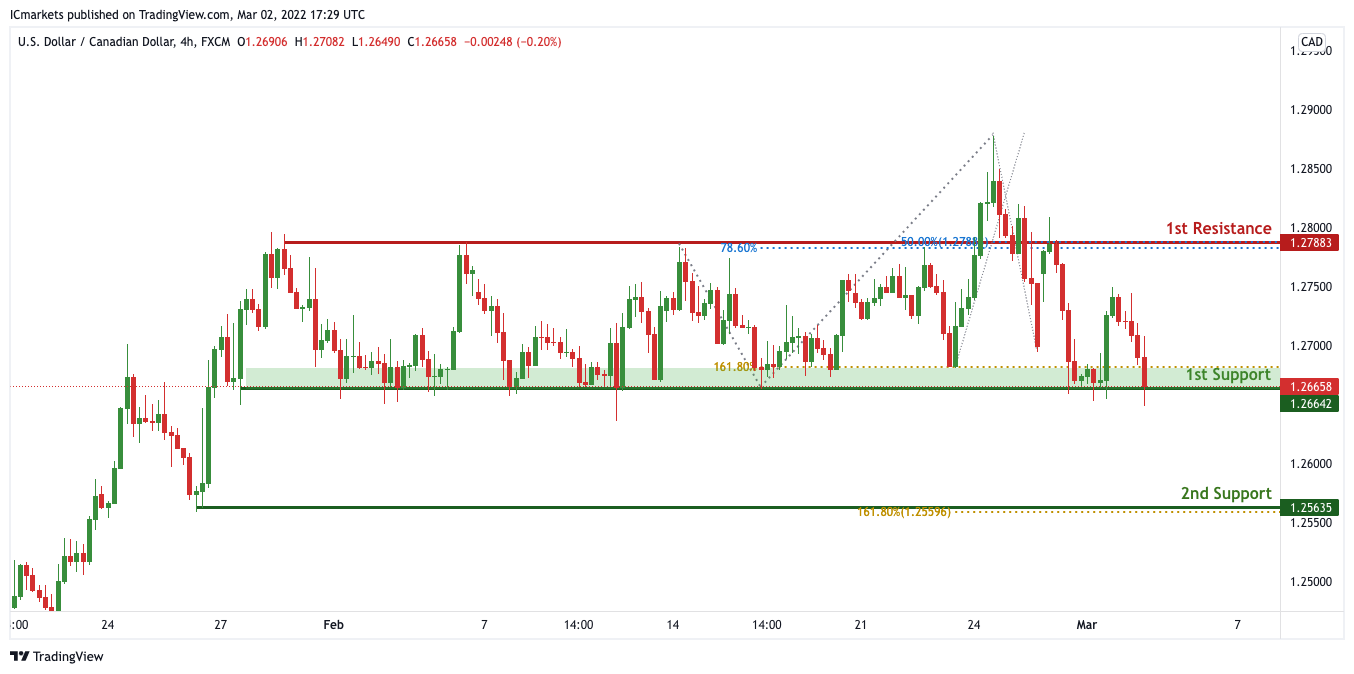
USD/CAD:
On the H4, price is ranging in between our 1st support and 1st resistance. With no clear indication of where price is heading at this current juncture, We have a bias that price will continue to range within our support and resistance of 1.26642 and 1.27883 respectively.
Areas of consideration:
- H4 time frame, 1st support at 1.26642
- H4 time frame, 1st resistance at 1.27883
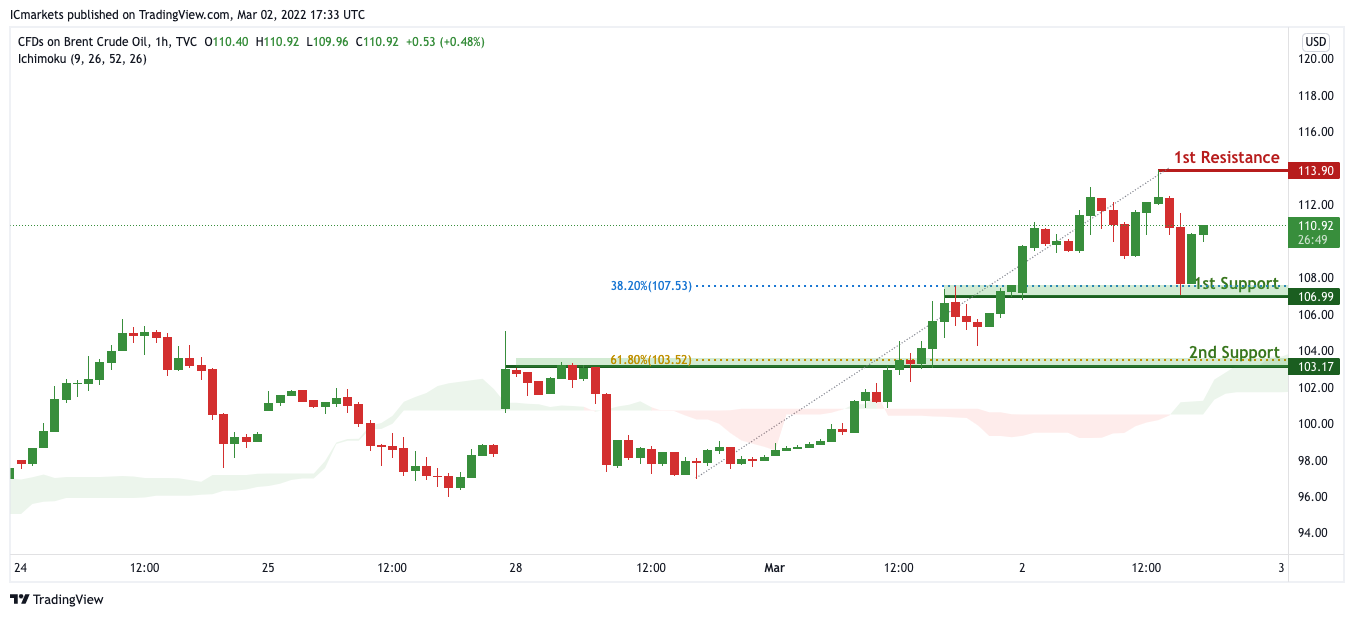
OIL:
On the H4 chart, price is near 1st support level of 106.99 in line with horizontal overlap support and 38.2% Fibonacci retracement. Price can potentially rise to the 1st resistance level of 113.90 in line with the horizontal swing high resistance. Alternatively, price may break 1st support and head for 2nd support at 103.17. Our bullsh bias is supported by how price is moving above the ichimoku cloud.
Areas of consideration:
- H4 time frame, 1st resistance of 113.91
- H4 time frame, 1st support of 106.99
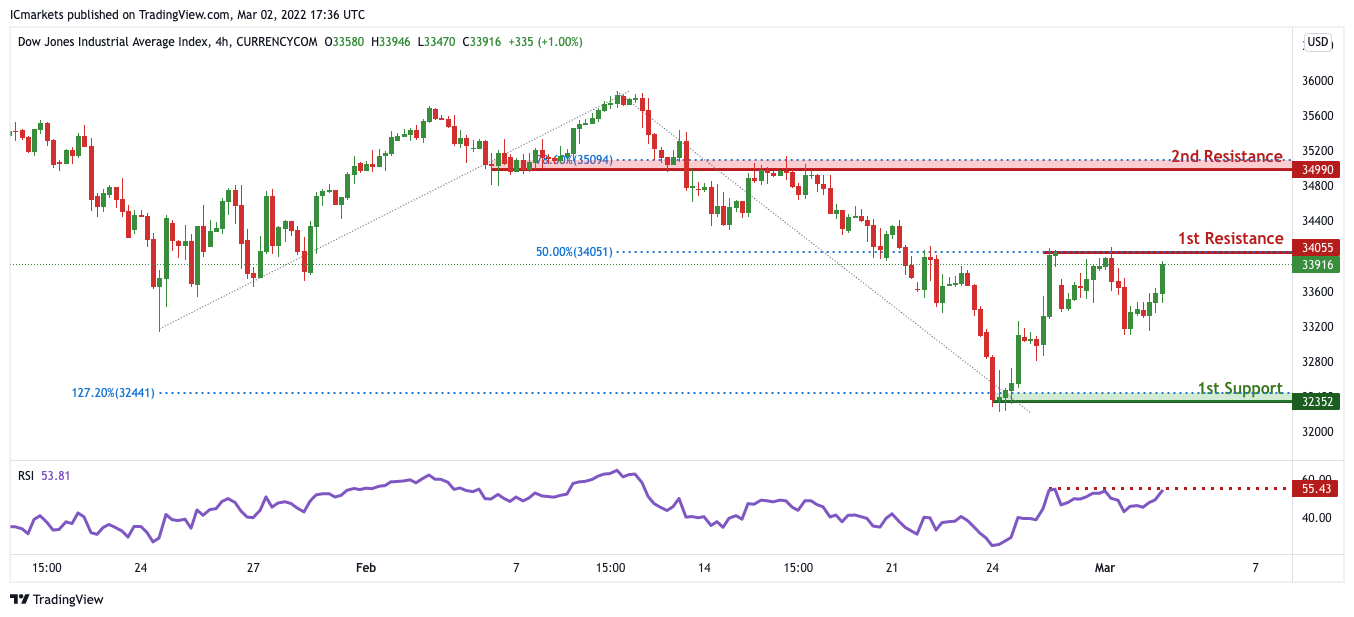
Dow Jones Industrial Average:
On the H4 timeframe, We see the possibility of bearish continuation from our 1st resistance at 34055 in line with horizontal overlap resistance towards our 1st support at 32352 in line with the horizontal swing low support. Alternatively, price may break 1st resistance and head for 2nd resistance at 34990 in line with the 78.6% Fibonacci retracement level. Our bearish bias is further supported by how price is expected to reverse off the RSI indicator.
Areas of consideration :
- H4 1st support at 32352
- H4 1st resistance at 34055


