Currency pair GBP/USD
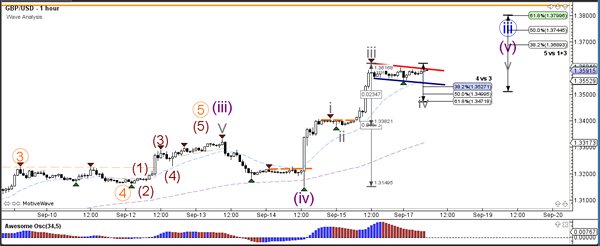
The GBP/USD bullish momentum is strong and probably part of a wave 3 (blue). The resistance line (orange) is a potential resistance from the daily chart.
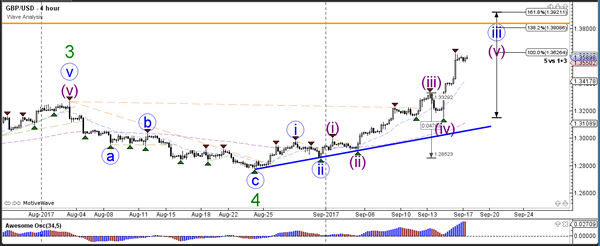
The GBP/USD is building a bull flag chart pattern (red/blue), which is a continuation pattern within the uptrend. The Fibonacci levels of wave 4 vs 3 (grey) are most likely support whereas a break above the bull flag could see price challenge the Fibonacci targets of wave 5 (grey/purple).
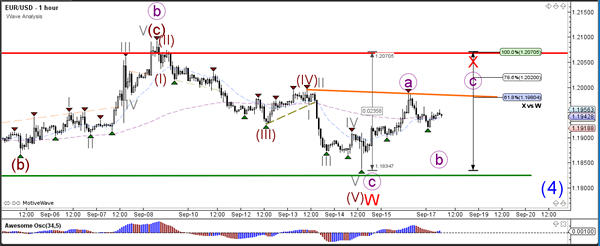
Currency pair EUR/USD
The EUR/USD seems to have completed an ABC correction (red) within the wave 4 (blue). A bullish breakout could indicate the continuation of the uptrend via wave 5 (blue).
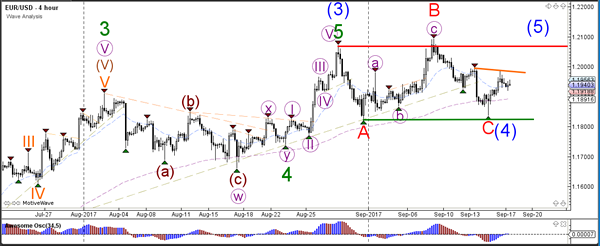
The wave 4 (blue) might become extended via a WXY formation (red) if price develops a 3 wave pattern (purple).
Currency pair GBP/USD
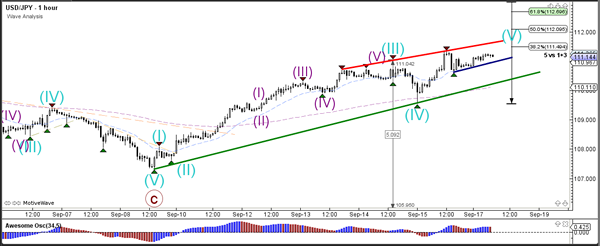
The USD/JPY is challenging the strong horizontal resistance level (red), which could indicate the end of a wave 1 (light green) or alternatively wave A (green).
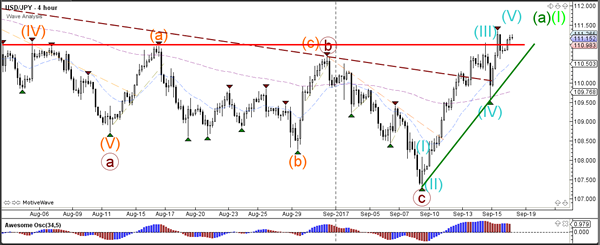
The USD/JPY break below the support trend lines (green/blue) could indicate a bearish ABC correction. Otherwise price could still continue slightly higher within the wave 5 (blue).