
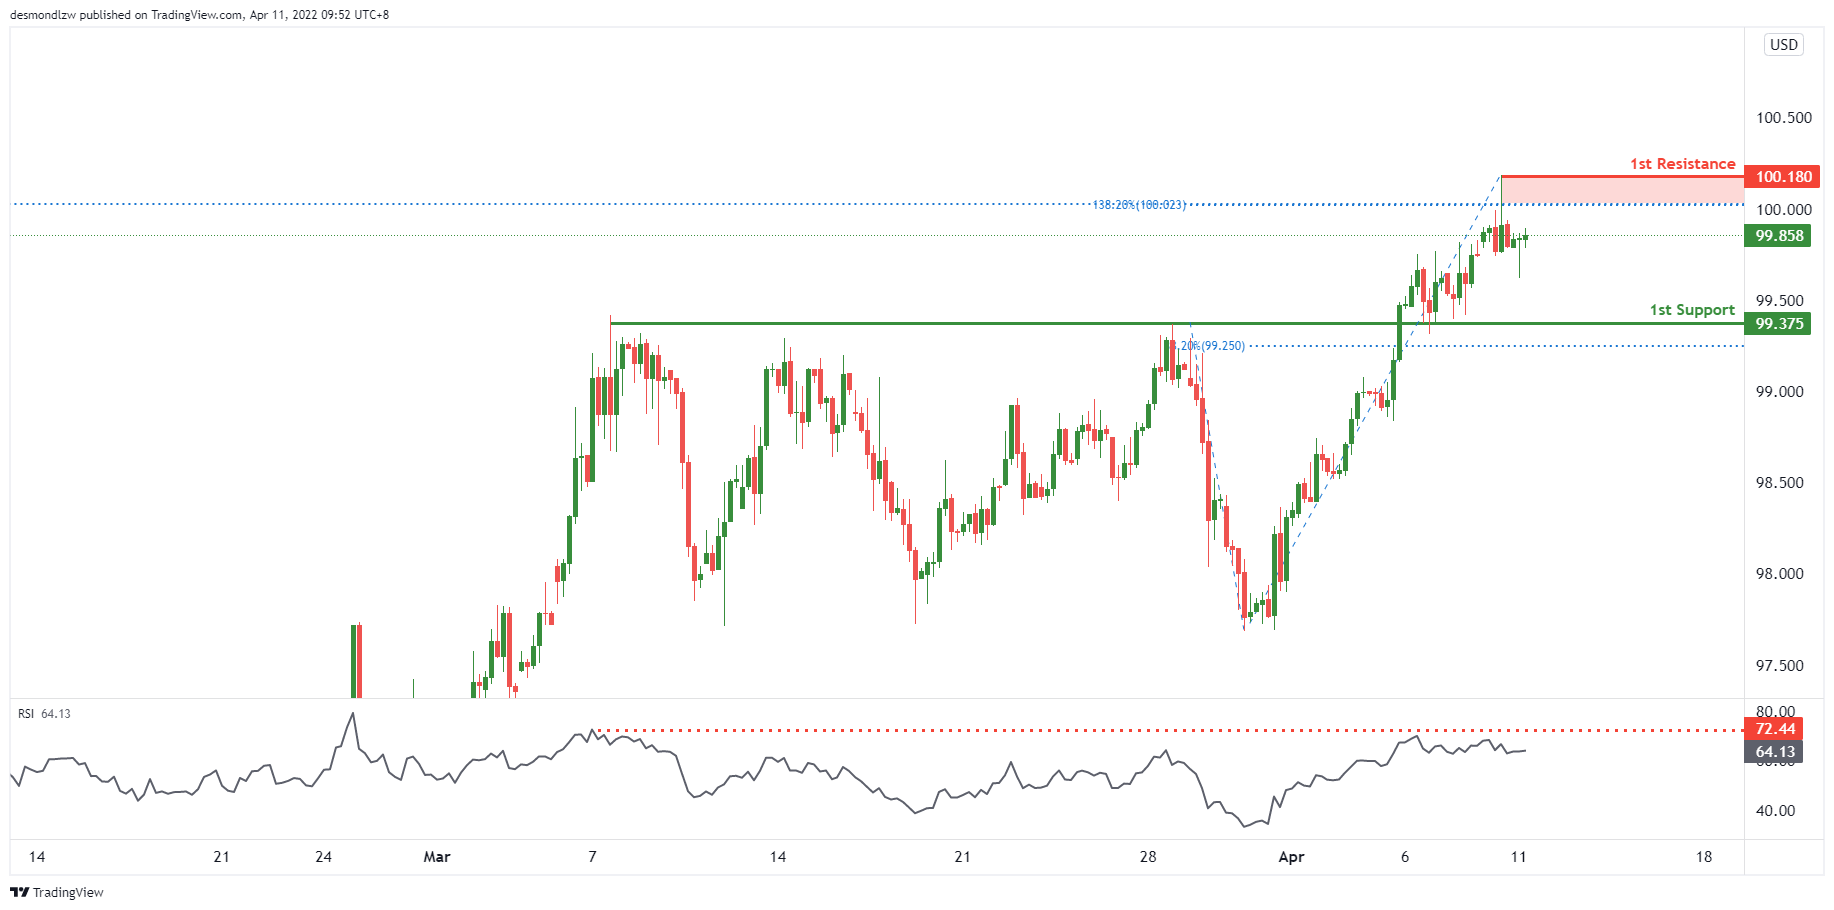
DXY:
On the H4 timeframe, prices are consolidating in a swing high and an area of Fibonacci confluences. We see the potential for a dip from our 1st resistance at 100.180 in line 138.2% Fibonacci extension towards our 1st support at 99.375 in line with 38.2% Fibonacci retracement. RSI is at levels where dips previously occurred, further supporting our bearish bias.
Areas of consideration:
- H4 time frame, 1st resistance at 100.180
- H4 time frame, 1st support at 99.375
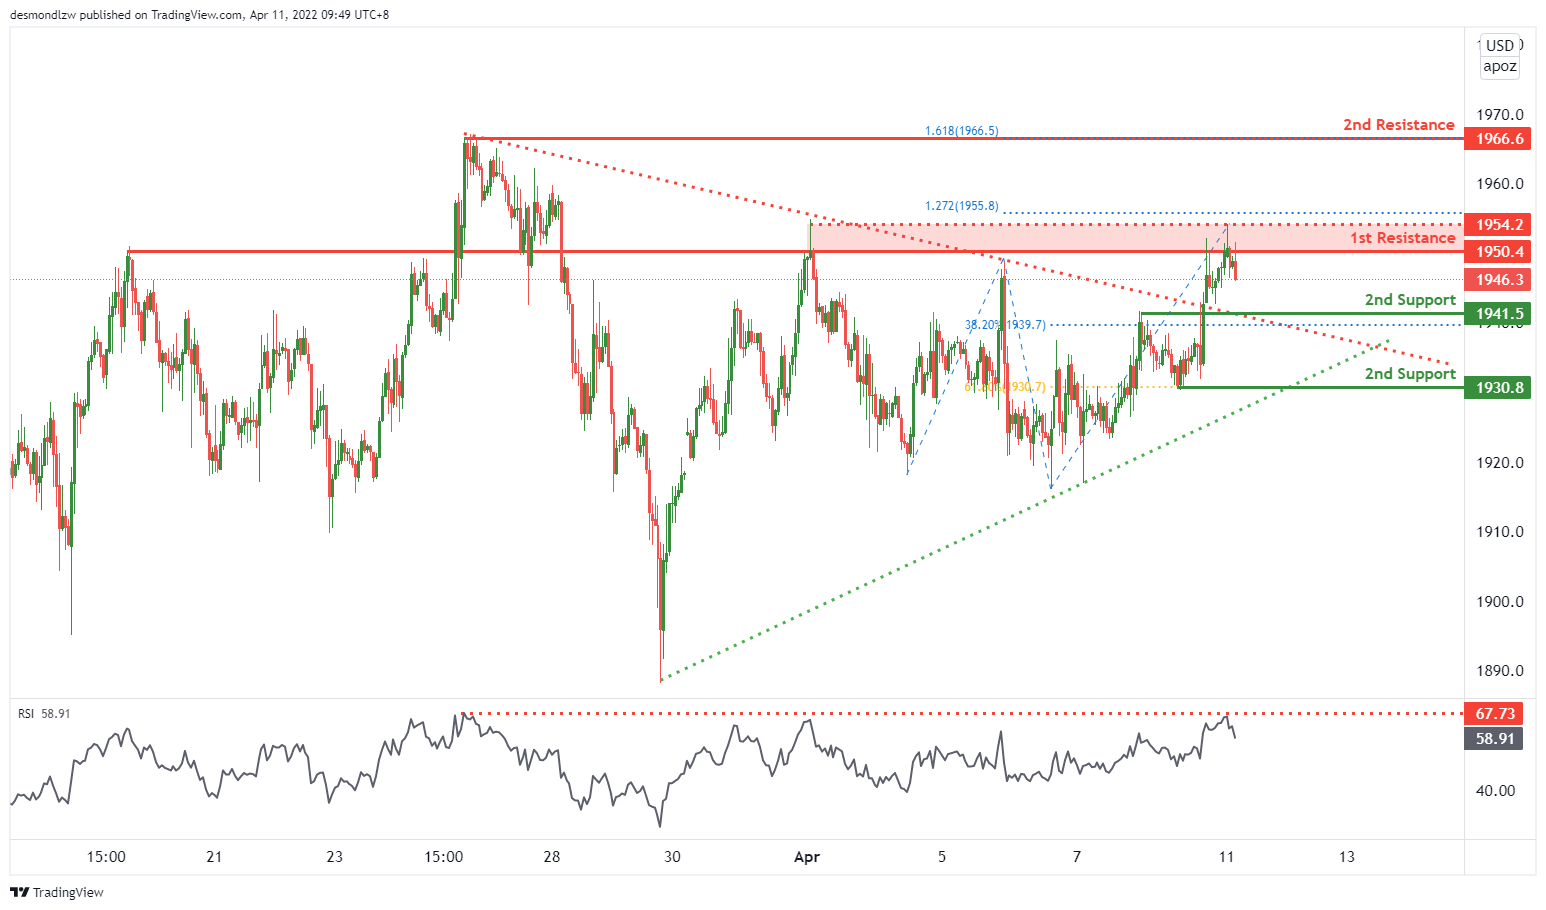
XAU/USD (GOLD):
On the weekly, prices are on bullish momentum and abiding by an ascending trendline support. We see the potential for a bounce from our 1st support at 1875.057 in line with 161.8% Fibonacci Projection. Prices are trading above our ichimoku clouds, further supporting our bullish view. On the daily, prices are on a support. We see the potential for a bounce from our 1st support at 1910.811 in line with 50% Fibonacci retracement towards our 1st resistance at 1910.811 in 100% Fibonacci Projection. Prices are trading above our Ichimoku clouds, further supporting our bullish bias. On the H4, prices are consolidating in a triangle pattern. We see the potential for a dip from our 1st resistance at 1937.627 which is an area of Fibonacci confluences towards our 1st support at 1915.592 in line which is a graphical overlap and in line with 61.8% Fibonacci Projection. RSI is at levels where dips previously occurred, further supporting our bearish view.
Areas of consideration:
- 4h 1st support at 1915.592
- 4h 1st resistance at 1937.627
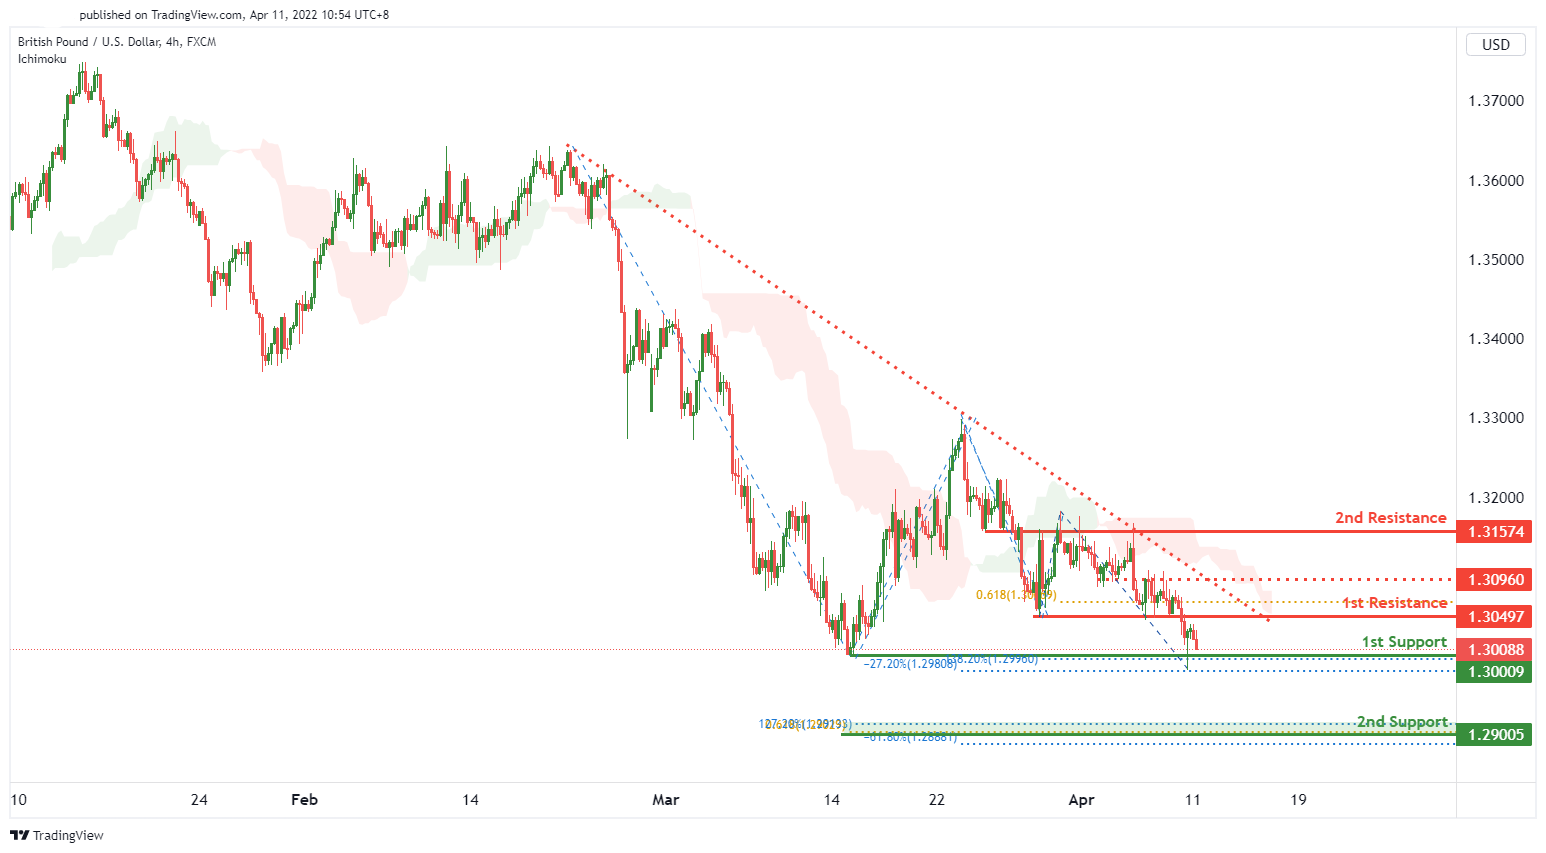
GBP/USD:
On the H4 timeframe, we expect to see a potential for bullish bounce from our 1st support level of 1.30009 in line with 138.2% Fibonacci extension and -27.2% Fibonacci expansion towards the 2nd resistance level of 1.31574 in line with a graphical overlap resistance. Alternatively, price might potentially dip from 1st resistance level of 1.30497 in line with 61.8% Fibonacci projection towards the 2nd support level of 1.29005 in line with Fibonacci confluence (61.8% Fibonacci projection, 127.2% Fibonacci extension and -61.8% fibonacci expansion). We have a neutral bias as we are waiting for price confirmation.
Areas of consideration:
- H4 1st resistance at 1.30497
- H4 1st support at 1.30009
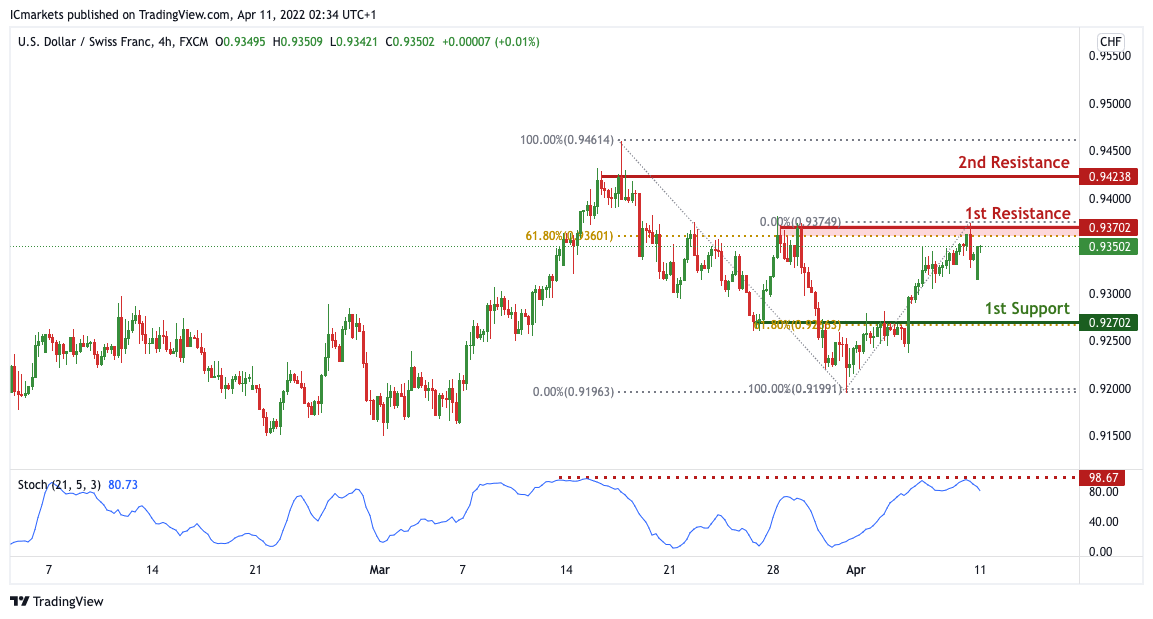
USD/CHF:
On the H4, with price expected to reverse off the stochastic indicator, we expect to see a potential for bearish drop from our 1st resistance of 0.93702 in line with the 61.8% fibonacci retracement towards our 1st support level at 0.92702 in line with 61.8% Fibonacci retracement. Alternatively, If price breaks out, it can potentially move towards our 2nd resistance level at 0.94238 which is in line with the swing high resistance.
Areas of consideration
- 1st support level at 0.92702
- 1st resistance level at 0.93702
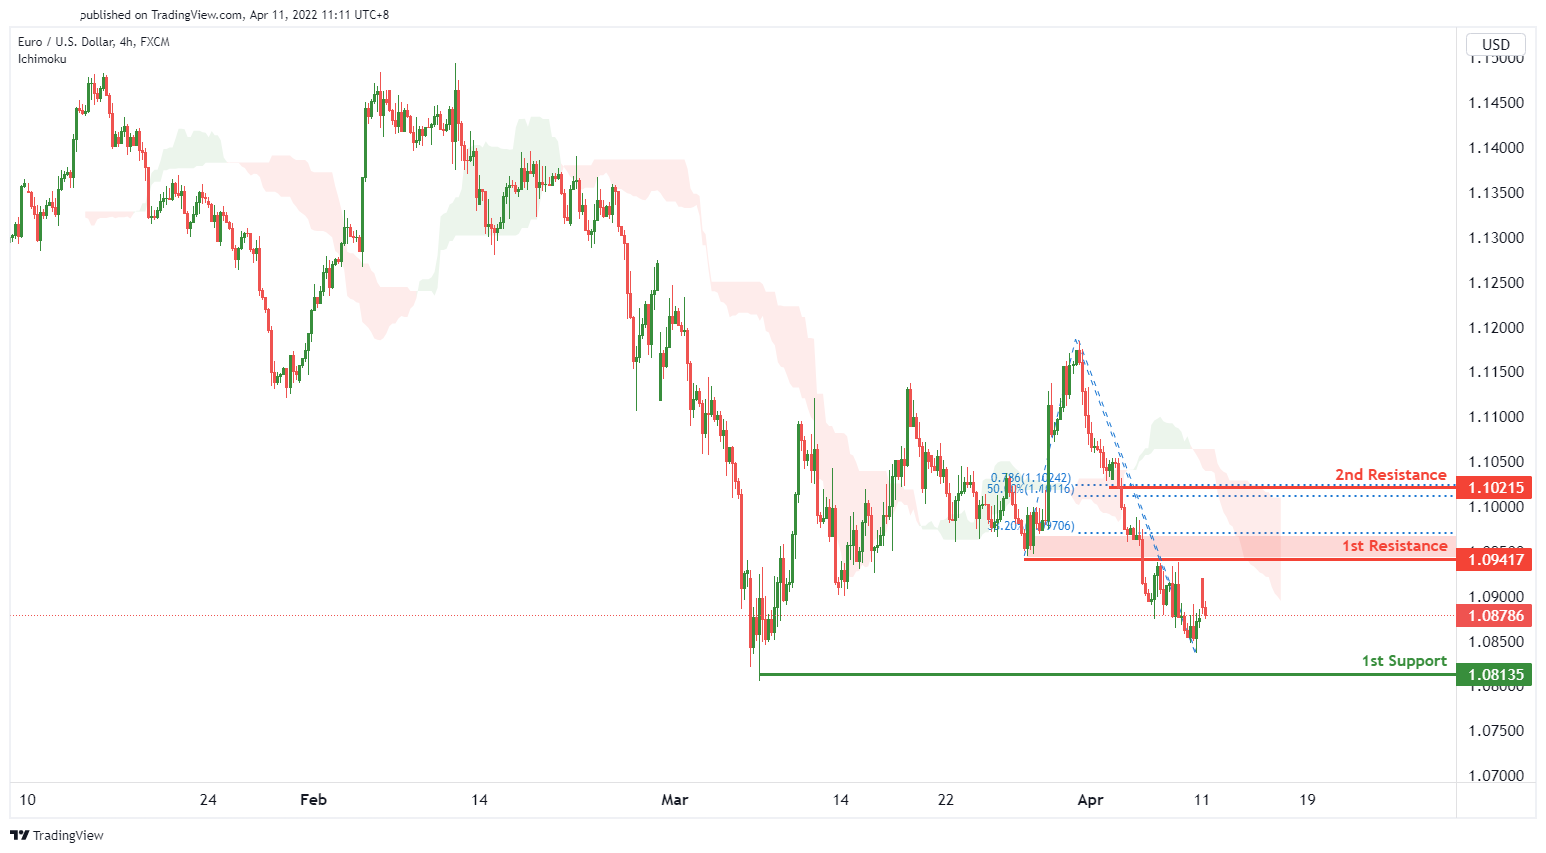
EUR/USD :
On the H4 timeframe, price is near a key pivot. We see the potential for a bearish reversal from our 1st resistance level of 1.09471 in line with 38.2% Fibonacci retracement towards our 1st support level of 1.08135 in line with a graphical swing low support. Our bearish bias is supported by price trading below the ichimoku cloud indicator.
Areas of consideration :
- H4 1st resistance at 1.09417
- H4 1st support at 1.08135
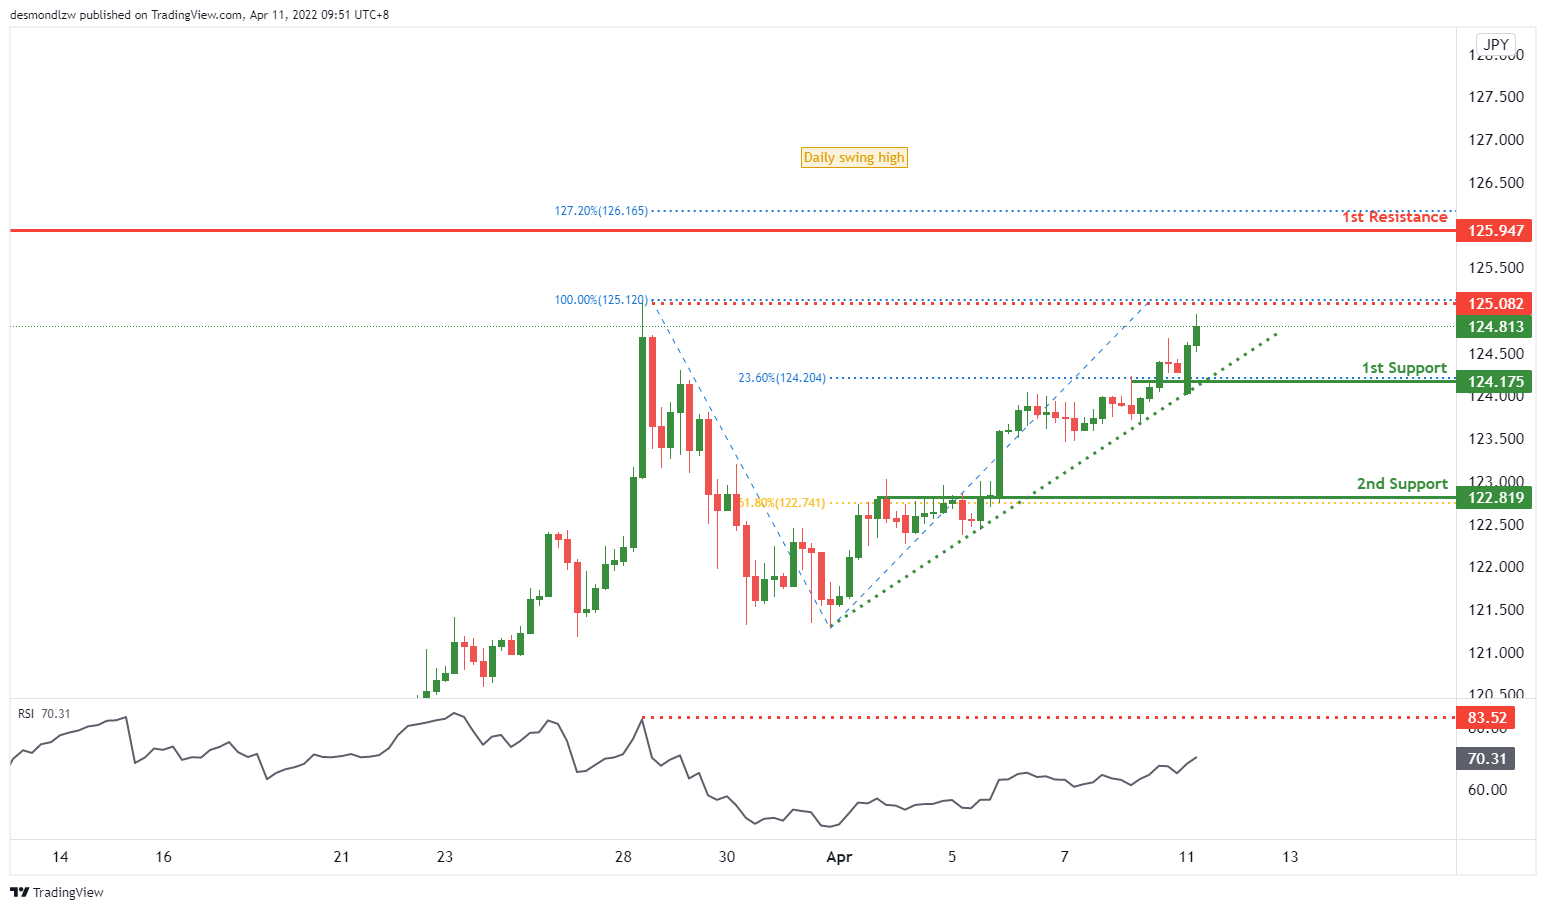
USD/JPY:
On the H4 timeframe, prices are on bullish momentum and abiding by an ascending trendline support. We see the potential for a bounce from our 1st support at 124.175 in line with 23.6% Fibonacci retracement. A break from our intermediate resistance at 125.082 in line with 100% Fibonacci Projection will find prices climbing towards our 1st resistance at 125.947 in line with 127.2% Fibonacci Extension and also daily swing high. Prices are trading above our ichimoku clouds, further supporting our bullish bias.
Areas of consideration:
- H4 time frame, 1st resistance at 125.947
- H4 time frame, 1st support at 124.175
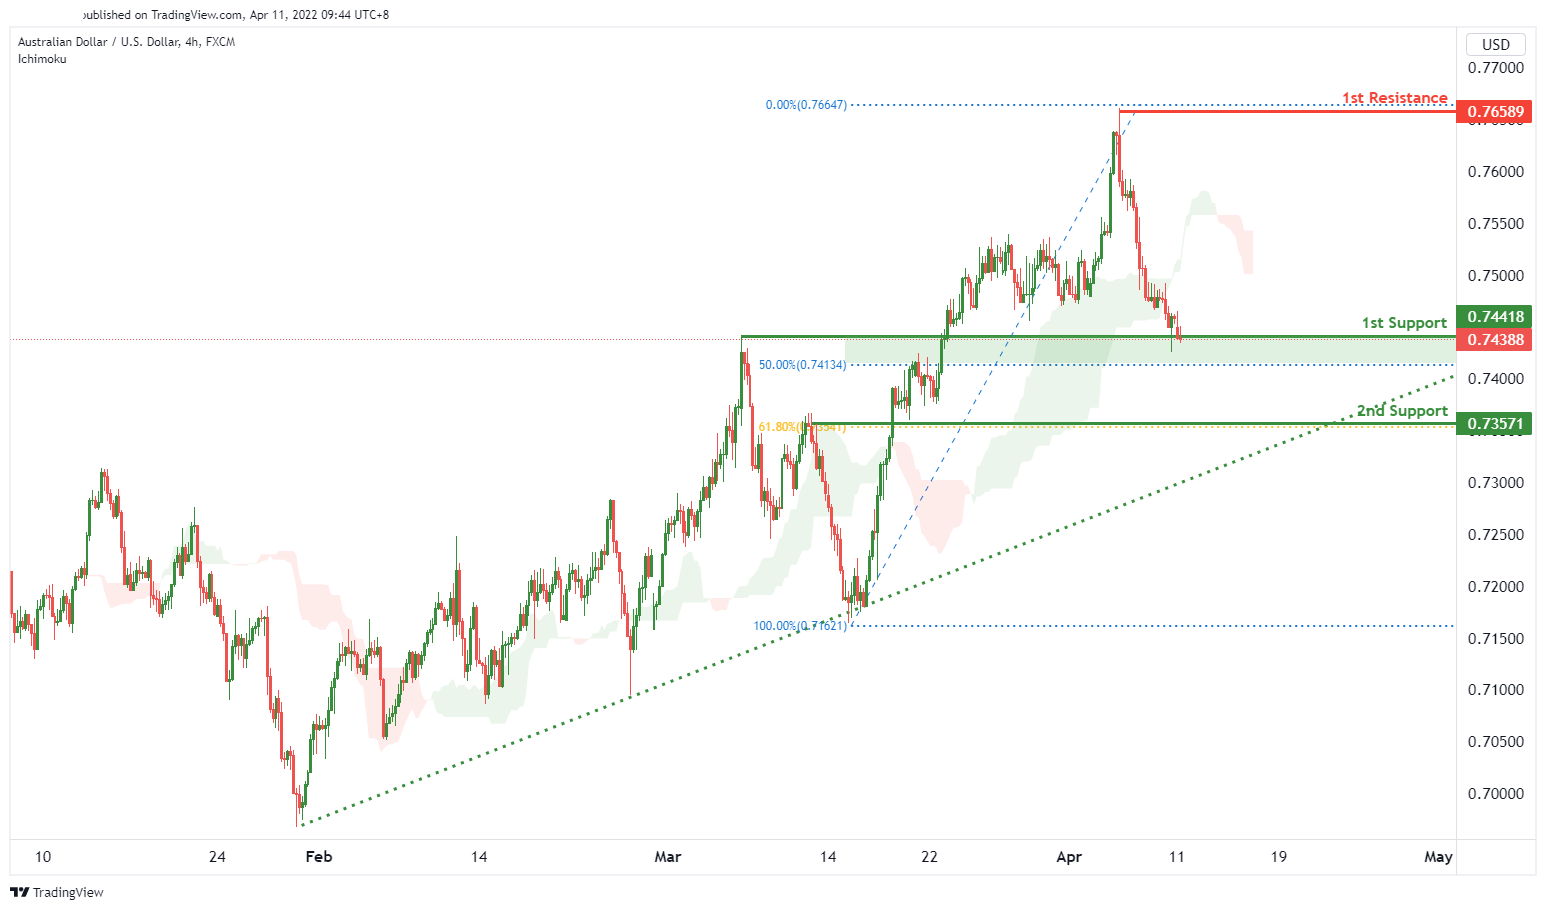
AUD/USD:
On the H4 timeframe, we see the potential for a bullish bounce from our 1st support level at 0.74261 in line with 50% Fibonacci retracement towards our 1st resistance at 0.75406 in line with 50% Fibonacci retracement and 61.8% Fibonacci projection. Our bullish bias is supported by price trading above the ichimouku cloud indicator.
Areas of consideration
- H4 1st resistance at 0.75406
- H4 1st support at 0.74261
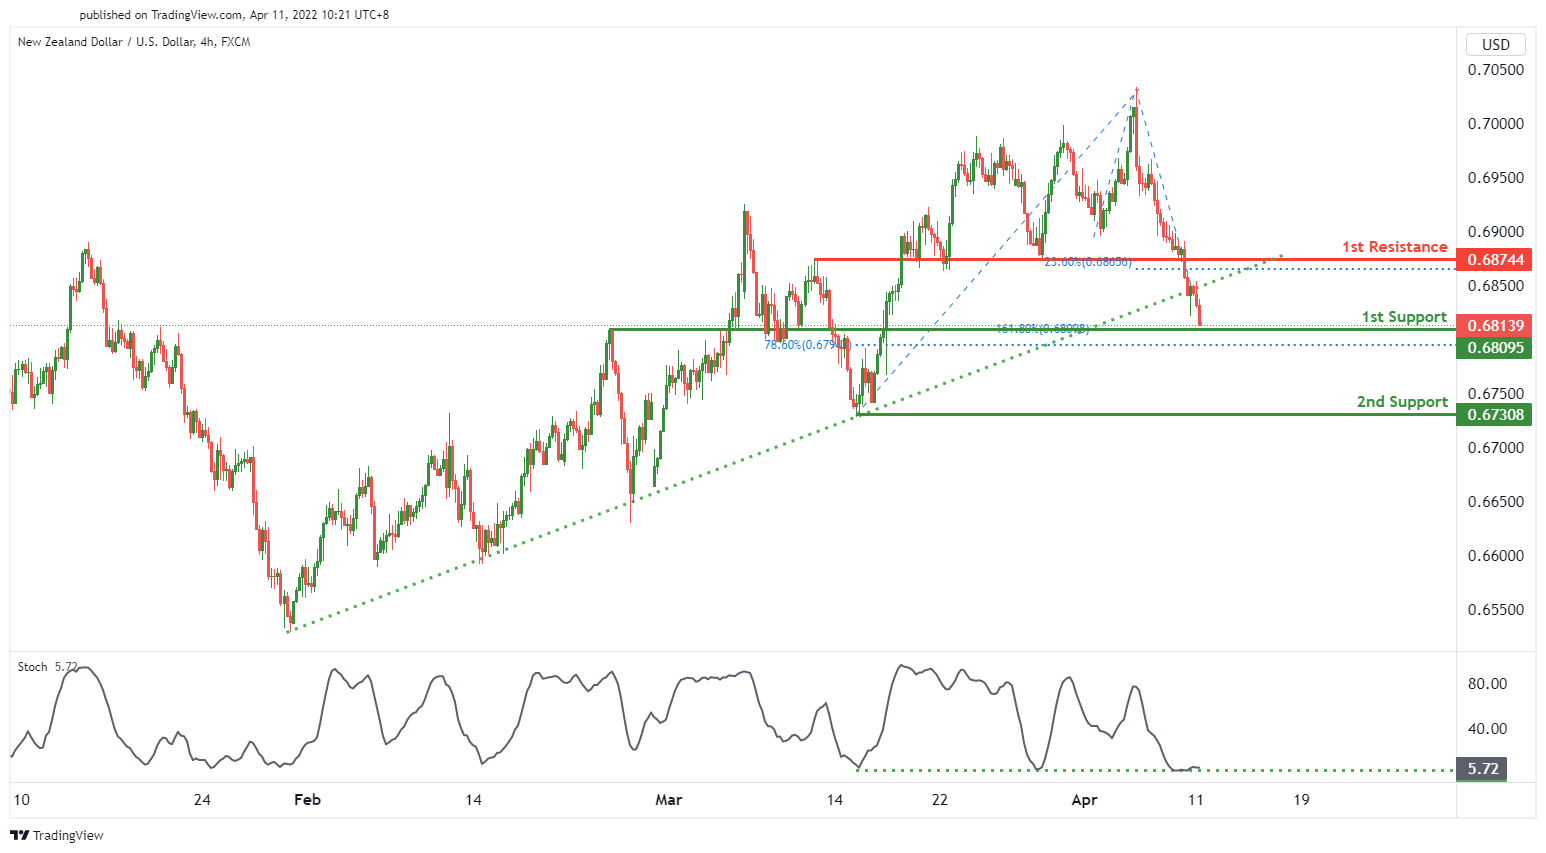
NZD/USD:
On the H4, we expect to see a potential for a bullish bounce from our 1st support of 0.68095 in line with the 78.6% fibonacci retracement and 161.8% Fibonacci extension towards our 1st resistance level at 0.68744 in line with the 23.6% Fibonacci retracement. Our bullish bias is supported by the stochastic indicator where price is at support level. Alternatively, If price breaks out, it can potentially move towards our 2nd support level at 0.67308 which is in line with the swing low support.
Areas of consideration:
- H4 time frame, 1st support at 0.68095
- H4 time frame, 1st resistance at 0.68744
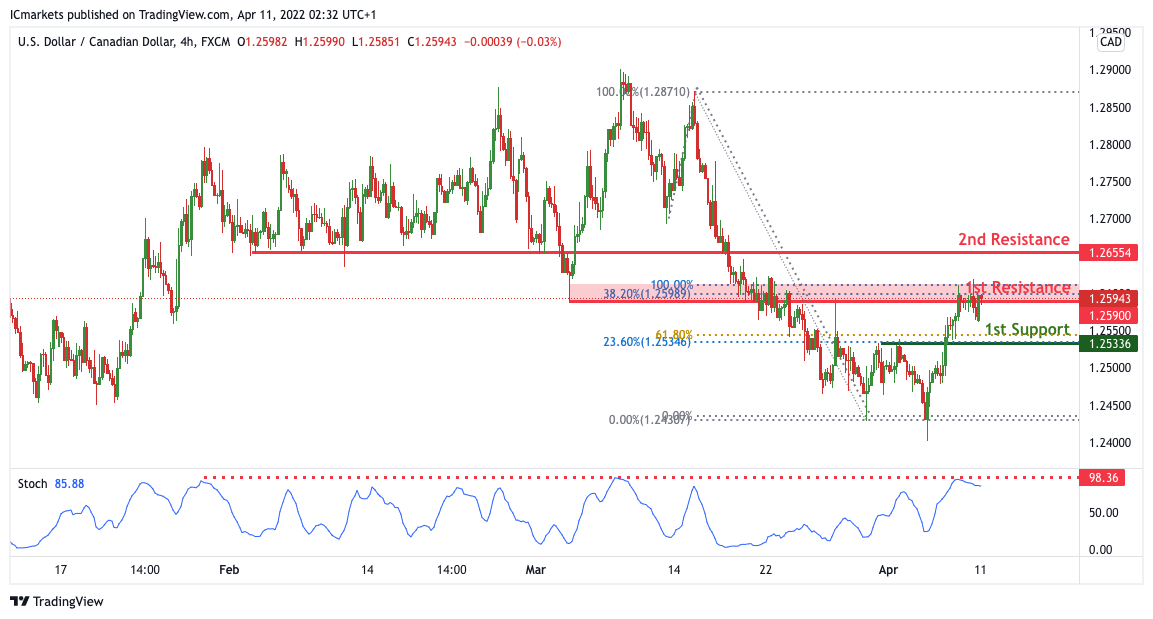
USD/CAD:
On the H4, with price expected to reverse off the stochastic indicator, we expect to see a potential for bearish drop from our 1st resistance of 1.25943 in line with the 38.2% fibonacci retracement and 100% Fibonacci projection towards our 1st support level at 1.25336 in line with 23.6% Fibonacci retracement and 61.8% Fibonacci retracement. Alternatively, If price breaks out, it can potentially move towards our 2nd resistance level at 1.26554 which is in line with the pullback support.
Areas of consideration:
- H4 time frame, 1st support at 1.25336
- H4 time frame, 1st resistance at 1.25811
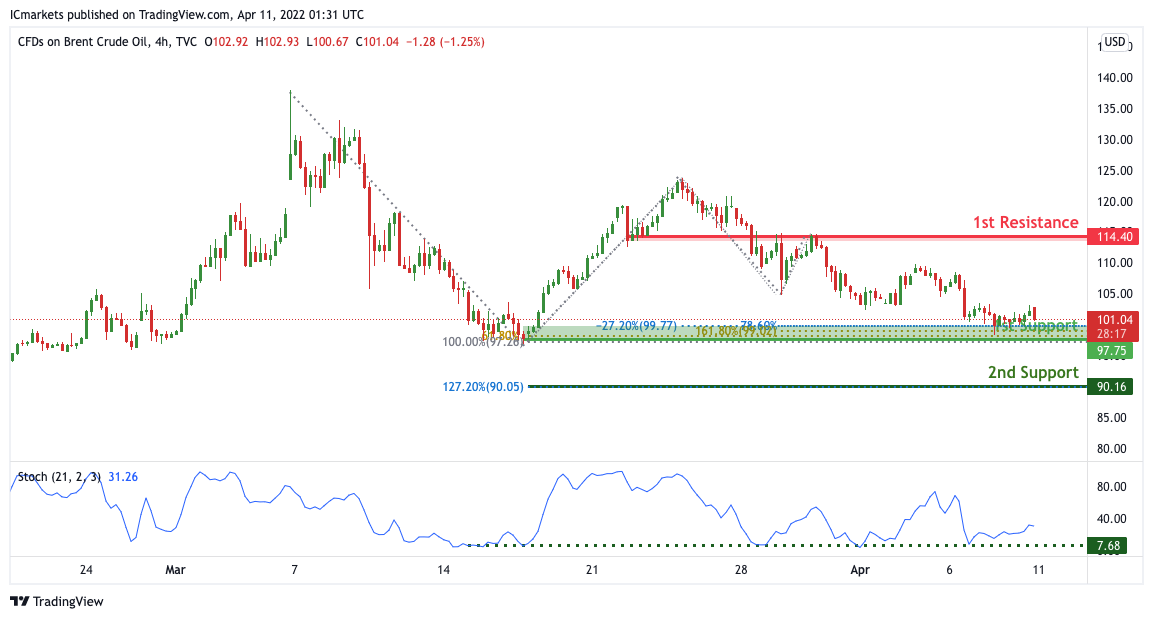
OIL:
On the H4, with price expected to bounce off the support of the stochastics indicator, we have a bias that price will rise to our 1st resistance at 114.40 in line with the horizontal pullback resistance from our 1st support at 97.75 in line with the horizontal pullback support, 78.6% Fibonacci projection, 161.8% Fibonacci extension and -27.2% Fibonacci expansion. Alternatively, price may break 1st support structure and head for 2nd support at 90.16 in line with the 127.2% Fibonacci extension
Areas of consideration:
- H4 time frame, 1st resistance of 114.40
- H4 time frame, 1st support of 97.75
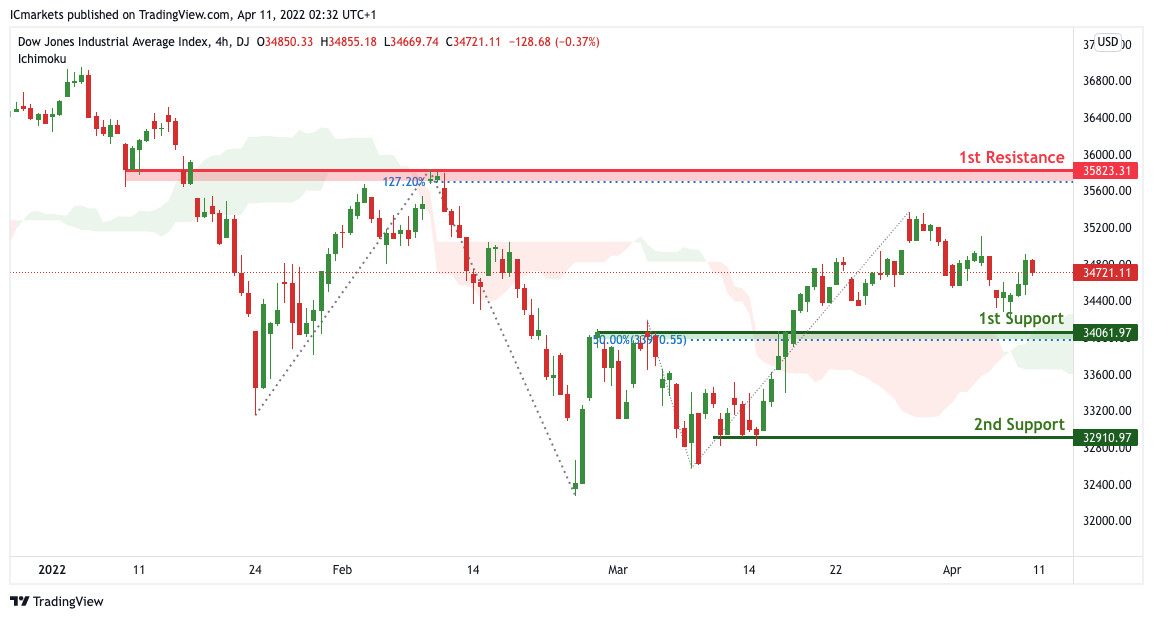
Dow Jones Industrial Average:
On the H4, with price moving above the ichimoku cloud, we have a bias that price will rise to our 1st resistance at 35823 in line with the 127.2% Fibonacci extension from our 1st support at 34061 in line with the horizontal pullback support and 50% Fibonacci retracement. Alternatively, price may break 1st support structure and head for 2nd support at 32910 in line with the horizontal swing low support.
Areas of consideration :
- H4 1st support at 34569
- H4 1st resistance at 35823


