
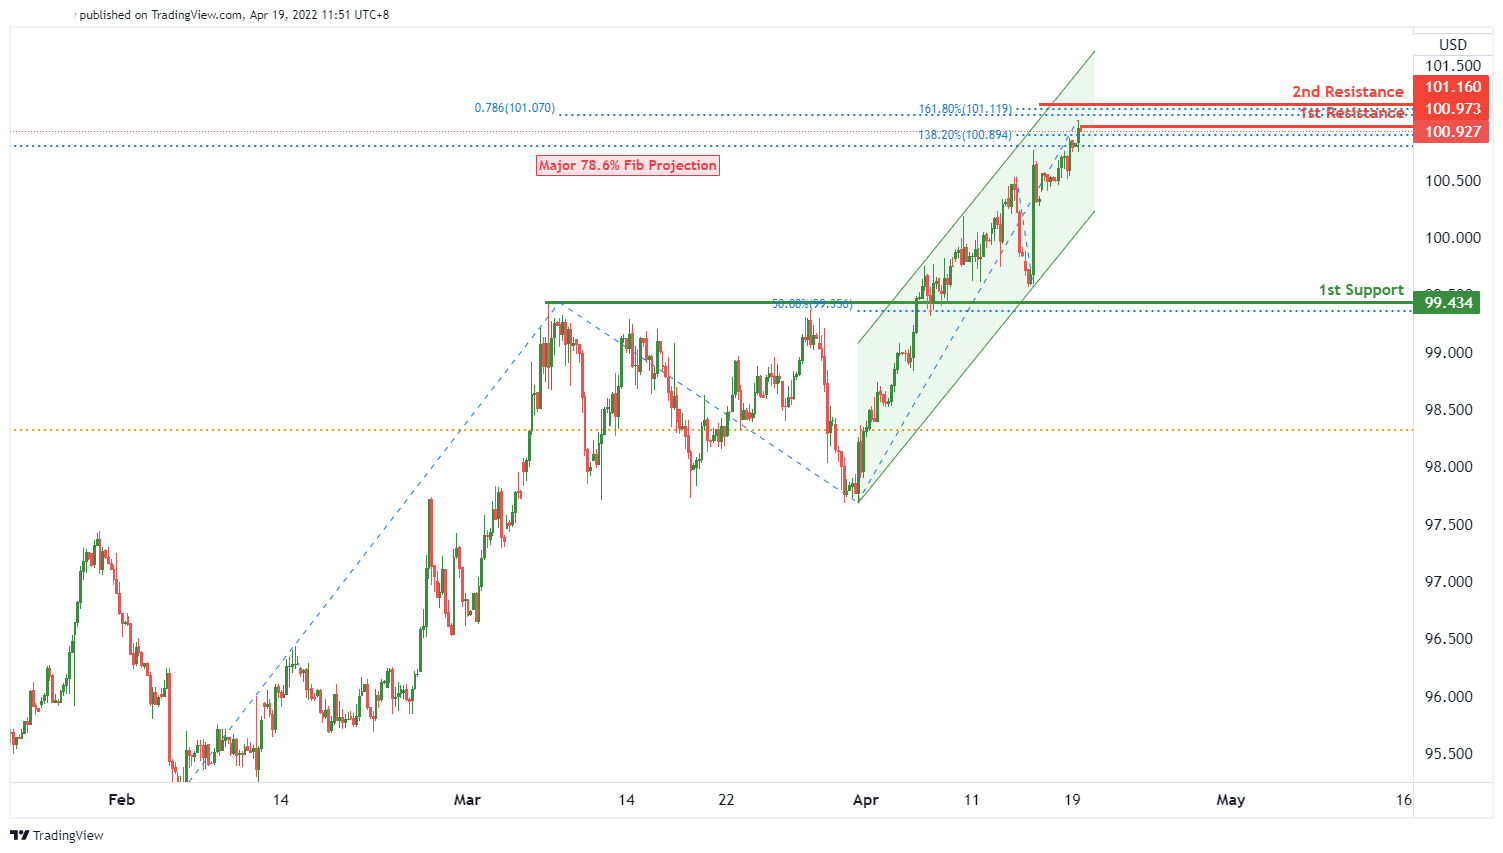
DXY:
We see a potential for bearish dip from 1st resistance level of 100.973 in line with 138.2% Fibonacci extension and 78.6% Fibonacci projection towards the 1st support level of 99.434 in line with 50% Fibonacci retracement, along with a graphical pullback support. Alternatively, price might continue to rise to 2nd resistance level of 101.160 in line with 161.8% Fibonacci extension and 78.6% Fibonacci projection.
Areas of consideration:
- H4 time frame, 1st resistance at 100.973
- H4 time frame, 2nd resistance at 101.160
- H4 time frame, 1st support at 99.434
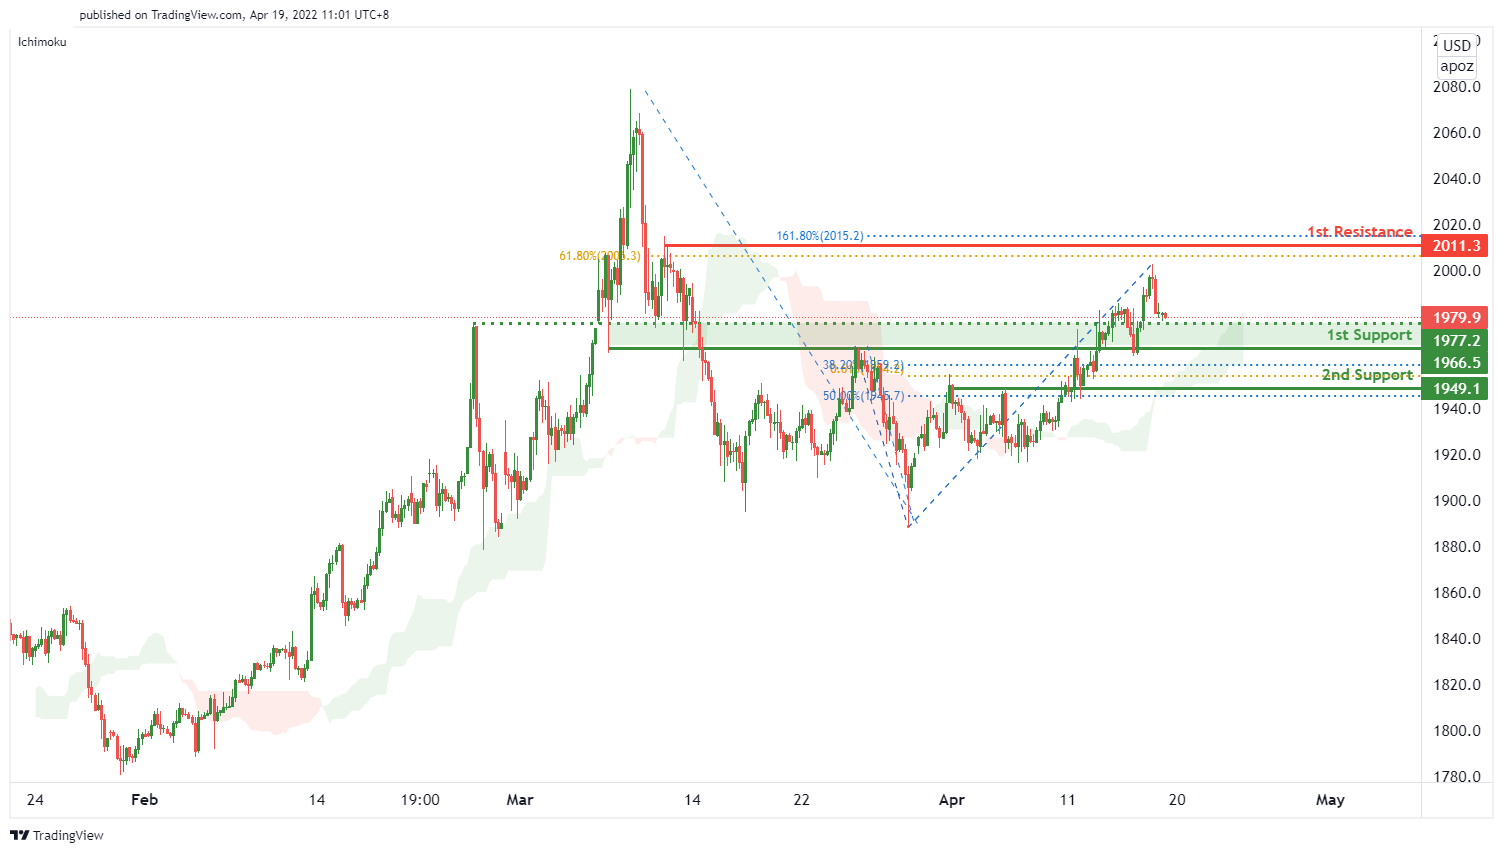
XAU/USD (GOLD):
We expect price to be on a bullish bounce from 1st support level of 1966.5 in line with 38.2% Fibonacci retracement and 61.8% Fibonacci projection, along with a graphical pullback support towards the 1st resistance level of 2011.3 in line with 161.8% Fibonacci extension and 61.8% Fibonacci retracement. Our bullish bias is further supported by the Ichimoku cloud indicator. Alternatively, price might break through the key support level and move down to the 2nd support level of 1949.1 in line with 50% Fibonacci retracement and a graphical pullback support.
Areas of consideration:
- H4 time frame, 1st Resistance at 2011.3
- H4 time frame, 1st Support at 1966.5
- H4 time frame, 2nd Support at 1949.1
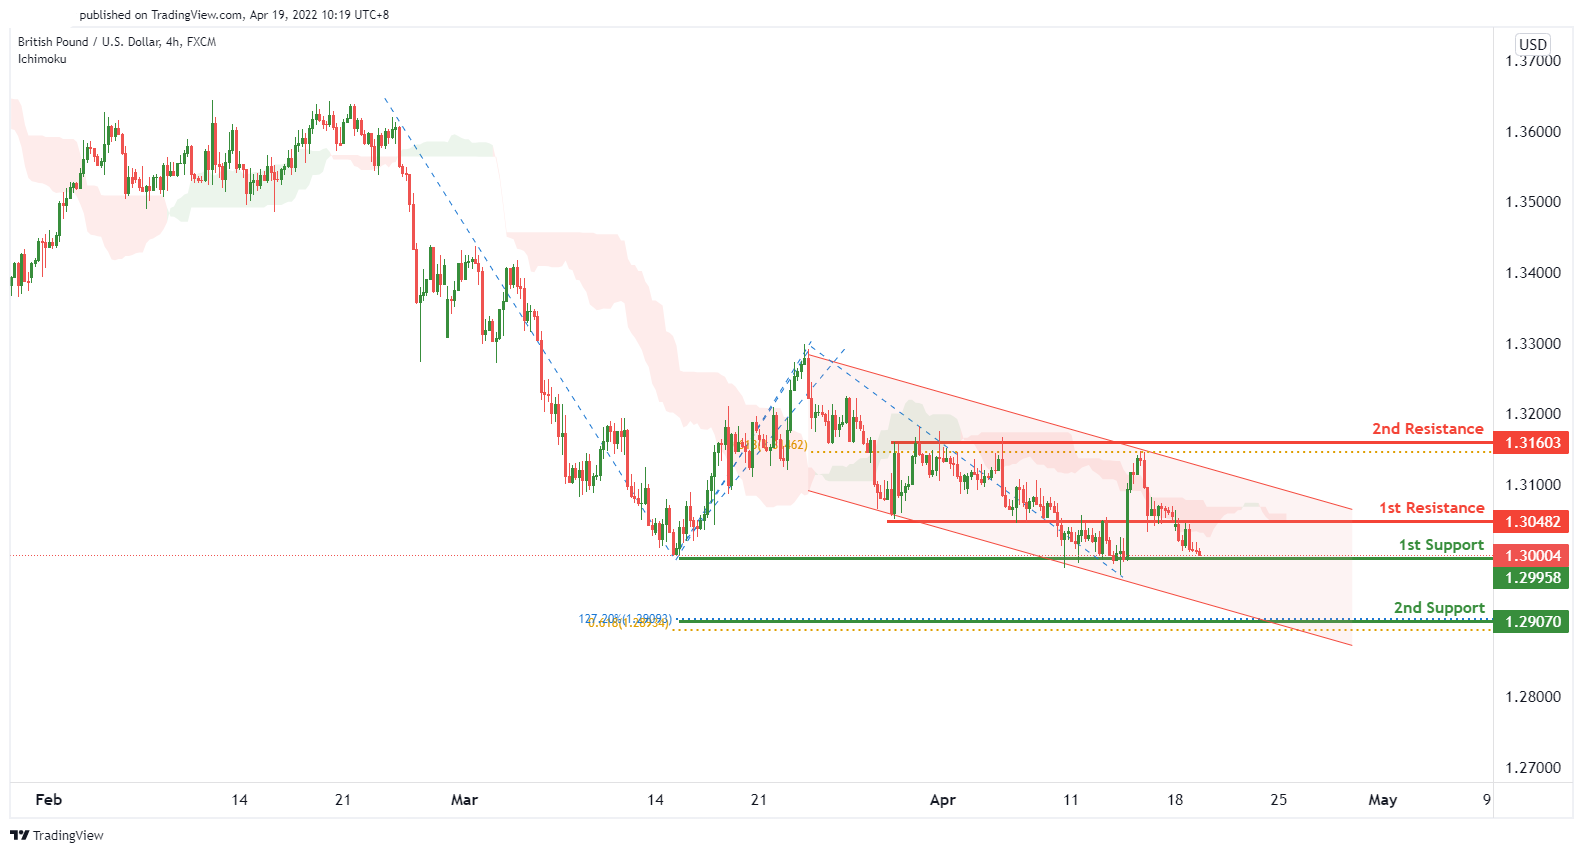
GBP/USD:
On the H4 timeframe, we expect to see a potential for bullish bounce from 1st support level of 1.29958 in line with previous graphical swing low support towards the 2nd resistance level of 1.31603 in line with 61.8% Fibonacci projection. Alternatively, price might break through key support level as ichimoku cloud indicator shows that breaking 1st support level would trigger price to move down to 2nd support level of 1.29070 which lines up with 61.8% Fibonacci projection and 127.2% Fibonacci extension.
Areas of consideration:
- H4 1st resistance at 1.30482
- H4 2nd resistance at 1.31603
- H4 1st support at 1.29958
- H4 2nd support level at 1.29070
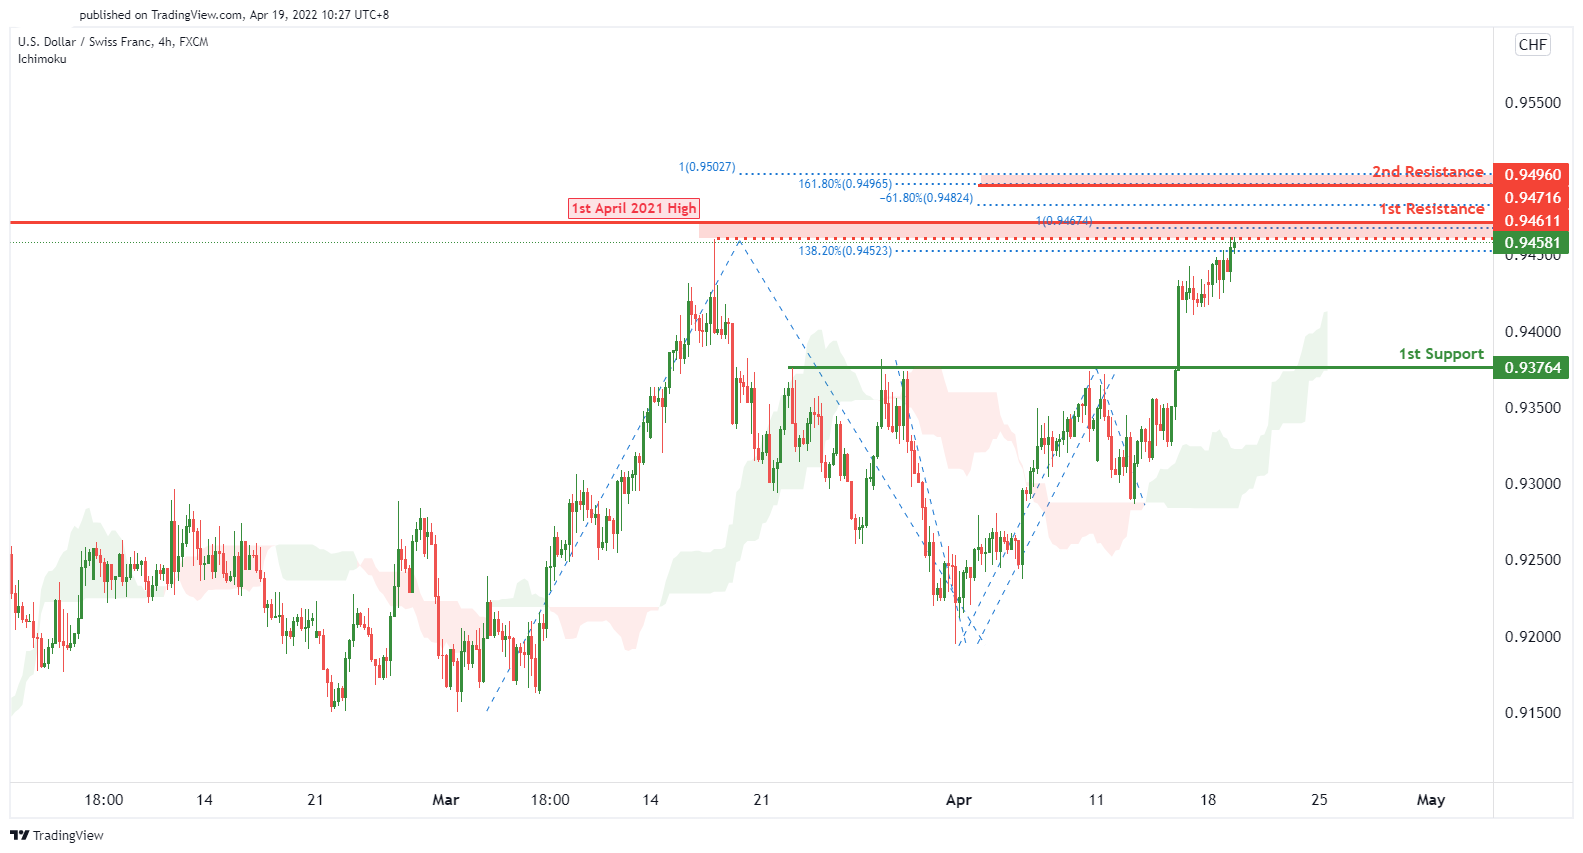
USD/CHF:
On the H4, we see the potential for bearish reversal from our 1st resistance at 0.94716 in line with 100% FIbonacci projection and 138.2% Fibonacci extension towards our 1st support at 0.93764 which is in line with a graphical pullback support. Alternatively, price might break through the key resistance level and head towards the 2nd resistance level of 0.94960 which lines up with 161.8% Fibonacci extension, 100% Fibonacci projection and -61.8% Fibonacci expansion.
Areas of consideration
- 1st support level at 0.93764
- 1st resistance level at 0.94716
- 2nd resistance level at 0.94960
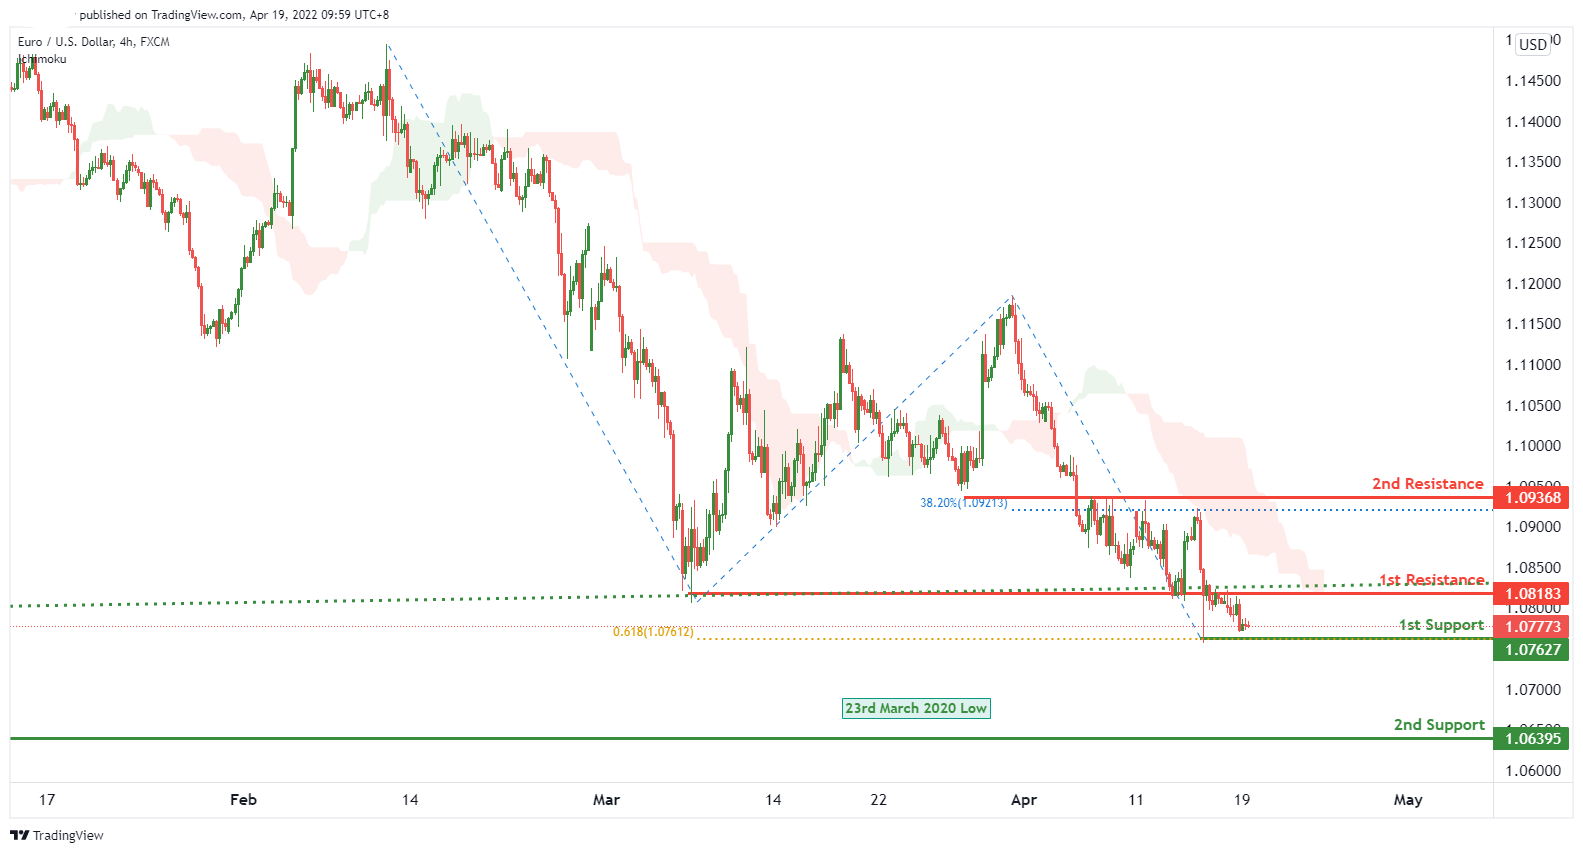
EUR/USD :
On the H4 timeframe, price is near a key pivot. We see the potential for a bullish bounce from our 1st support level of 1.07627 in line with 61.8% Fibonacci projection towards our 2nd resistance level of 1.0938 in line with 38.2% Fibonacci retracement. Alternatively, price might break through key support level as ichimoku cloud indicator shows that breaking 1st support level would trigger price to move down to 2nd support level of 1.06395 which is a horizontal swing low and also shown price stretches back to March 2020 low.
Areas of consideration :
- H4 1st resistance at 1.08183
- H4 2nd resistance at 1.09368
- H4 1st support at 1.07627
- H4 2nd support at 1.06395
USD/JPY:
We expect price to have a bearish reversal from 1st resistance level of 127.790 in line with 161.8% fibonacci extension towards the 1st support level of 125.072 in line with graphical pullback support. Our bearish bias is further supported by bearish divergence and RSI signalling that there is a high probability that price might reverse.
Areas of consideration:
- H4 time frame, 1st resistance at 127.790
- H4 time frame, 1st support at 125.072
- H4 time frame, 2nd support at 123.453

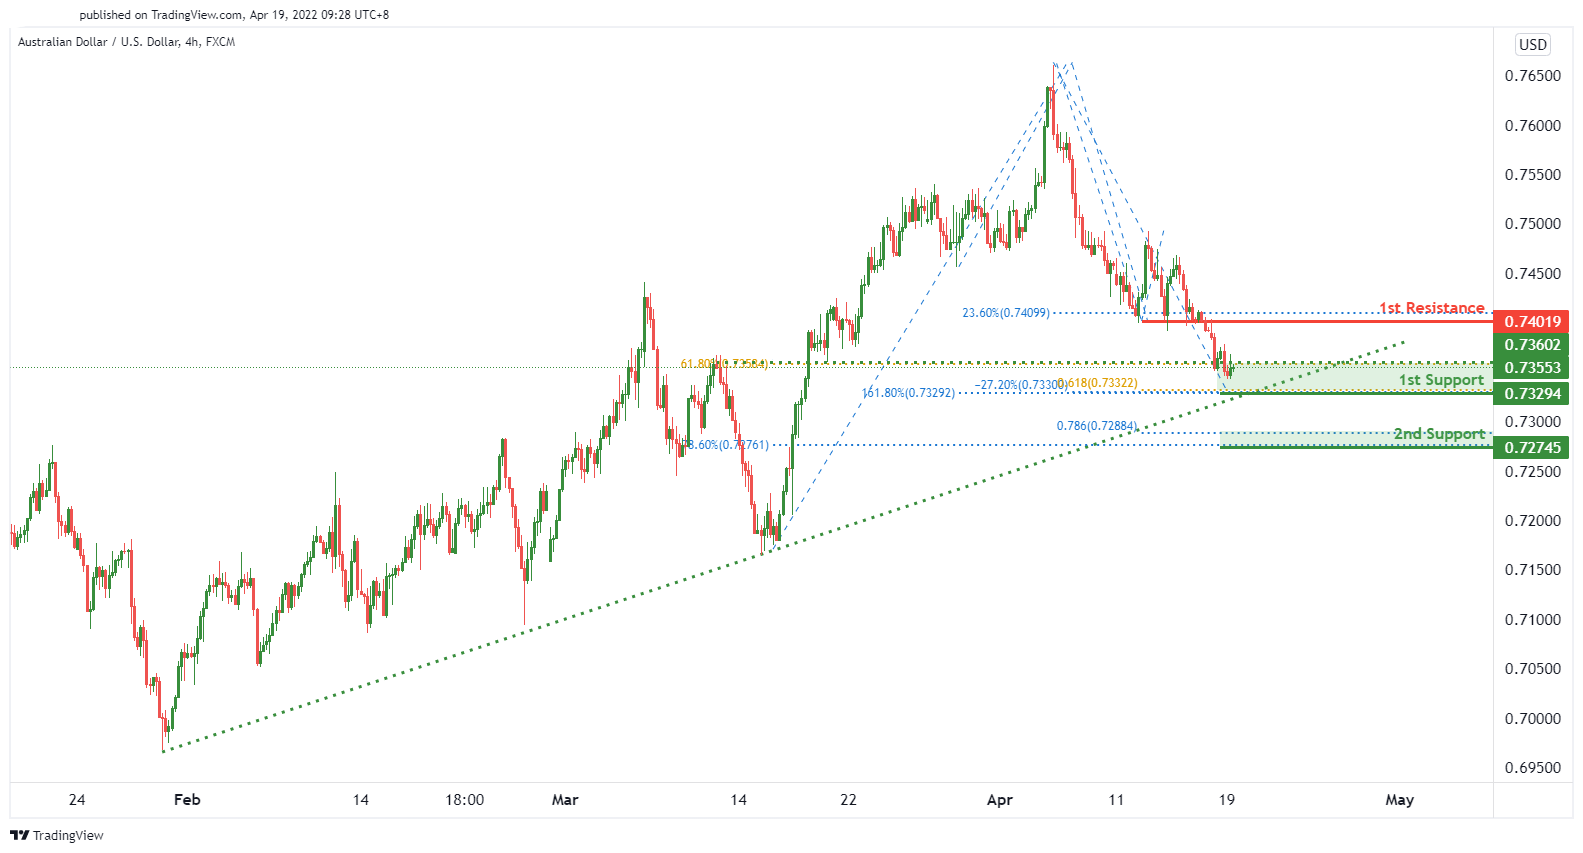
AUD/USD:
On the H4 timeframe, we see the potential for a bullish bounce from our 1st support level at 0.73294 in line with 61.8% Fibonacci retracement, 161.8% Fibonacci extension and -27.2% expansion towards our 1st resistance level at 0.74019 in line with 23.6% Fibonacci retracement. Alternatively, price might break through the key support level and continue to dip to 2nd support level of 0.72745 in line with 78.6% Fibonacci retracement and 78.6% Fibonacci projection.
Areas of consideration
- H4 1st resistance at 0.74019
- H4 1st support at 0.73294
- H4 2nd support at 0.72745
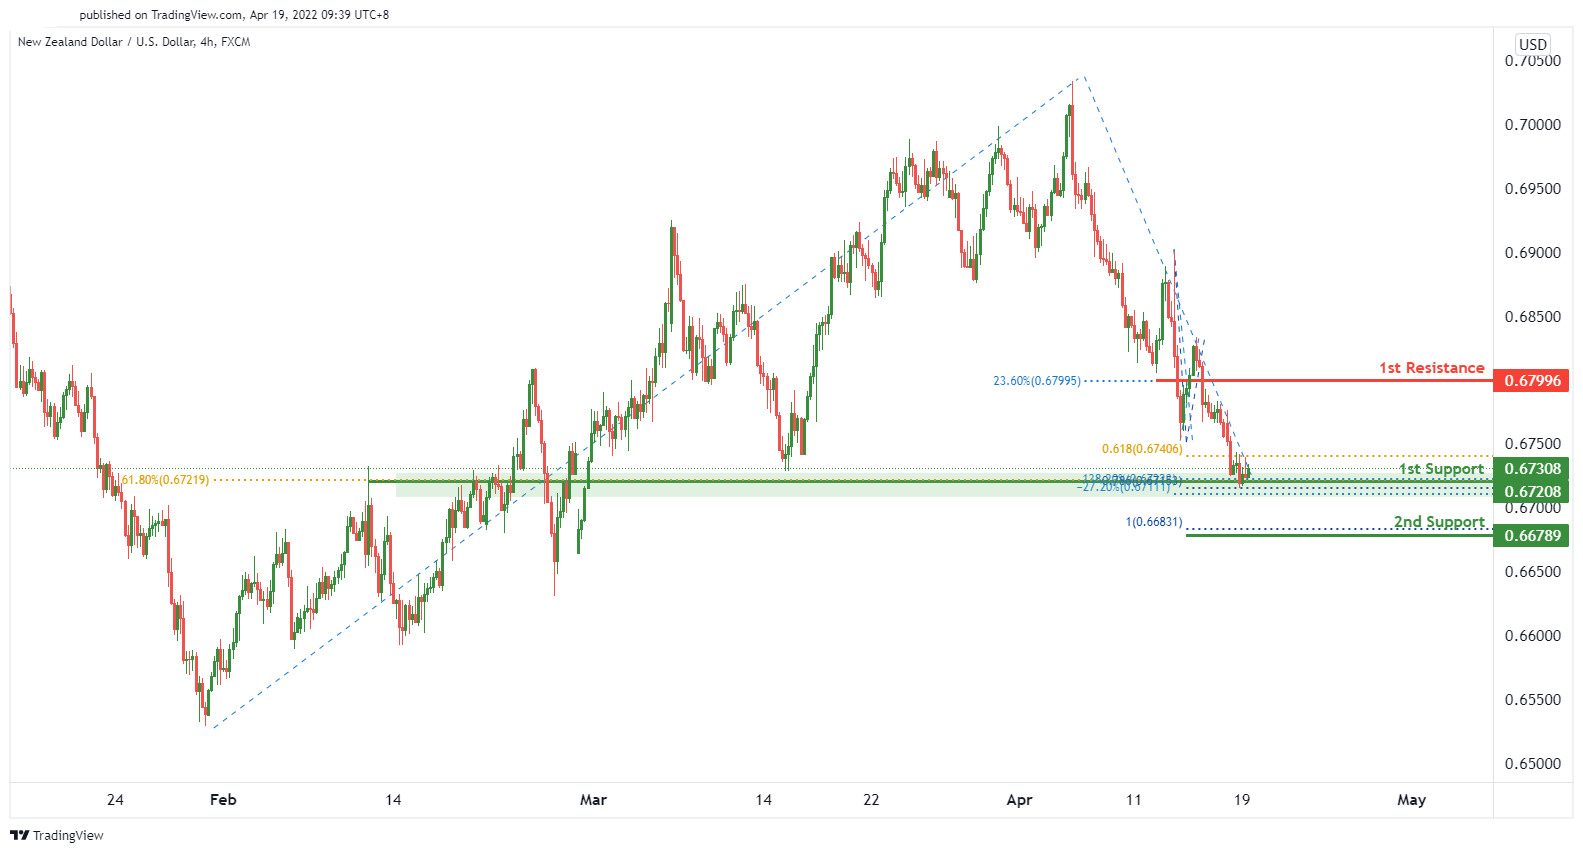
NZD/USD:
On the H4, we expect to see a potential for a bullish bounce from our 1st support level of 0.67208 in line with 78.6% Fibonacci projection, -27.2% Fibonacci expansion and 138.2% Fibonacci extension towards our 1st resistance level of 0.68078 in line with 23.6% Fibonacci retracement. Alternatively, price might continue to dip to 2nd support level of 0.66789 in line with 100% Fibonacci projection.
Areas of consideration:
- H4 time frame, 1st support at 0.67208
- H4 time frame, 2nd support at 0.66789
- H4 time frame, 1st resistance at 0.68078
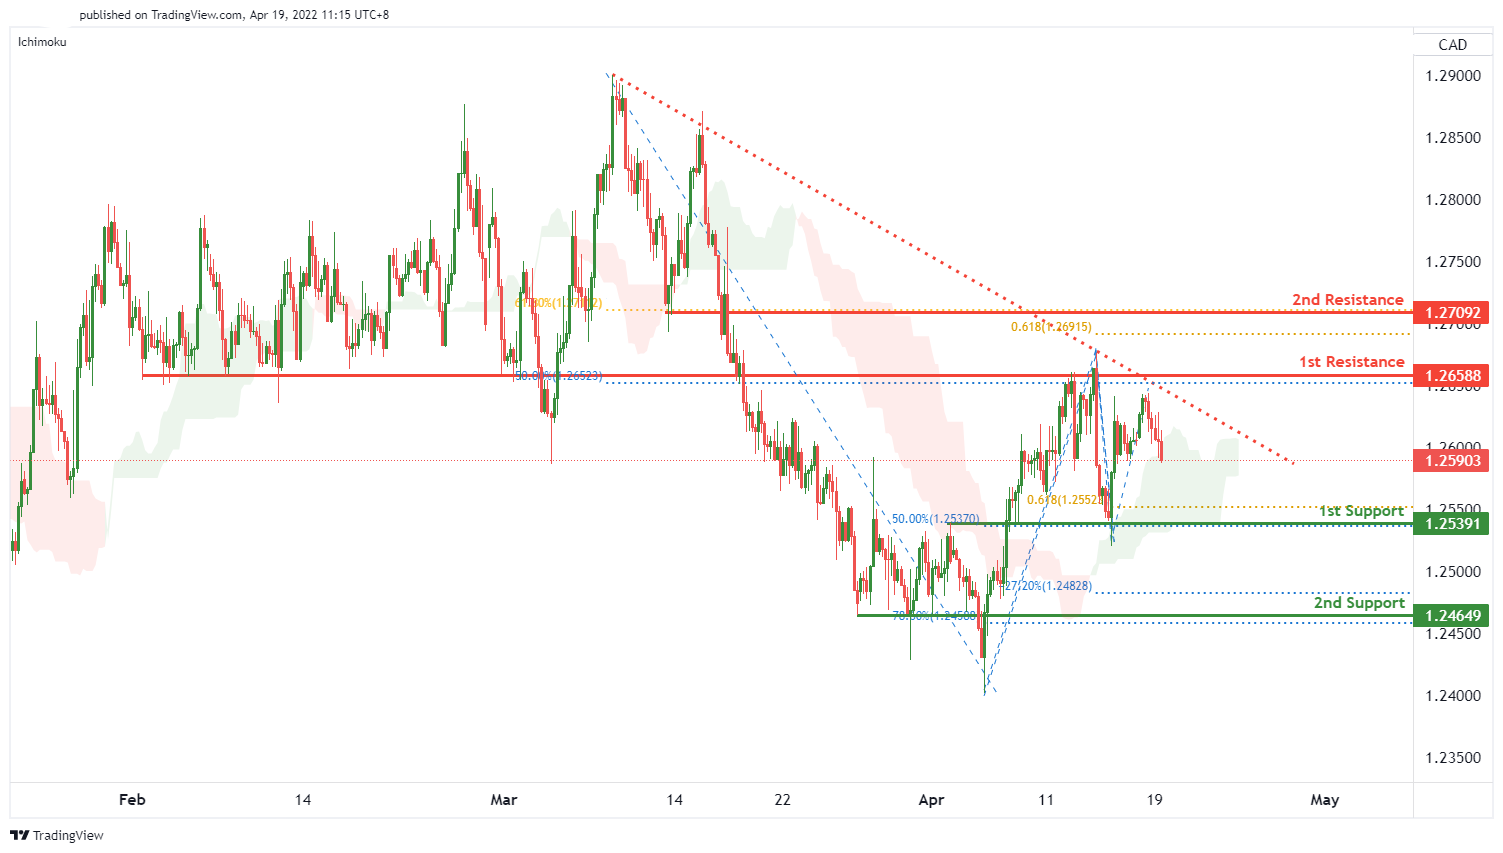
USD/CAD:
We are expecting a bullish bounce to occur from 1st support level of 1.25391 in line with 50% Fibonacci retracement and 61.8% Fibonacci projection towards the 1st resistance level of 1.26588 in line with 50% Fibonacci retracement. Our bullish bias is further supported by price trading above ichimoku cloud. Alternatively, price might break through the key support level and move down to the 2nd support level of 1.24649 in line with 78.6% Fibonacci retracement and -27.2% Fibonacci expansion.
Areas of consideration:
- H4 time frame, 1st resistance at 1.27092
- H4 time frame, 2nd resistance at 1.27092
- H4 time frame, 1st support at 1.25391
- H4 time frame, 2nd support at 1.24649
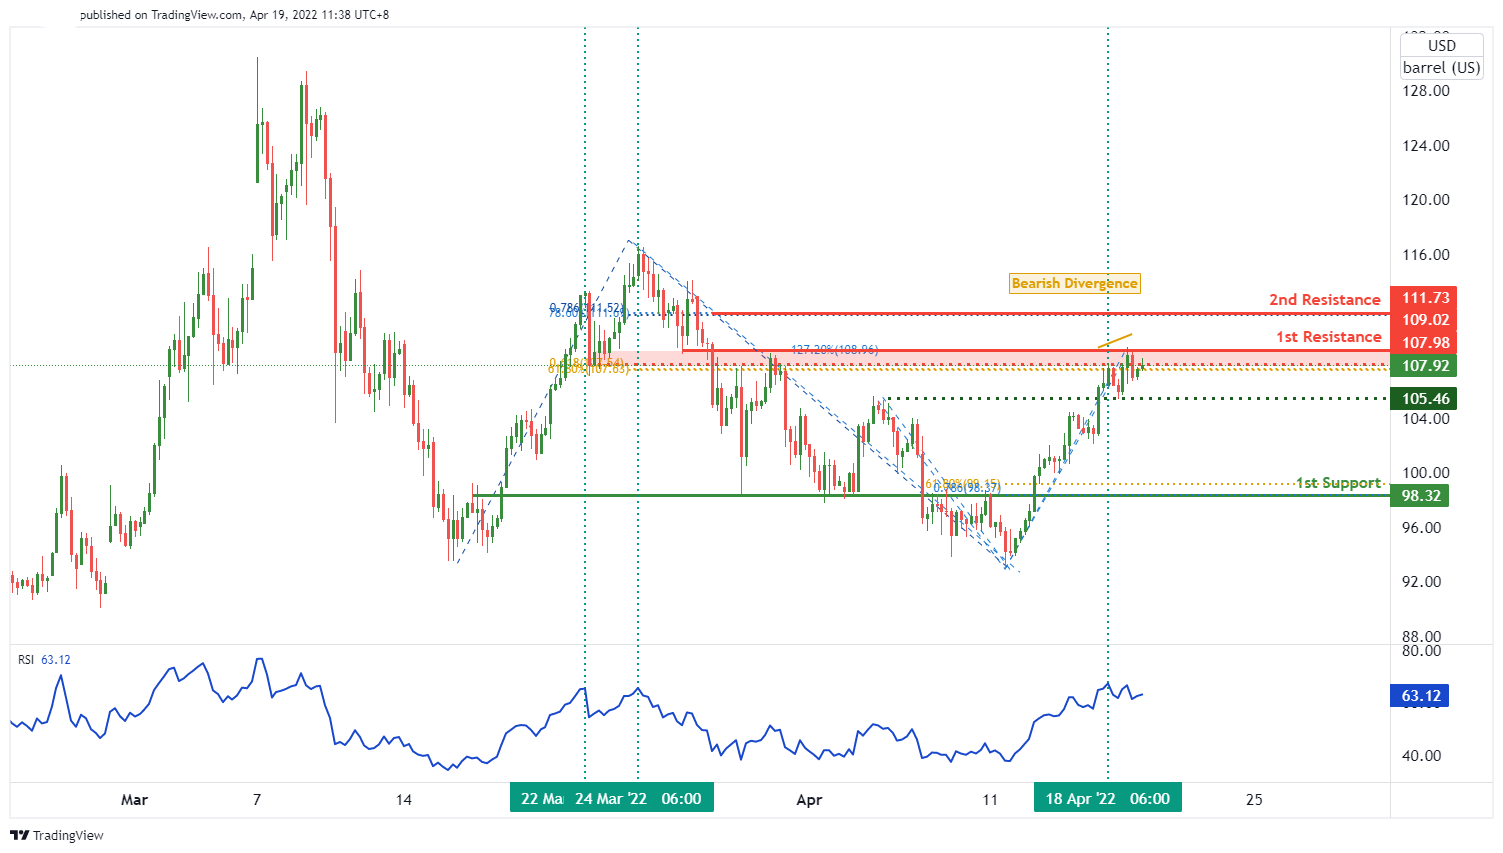
OIL:
Price is near to the pivot level. We can see a potential for a bearish reversal from 1st resistance level of 109.02 lines up with 61.8% Fibonacci retracement, 127.2% Fibonacci extension and 61.8% Fibonacci projection towards the 1st support level of 98.32 lines up with 61.8% retracement and 78.6% Fibonacci projection. Our bearish bias is further supported by bearish divergence and RSI showing how price is going to reverse. Alternatively, price might break the key resistance level and continue to rise to the 2nd resistance level of 111.73 in line with 78.6% Fibonacci retracement and 78.6% Fibonacci projection.
Areas of consideration:
- H4 time frame, 1st resistance of 109.02
- H4 time frame, 2nd resistance of 111.73
- H4 time frame, 1st support of 98.32
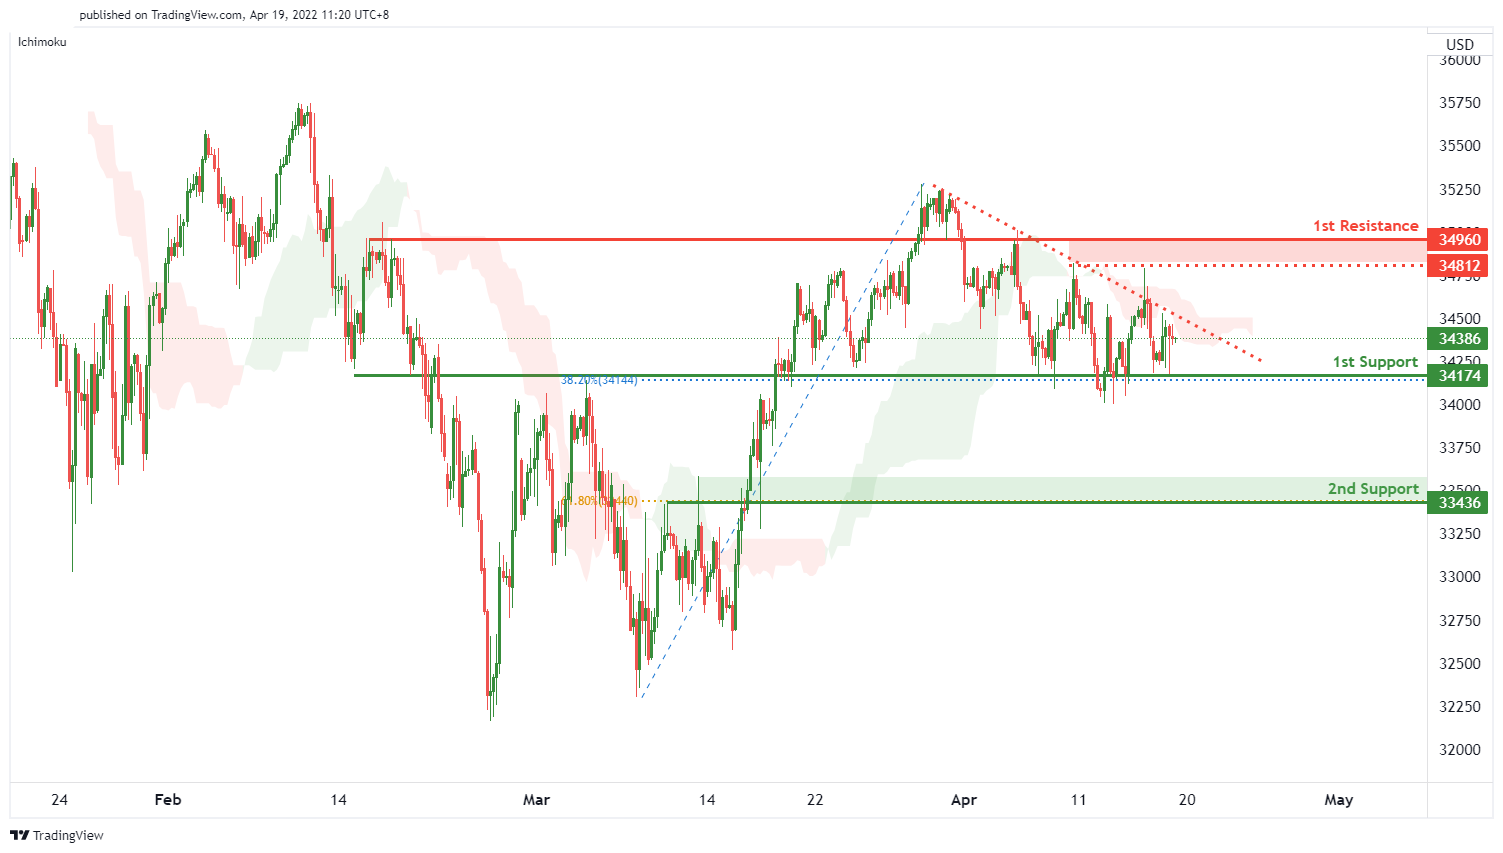
Dow Jones Industrial Average:
Price is near to the pivot level. We can see a potential for a bullish momentum from 1st support level of 34174 lines up with 38.2% fibonacci retracement, along with a pullback support towards the 1st resistance level of 34960 lines up with previous graphical swing high resistance. Alternatively, price might break key support level and drop towards the 2nd support level of 33436 in line with 61.87% Fibonacci retracement.
Areas of consideration :
- H4 time frame, 1st resistance at 34960
- H4 time frame, 1st support at 34174
- H4 time frame, 2nd support at 33436


