
In this blog, we will look at the strong rally in NZDJPY which took place this year, talk about the sequence, what it means for the pair and also what our trading strategy is going forward. We will look at a sequence chart and also a chart showing the extreme area down from April 20, 2022 peak and highlight the next extreme area where we can see buyers entering the market to resume the rally or produce 3 waves reaction higher at least.
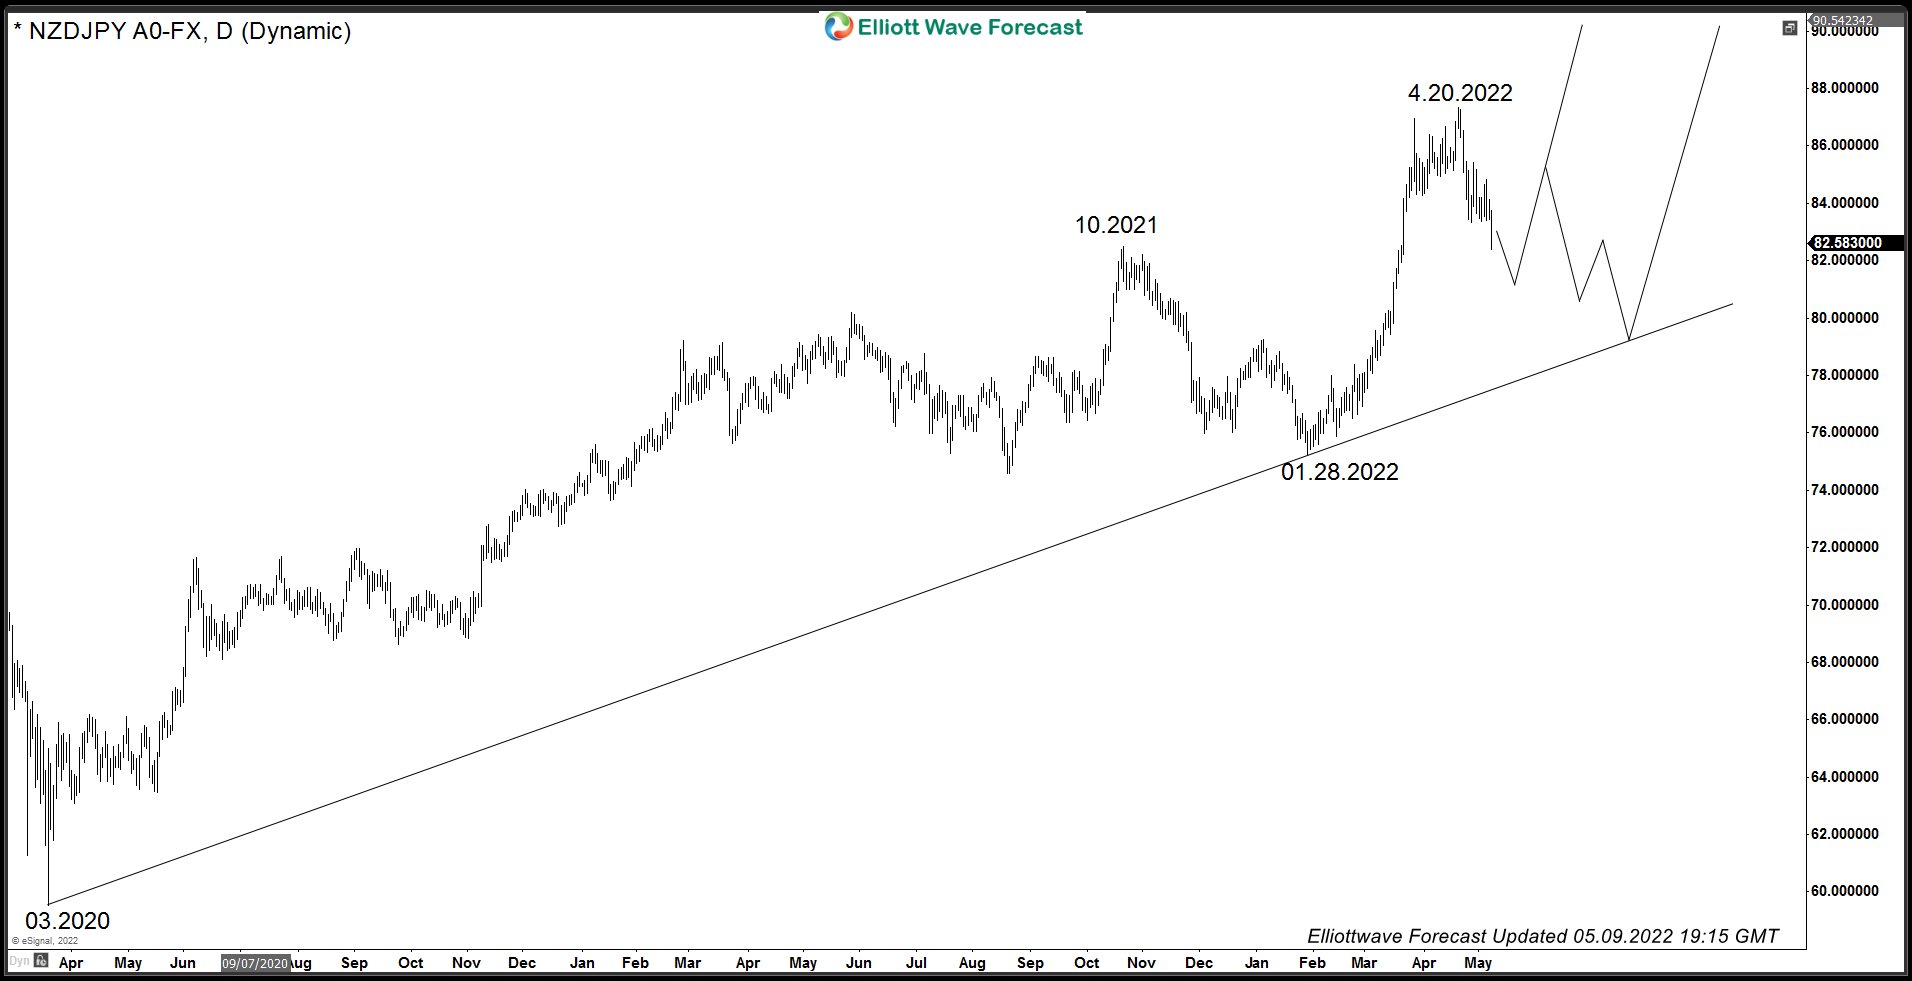
NZDJPY Bullish Sequence Since January 28, 2022 Low
Chart below shows NZDJPY ended a cycle from 03.2020 low at 10.2021 peak. This rally was in 5 waves as we can see a clear impulsive advance. This was followed by a 3 waves pull back which ended at 01.28.2022 low. Then pair resumed the rally and went on to make a new high above 10.2021 peak. Break above 10.2021 peak created an incomplete bullish sequence and opened extension higher. Sequence is bullish against 01.28.2022 low and as dips hold above this level, expect buyers to remain in control and appear in the dips in 3, 7 or 11 swings. While above 01.28.2022 low, next target area remains to be 98.31 – 103.74.
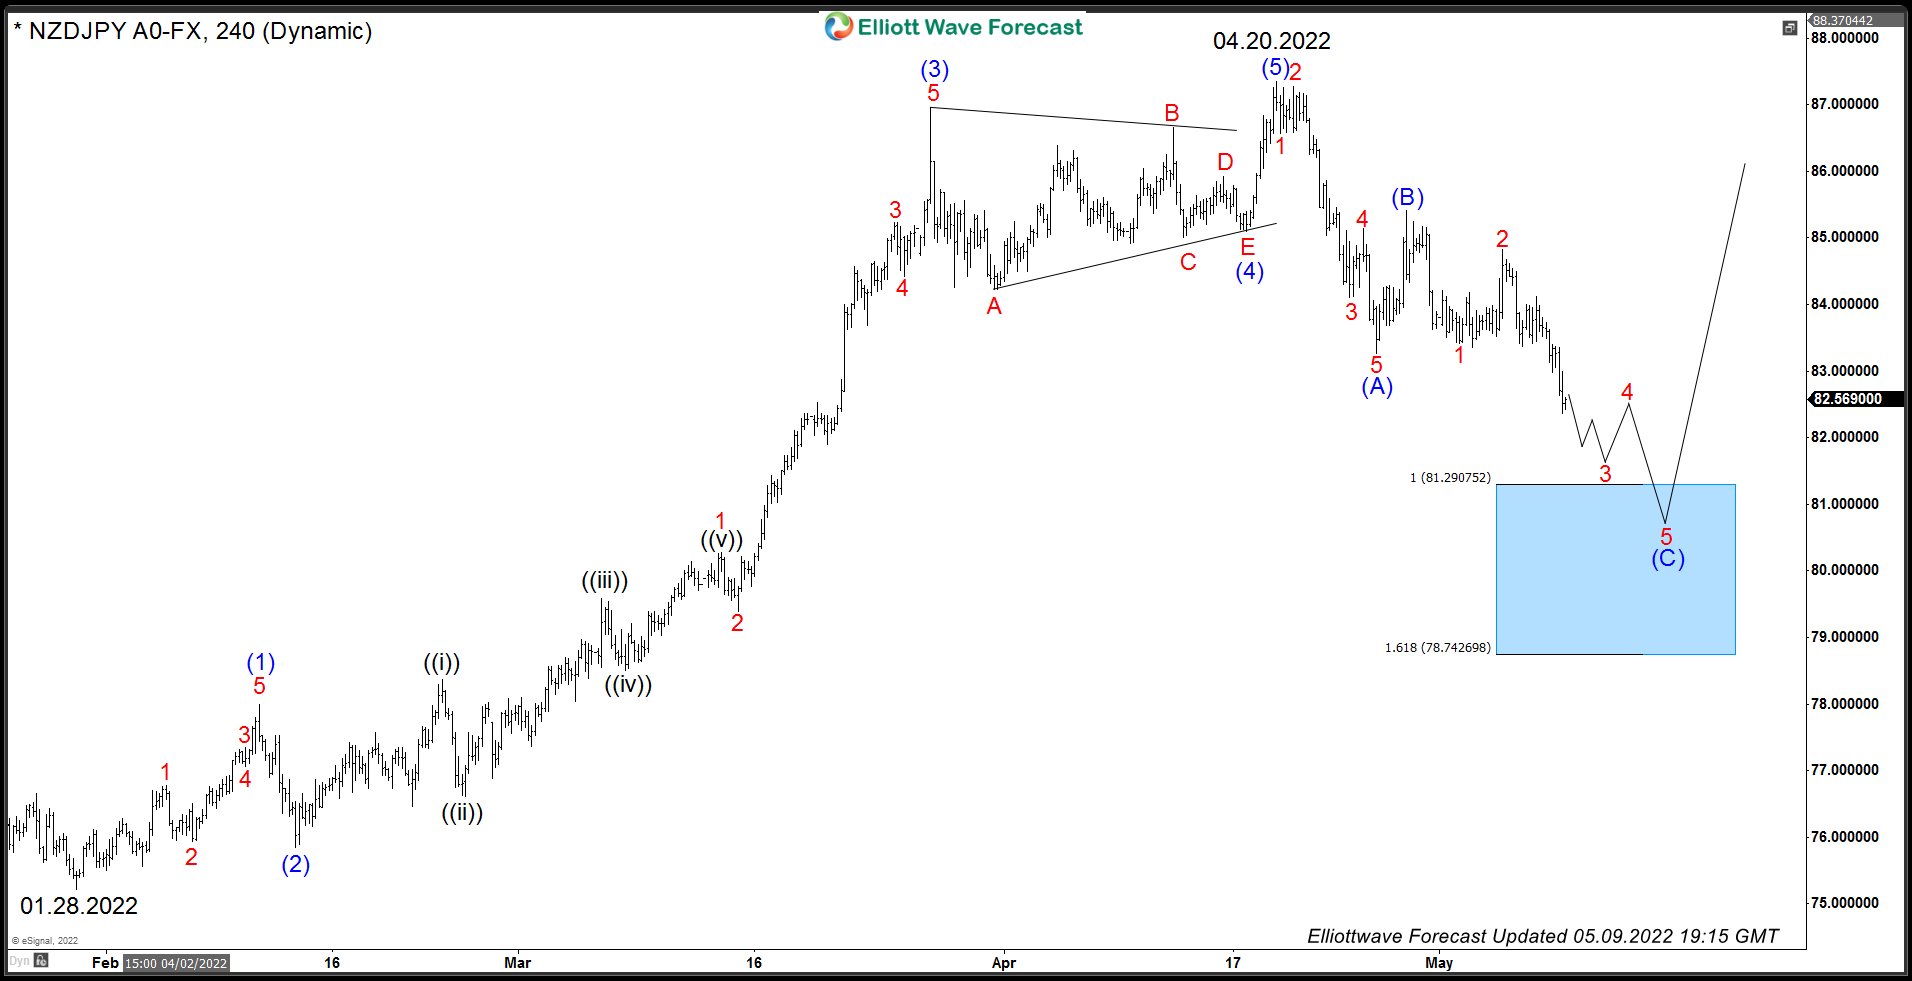
NZDJPY: Elliott Wave Structure Down from April 20, 2022 Peak
Decline from 04.20.2022 peak is unfolding as a Zigzag Elliott wave structure which is a 5-3-5 structure. In this structure, wave A is in 5 waves, wave B is in 3 waves and wave C is also in 5 waves. Wave B could be any corrective structure. We can see a clear 5 waves decline from 04.20.2022 peak to 04.26.2022 low which we have labelled as wave (A). This was followed by 3 waves bounce to 04.28.2022 peak and now pair has broken below 04.26.2022 low which creates a short-term incomplete bearish sequence. As bounces fail below 05.04.2022 (84.82) and more importantly below 04.28.2022 (85.00), expect more downside towards 81.29 – 78.74 where buyers should appear and resume the rally for next leg or produce 3 waves reaction higher at least. Alternative view is that bounce from the blue box will fail in 3 swings for another 3 swings extension lower to complete a double correction before higher again. Once the reaction from blue box reaches 50% Fibonacci retracement of the decline from 04.28.2022 (85.41), buyers from blue box should be able to eliminate risk on the trade and get into a risk free position and buy then buy again lower at next equal legs area in case of a larger double correction to the downside.


