
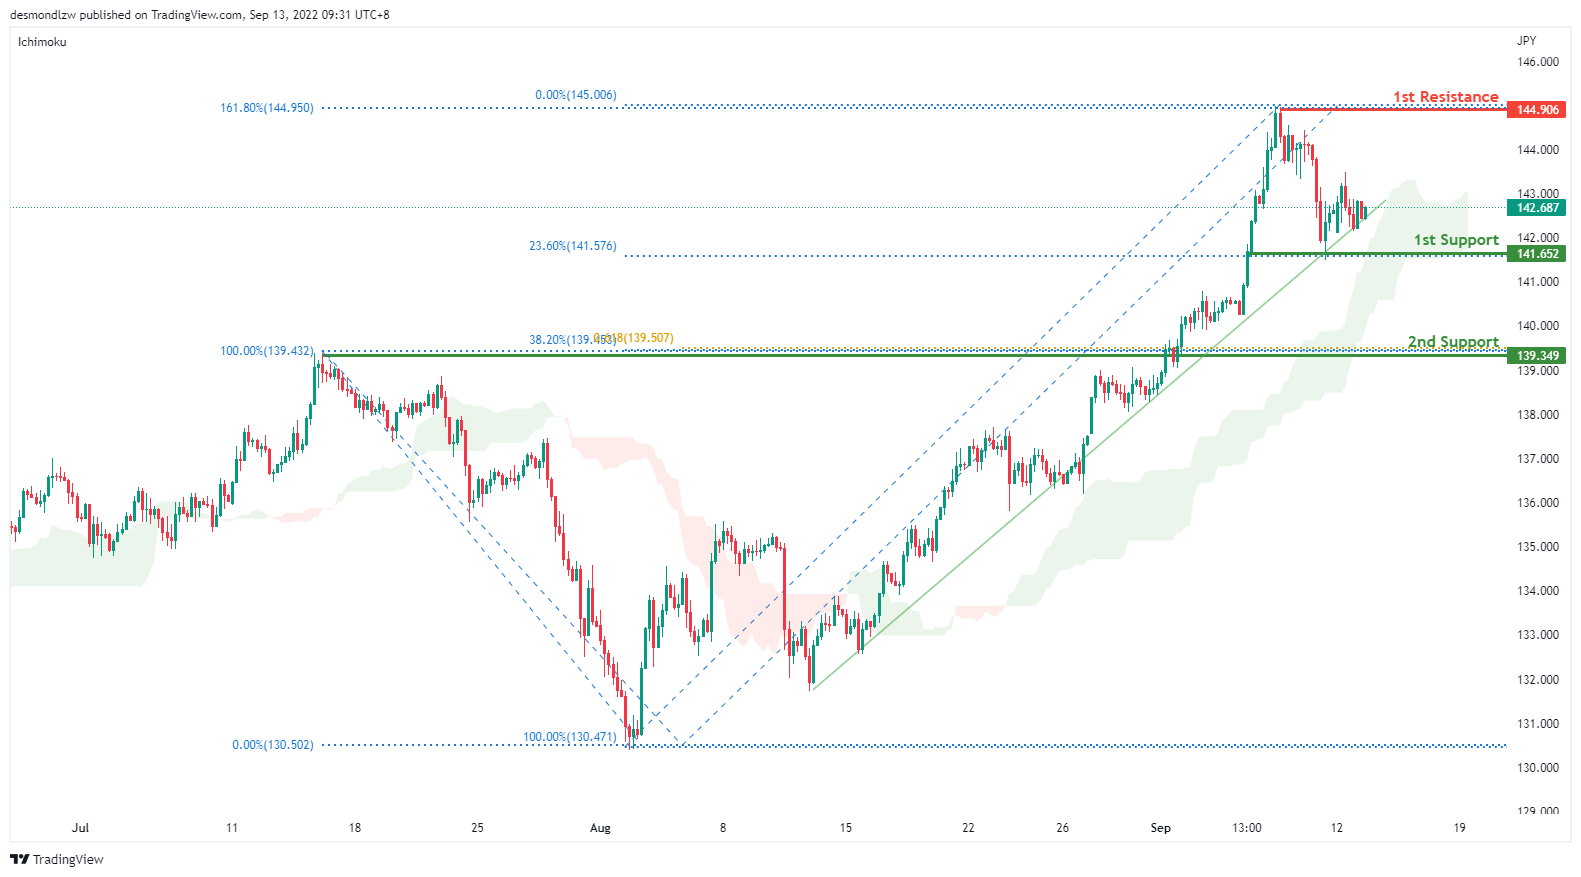
USD/JPY:
On the H4 chart, price is still respecting the ascending channel. We are still bullish bias- Price is currently testing along the trend line. If price continues with the bullish momentum, it should bring price to first resistance at 144.906 first where the 161.8% extension sits. Alternatively it could pull back to the first support at 141.652 where the 23.6% retracement sits then to the second support at 139.349 where the 38.2% retracement and overlapping support sits.
Areas of consideration:
- H4 time frame, 1st resistance at 144.906
- H4 time frame, 1st support at 141.652
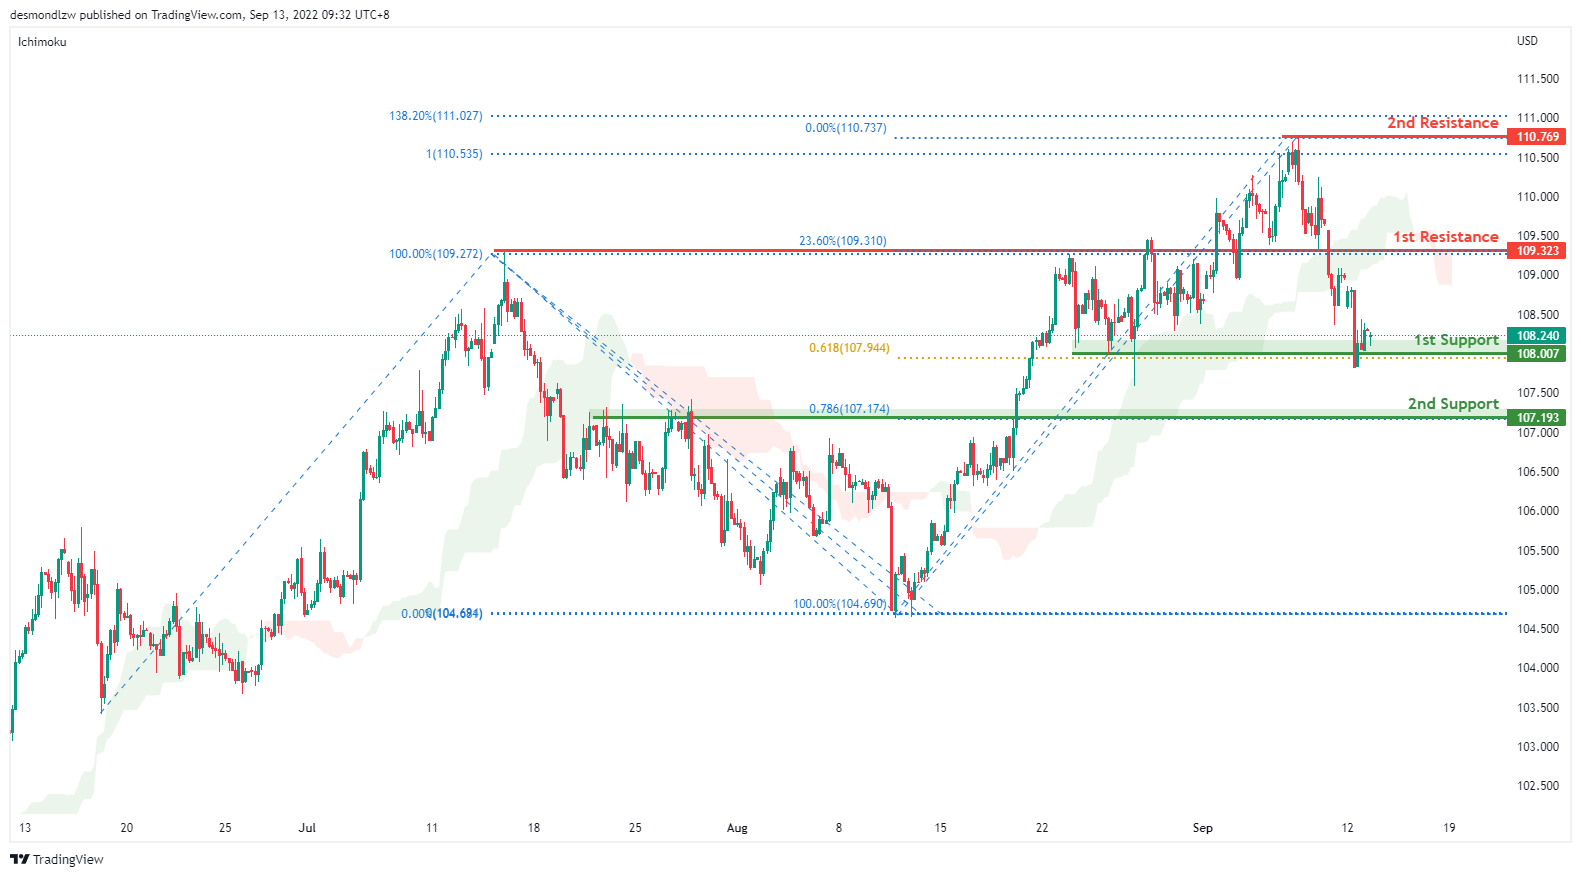
DXY:
On the H4, prices have broken the ascending trend, we are bearish bias. Price has pulled back and is testing the first support at 108.007 where the 61.8% projection and previous swing low sits. If bearish momentum continues, it should bring price to the second support at 107.193 where the 78.6% projection sits. Alternatively, if price reverses from the first support, it should test first resistance at 109.323 where the 23.6% retracement sits and subsequently the second resistance at 110.769 where the previous swing high sits.
Areas of consideration:
- H4 time frame, 1st resistance at 109.323
- H4 time frame, 1st support at 108.007
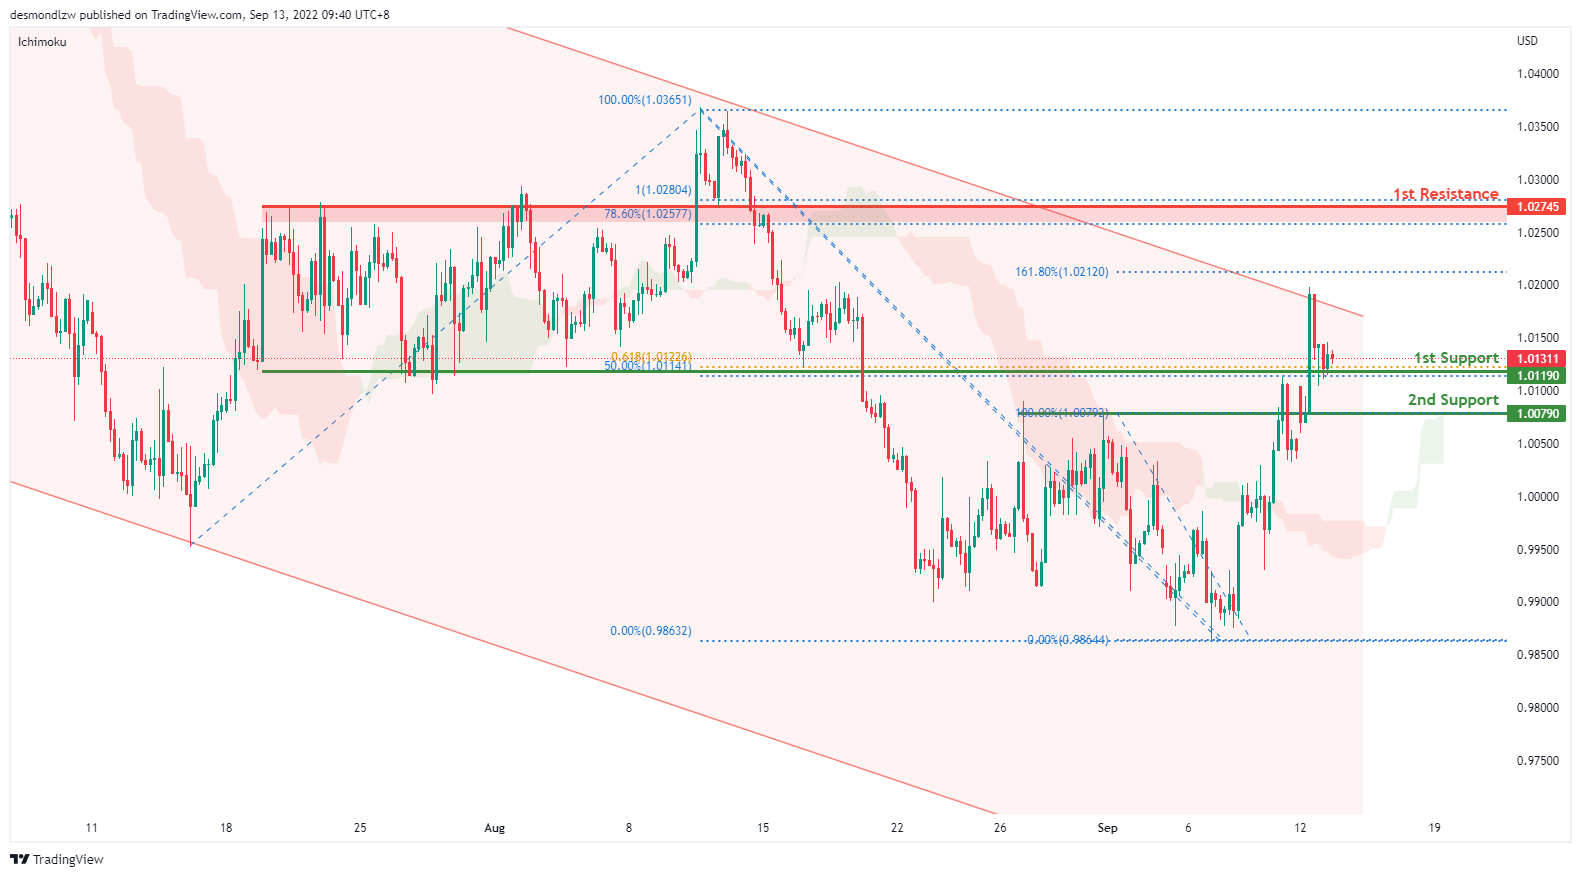
EUR/USD:
On the H4, price is moving in an ascending manner signalling bullish momentum – we are bullish bias. Price seems like it’s testing the first support at 1.0119 where the 50% retracement and 61.8% projection sits. If bullish momentum continues, it should bring price to the first resistance at 1.0274 where the 78.6% retracement and 100% projection sits. Alternatively, if price pulls back and breaks the first support, it should test the second support at 1.0079 levels where the overlapping support and previous swing high sits
Areas of consideration :
- H4 1st resistance at 1.0224
- H4 1st support at 1.0119
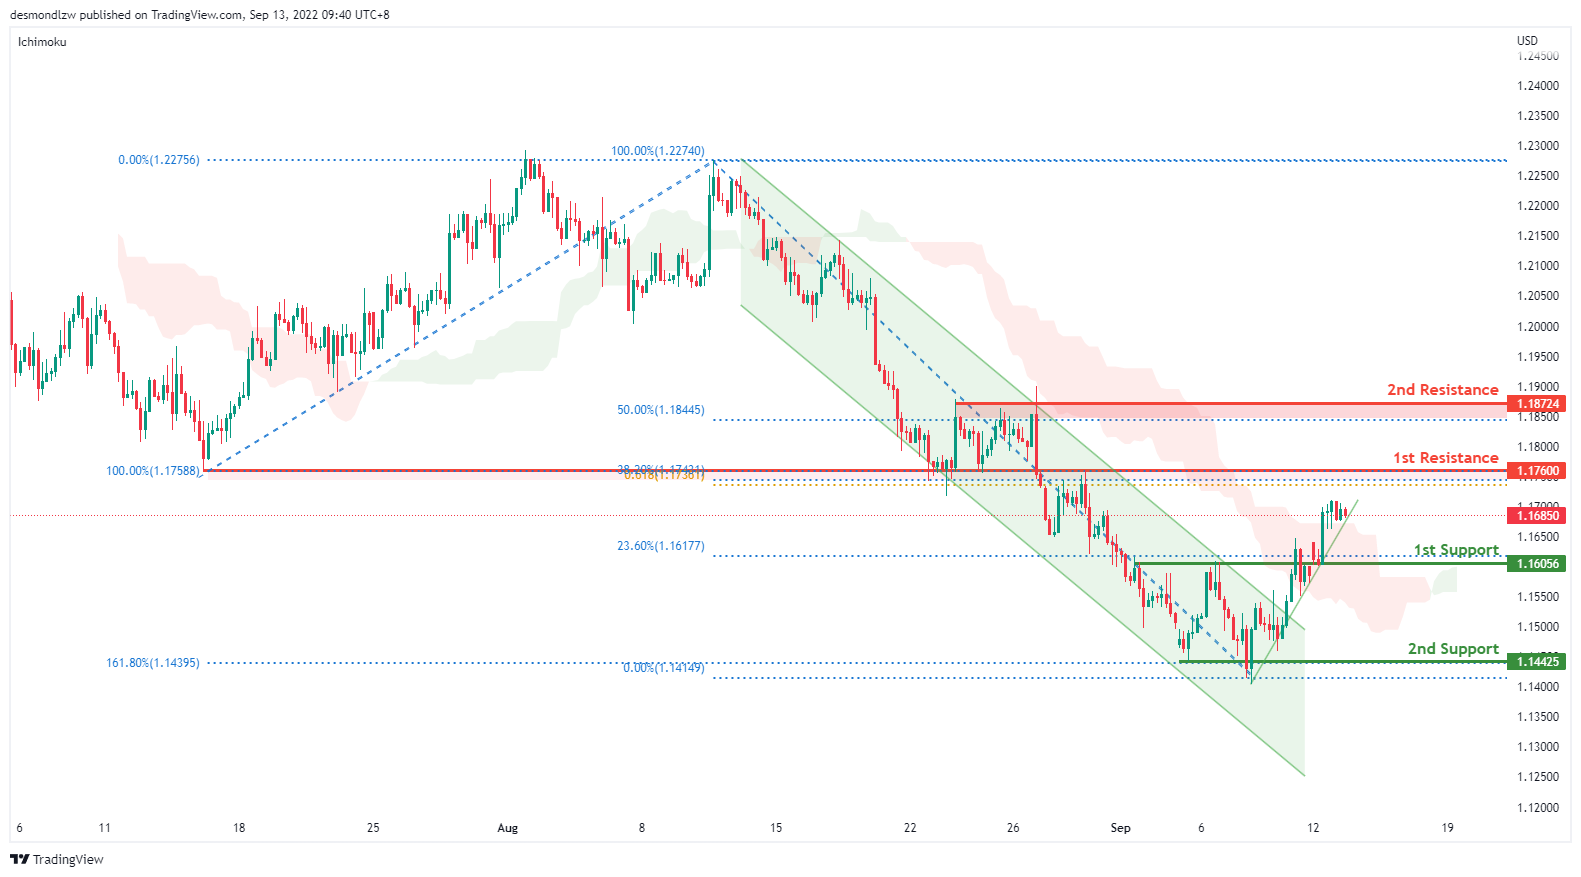
GBP/USD:
On the H4, prices have broken the descending channel and are moving in a bullish momentum- we are bullish biassed. Prices seem to be moving toward the first resistance at 1.1760 where the 38.2% retracement and 61.8% projection sits. If bullish momentum continues, it should bring prices to the second resistance at 1.1872 levels where the 50% retracement sits. Alternatively, if it fails to break the first resistance, it might look to test the first support at 1.1605 where the 23.6% retracement and overlapping support sits then the second support at 1.1442 where the 161.8% extension sits
Areas of consideration:
- H4 1st resistance at 1.1760
- H4 1st support at 1.1605
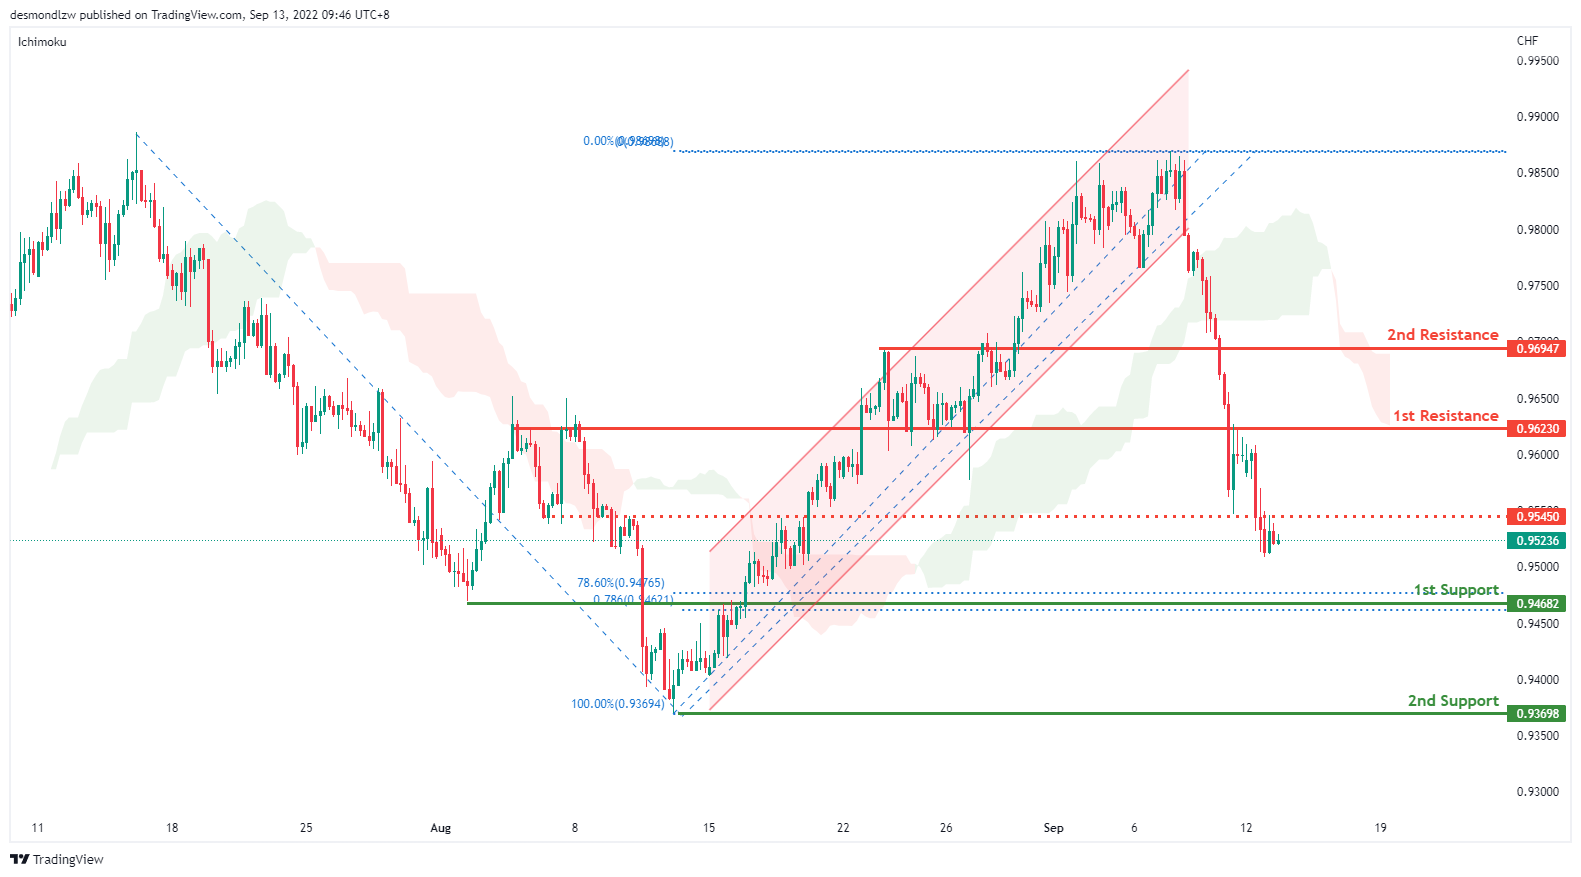
USD/CHF:
On the H4, prices have broken the ascending channel and we are currently bearish bias. Price is moving toward the first support around the 0.9468 levels where the 78.6% retracement and 78.6% projection sits. If bearish momentum continues, it should bring prices to the second support at 0.9369 levels where the swing low sits. Alternatively, price could pull back to test the first resistance at 0.9623 where the overlapping resistance and 50% retracement sit and then second resistance at 0.9694 where the 38.2% retracement sits
Areas of consideration
- H4 1st support at 0.9468
- H4 1st resistance at 0.9623
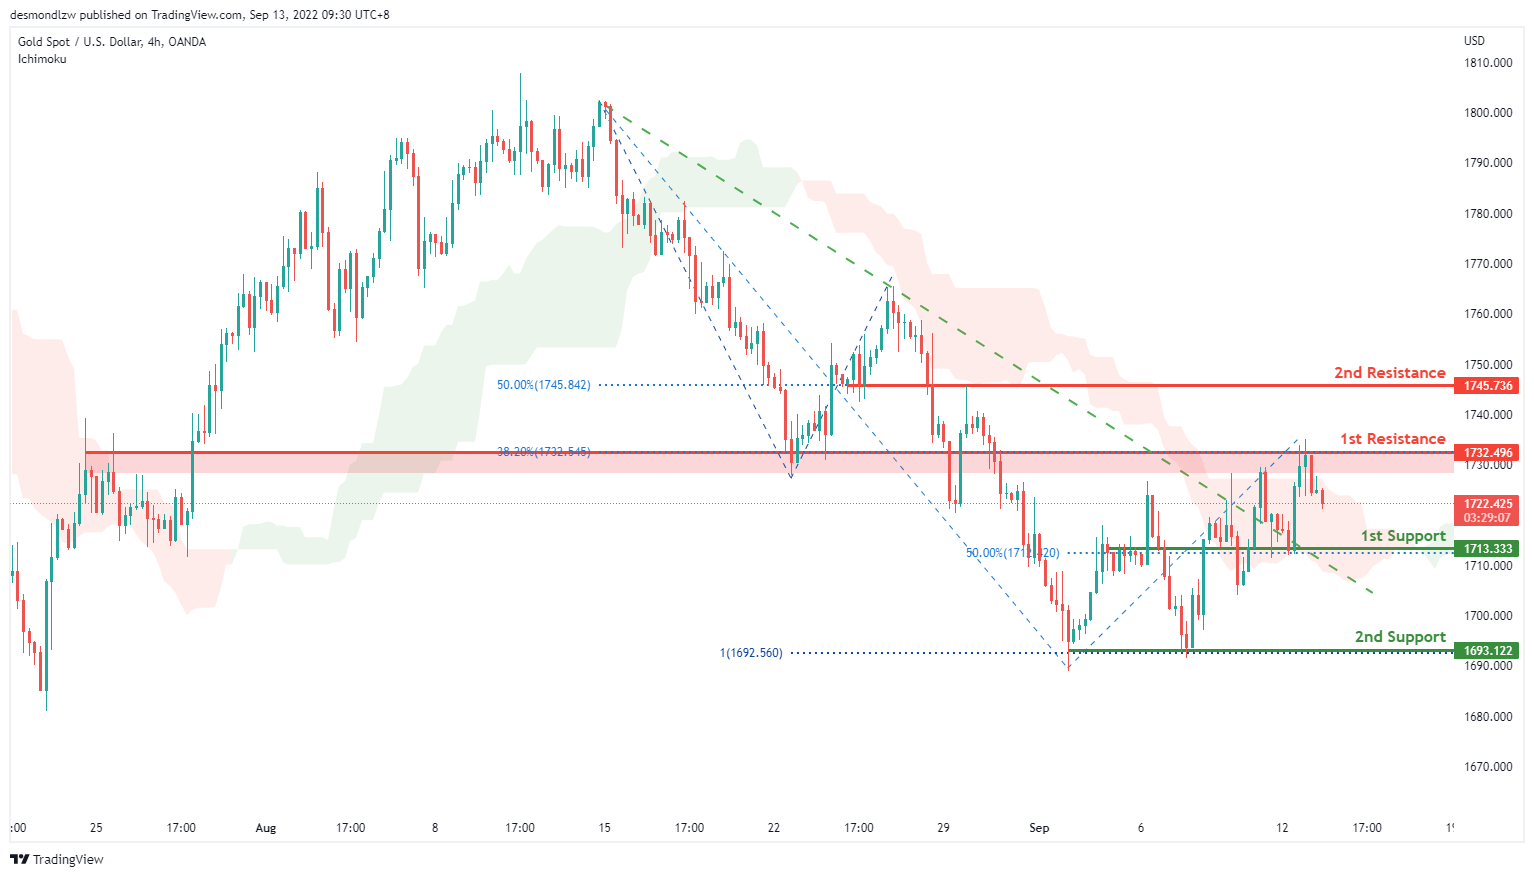
XAU/USD (GOLD):
On the H4, with the price below ichimoku cloud, and dropping from the 1st resistance, we have a bearish bias that the price may drop to the 1st support at 1713.333, which is in line with the 50% fibonacci retracement and overlap support. If the price can break this level, the 2nd support could be at 1693.122, where the swing low and 100% fibonacci projection. Alternatively, the price may retest the 1st resistance at 1732.496, which is in line with the overlap resistance and 38% fibonacci retracement. If the price can break the 1st resistance, the 2nd resistance could be at 1745.736, where the 50% fibonacci retracement and overlap resistance are.
Areas of consideration:
- H4 time frame, 1st resistance at 1732.496
- H4 time frame, 1st support at 1713.333
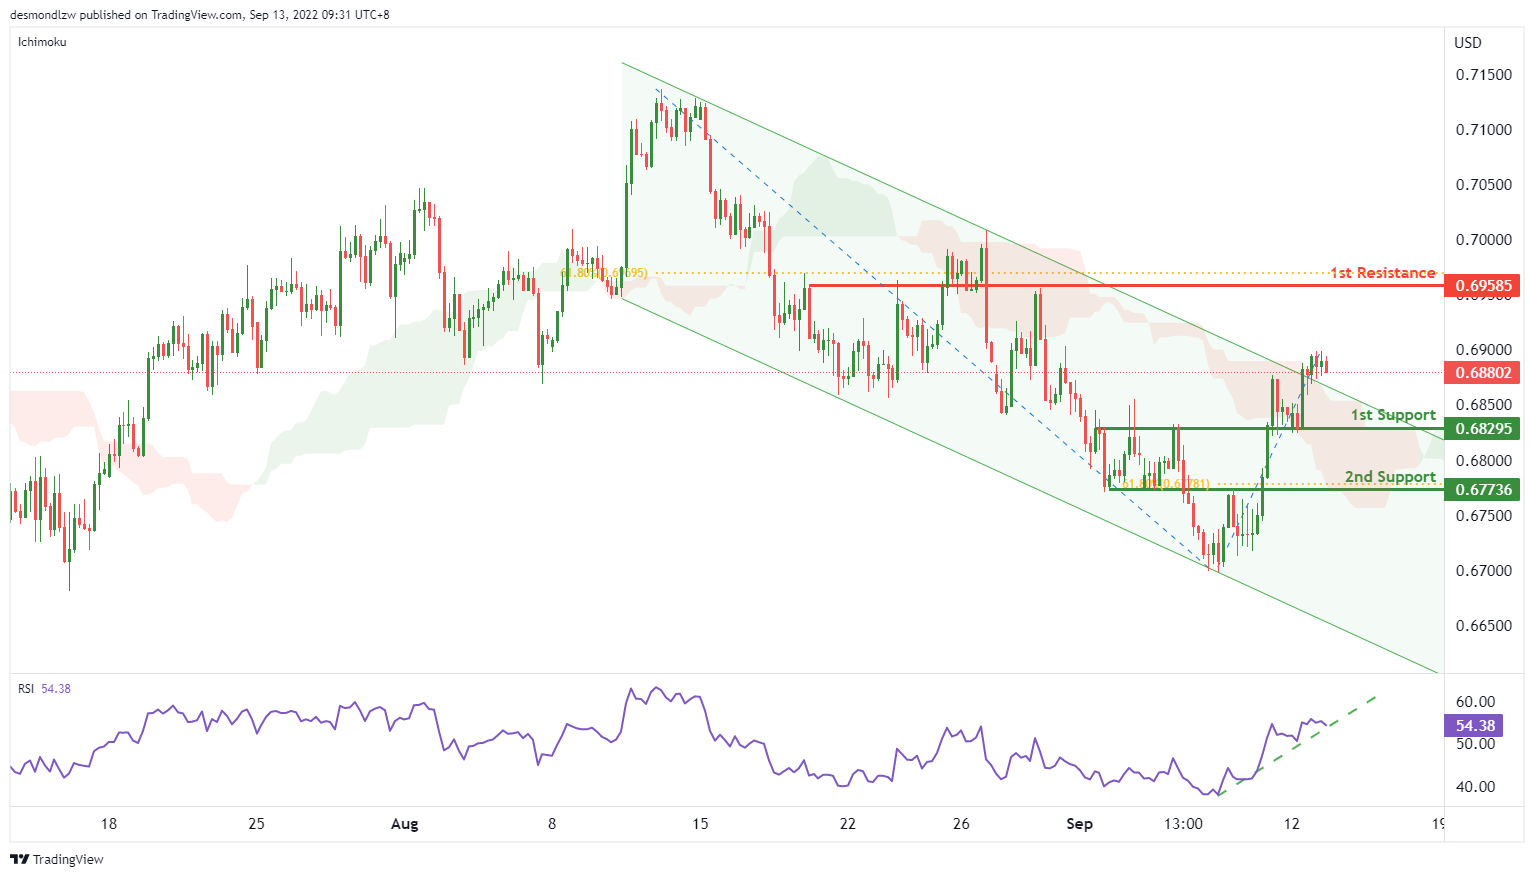
AUD/USD:
On the H4, with the price breaking the descending channel, ichimoku cloud and RSI is showing the ascending trend, we have a bullish bias that the price may rise to the 1st resistance at 0.69585, which is in line with the 61.8% fibonacci retracement and overlap resistance. Alternatively, the price may drop to the 1st support at 0.68295, which is in line with the overlap support. If this support level is broken, the next support level could be at 0.67736, where the swing lows and 61.8% fibonacci retracement are.
Areas of consideration
- H4 1st support at 0.68295
- H4 1st resistance at 0.69585
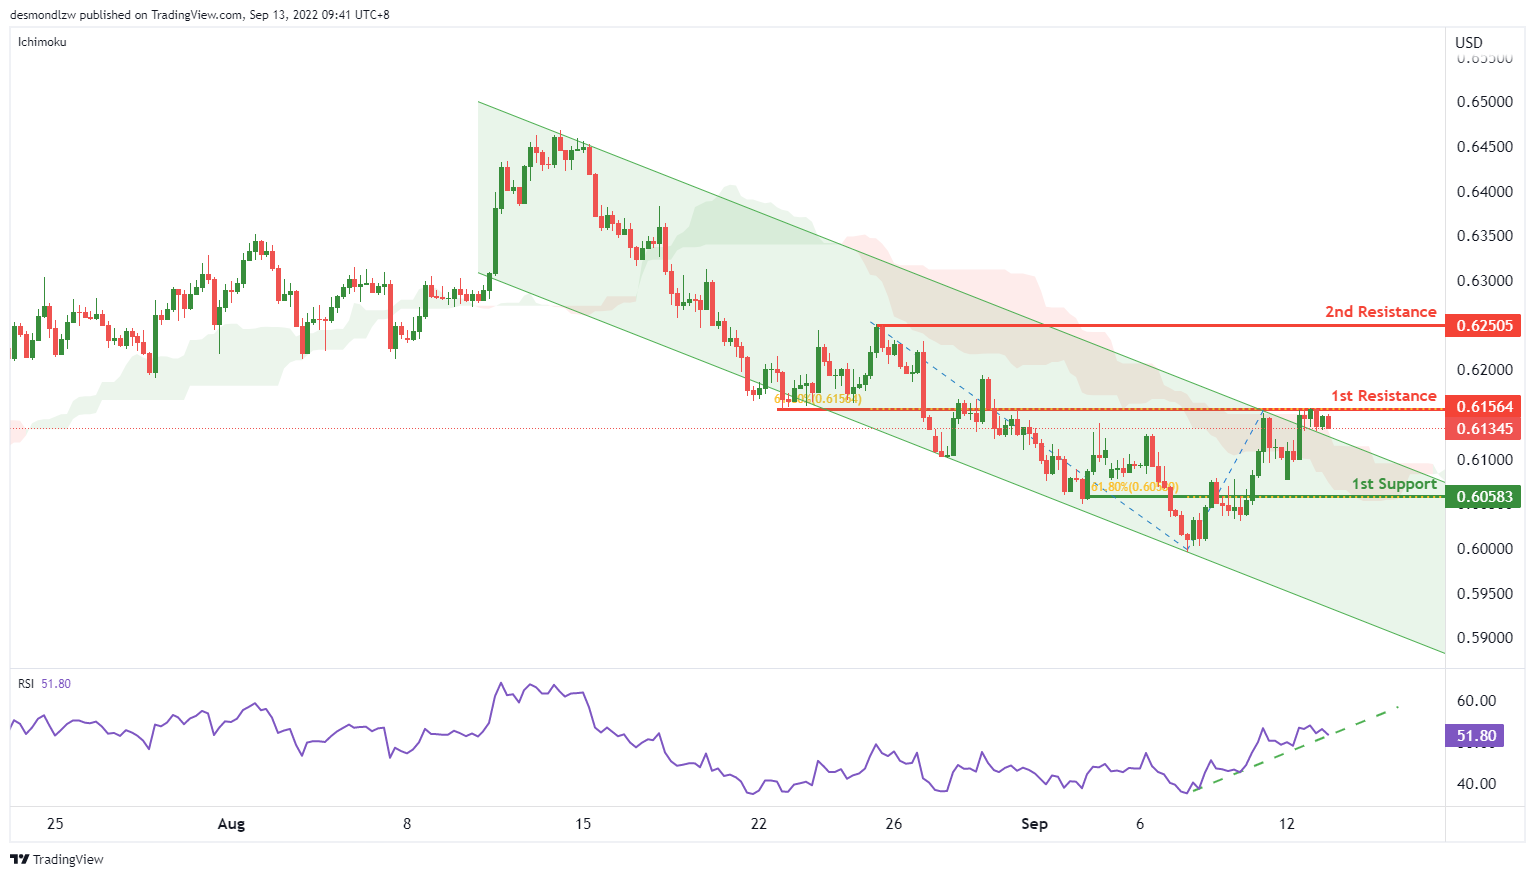
NZD/USD:
On the H4, with the price breaking the descending channel, ichimoku cloud and RSI is showing a ascending trend, we have a weak bullish bias that the price may test the 1st resistance at 0.61564, which is in line with the 61.8% fibonacci retracement and overlap resistance. If the price can break the 1st resistance, the 2nd resistance could be at 0.62505, which is in line with the wing high. Alternatively, the price may drop to the 1st support at 0.60583, which is in line with the 61.8% fibonacci retracement.
Areas of consideration:
- H4 time frame, 1st resistance at 0.61564,
- H4 time frame, 2nd resistance at 0.62505
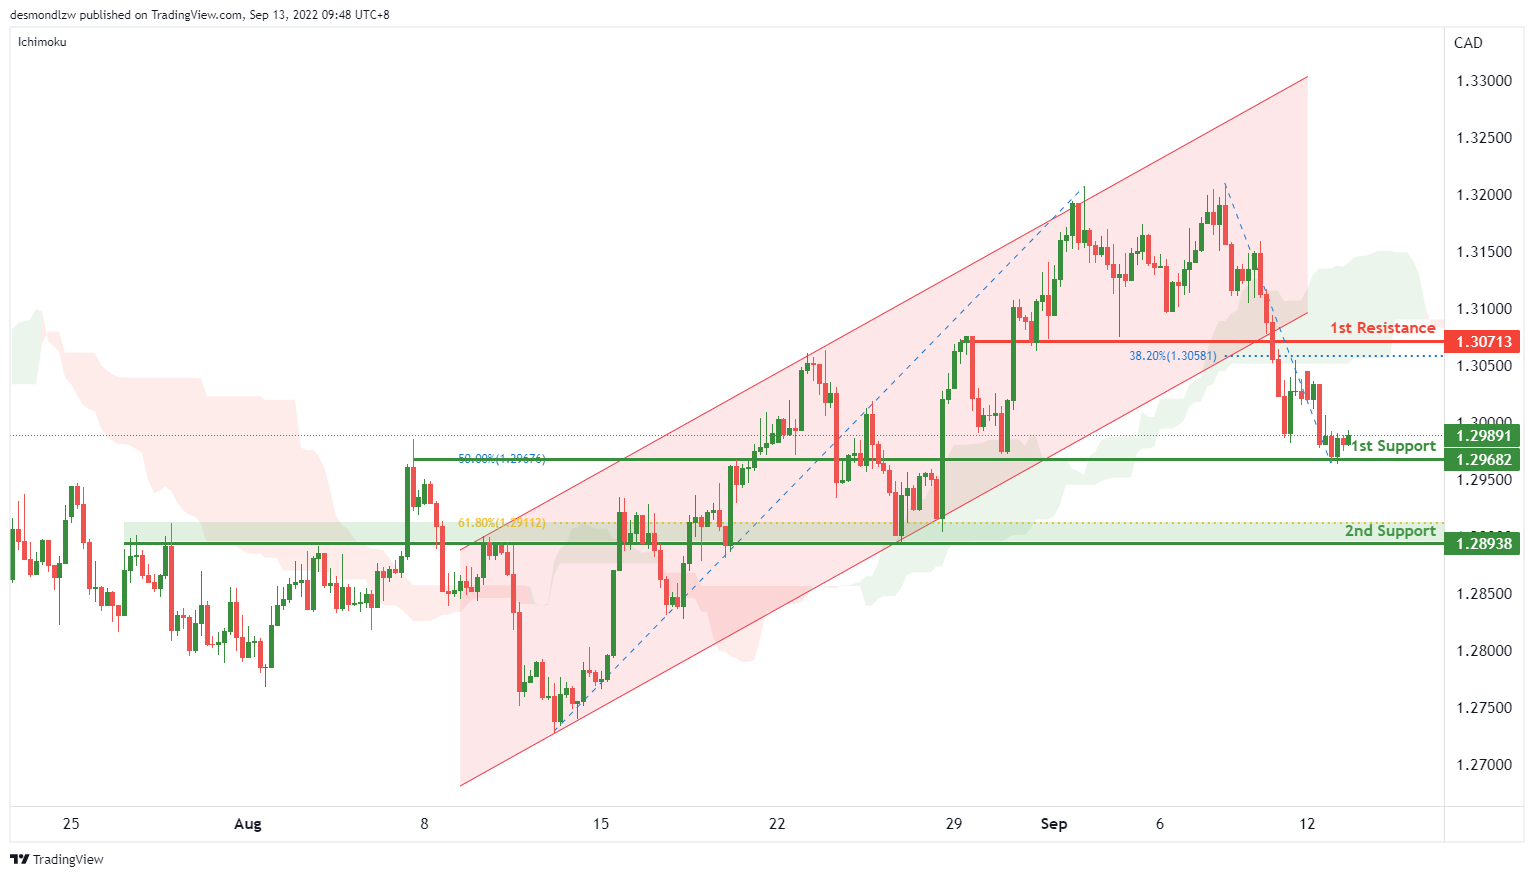
USD/CAD:
On the H4, with the price breaking the ascending channel, below the ichimoku cloud, and there’s a possible “double top” pattern, we have a bearish bias that the price may drop to the 1st support at 1.29682, which is in line with the overlap support and 50% fibonacci retracement. If the 1st support is broken, the 2nd support could be at 1.28938, where the overlap support and 61.8% fibonacci retracement are. Alternatively, the price may rise to the 1st resistance at 1.30713, where the “neckline” of the “double top” pattern and 38.2% fibonacci retracement are.
Areas of consideration:
- H4 time frame, 1st support at 1.29682
- H4 time frame, 2nd support at 1.28938
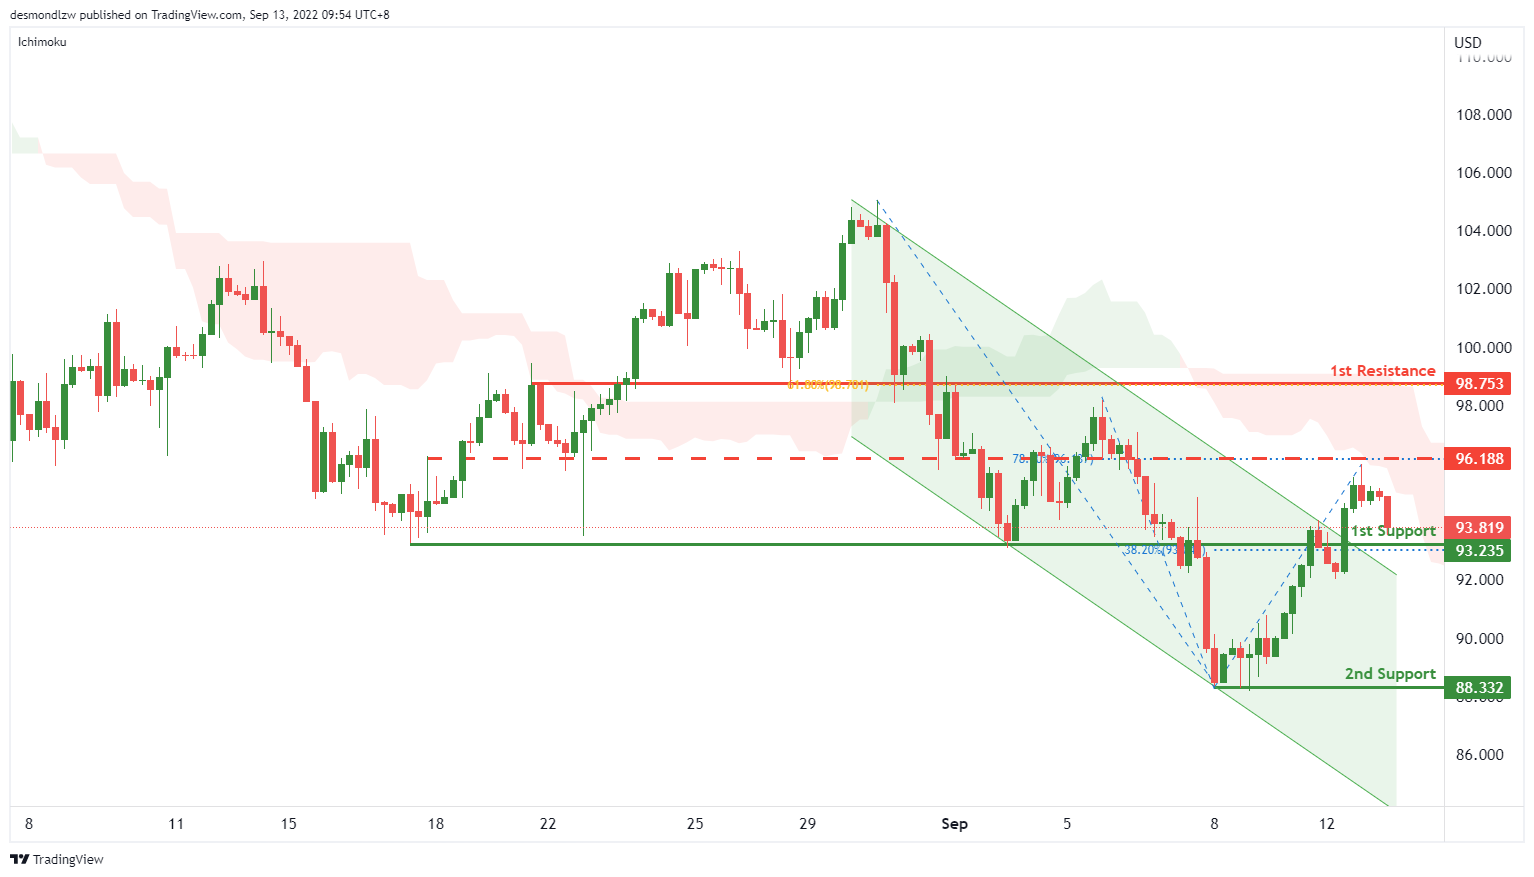
OIL:
On the H4, with price below ichimoku and dropping from the intermediate resistance, we have a bearish bias that the price may drop to the 1st support at 93.235, where the overlap resistance and 38.2% fibonacci retracement are. If the price can break this resistance level, the next support level could be at 88.332, which is in line with the swing low. Alternatively, the price may rise to the 1st resistance at 98.753, which is in line with the 61.8% fibonacci retracement and overlap resistance. Take note the intermediate resistance could be at 96.188, which is in line with the 78.6% fibonacci retracement.
Areas of consideration:
- H4 time frame, 1st support at 93.235
- H4 time frame, 2nd support at 88.332
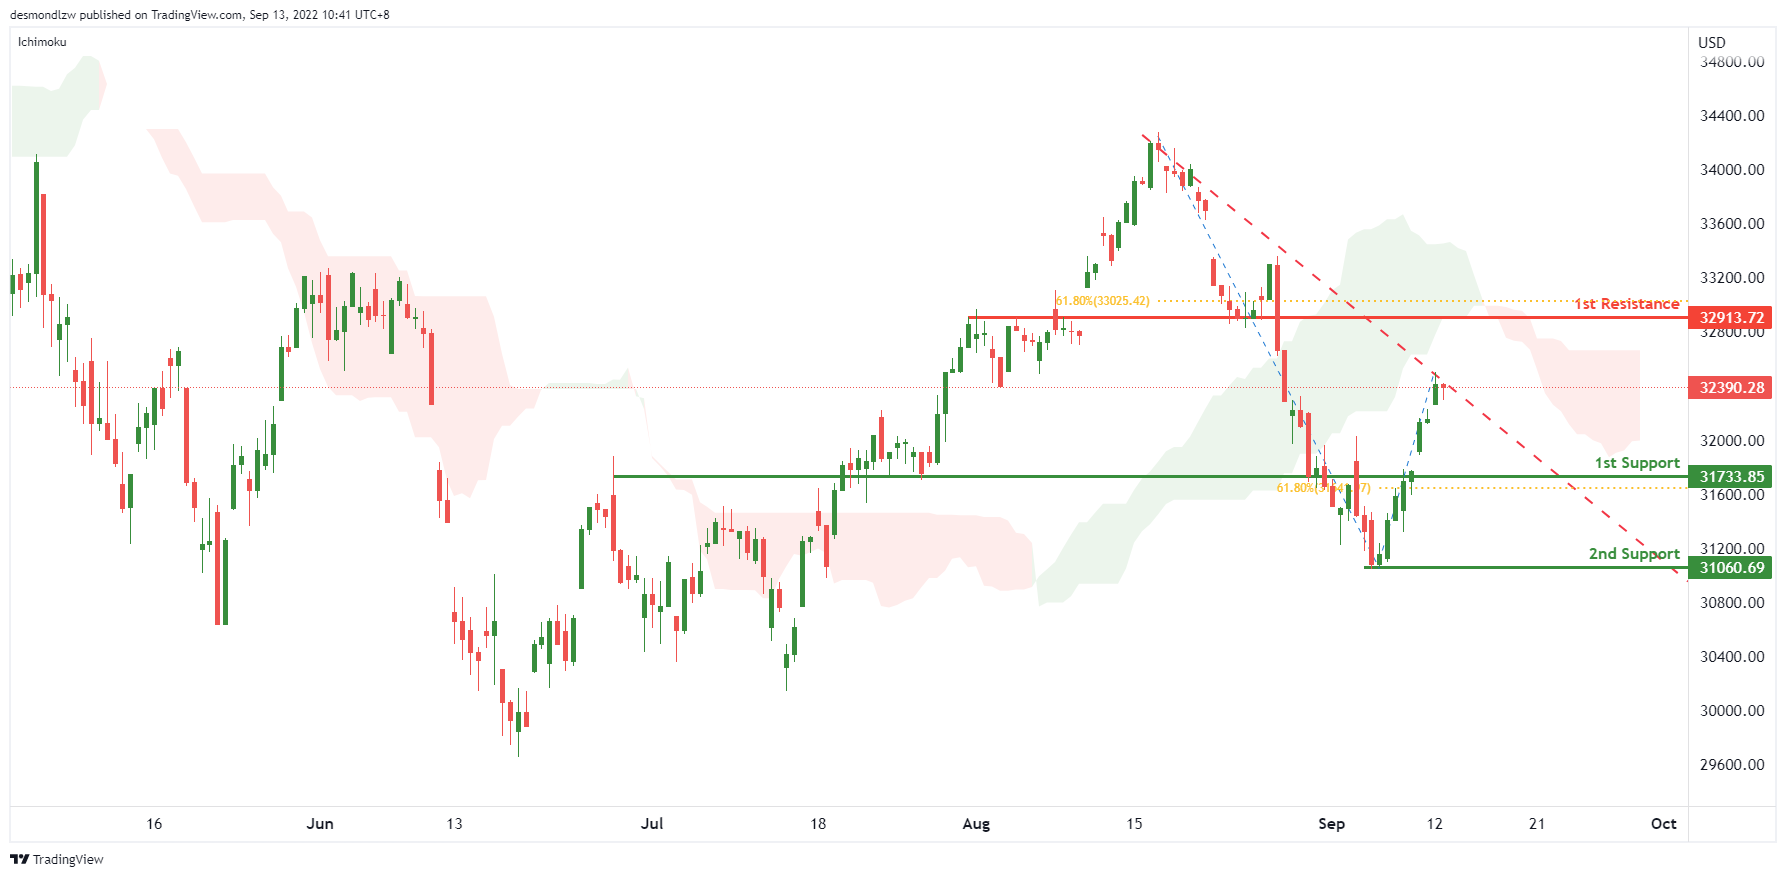
Dow Jones Industrial Average:
On the H4, with price moving within the descending trendline and below ichimoku cloud, we have a bearish bias that the price may drop to the 1st support at 31733.85, where the overlap support and 61.8% fibonacci retracement are . If the 1st support is broken, the 2nd support could be at 31060.69, which is in line with the swing low. Alternatively, the price may break the descending trendline and rise to the 1st resistance at 32913.72, which is in line with the overlap resistance and 61.8% fibonacci retracement.
Areas of consideration:
- H4 time frame, 1st support at 31733.85
- H4 time frame, 2nd support at 31060.69
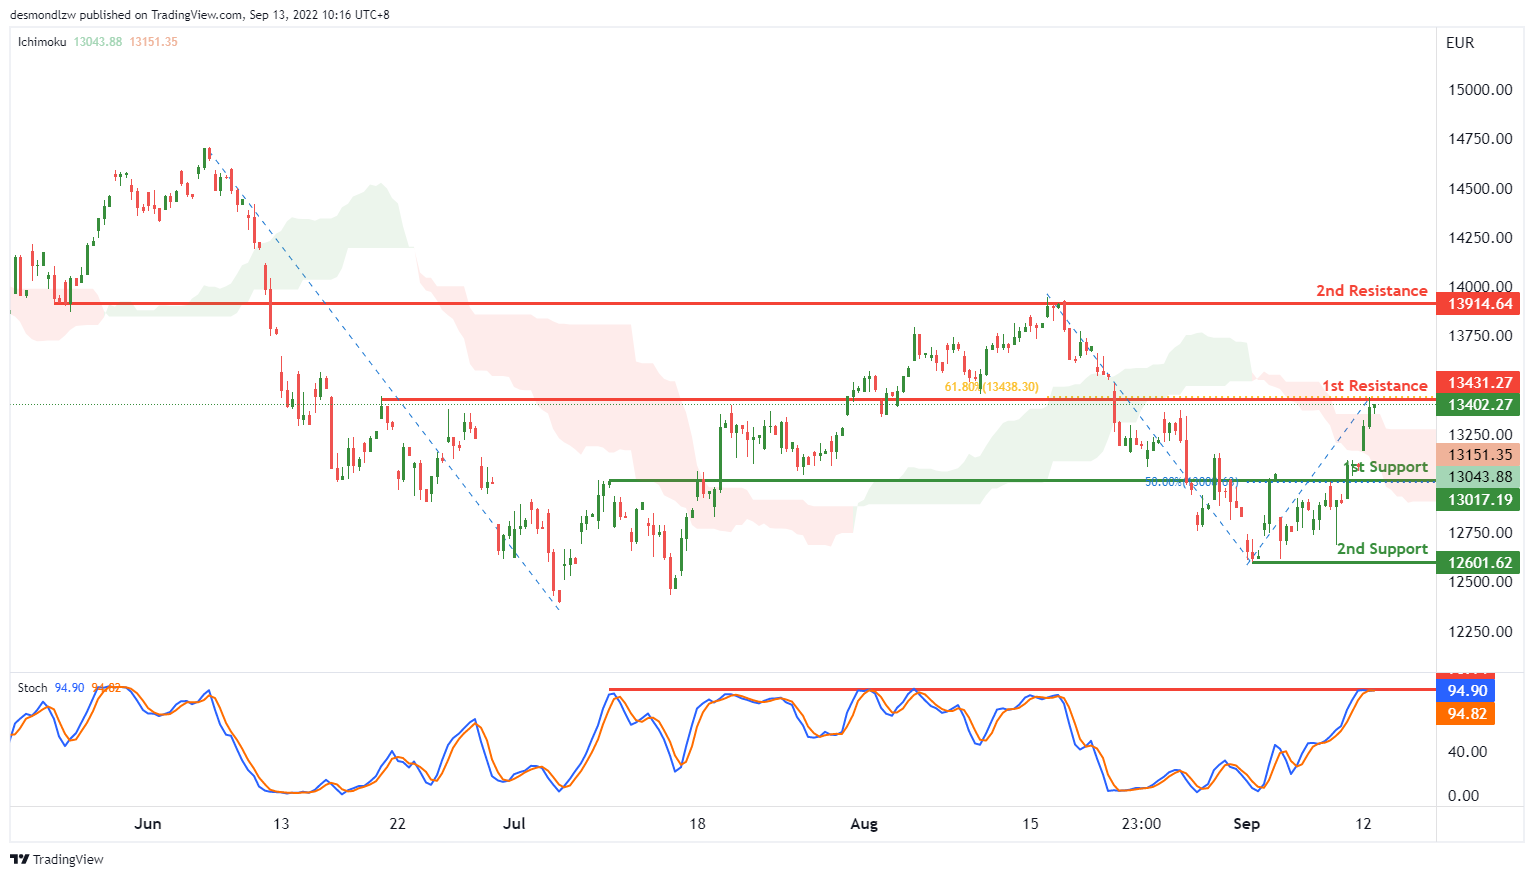
DAX:
On the H4, with price moving above the ichimoku indicator, we have a weak bullish bias that the price may test the 1st resistance at 13431.27, which is in line with the overlap resistance and 61.8% fibonacci retracement. If the price can break the 1st resistance successfully, the next resistance could be at 13914.64, where the overlap resistance and swing high are. Alternatively, as the Stoch is reaching the resistance, the price may drop to the 1st support at 13017.19, where the 50% fibonacci retracement is. If the 1st support is broken, the 2nd support could be at 12601.62, where the swing low is.
Areas of consideration:
- H4 time frame, 1st resistance at 13431.27
- H4 time frame, 2nd resistance at 13914.64
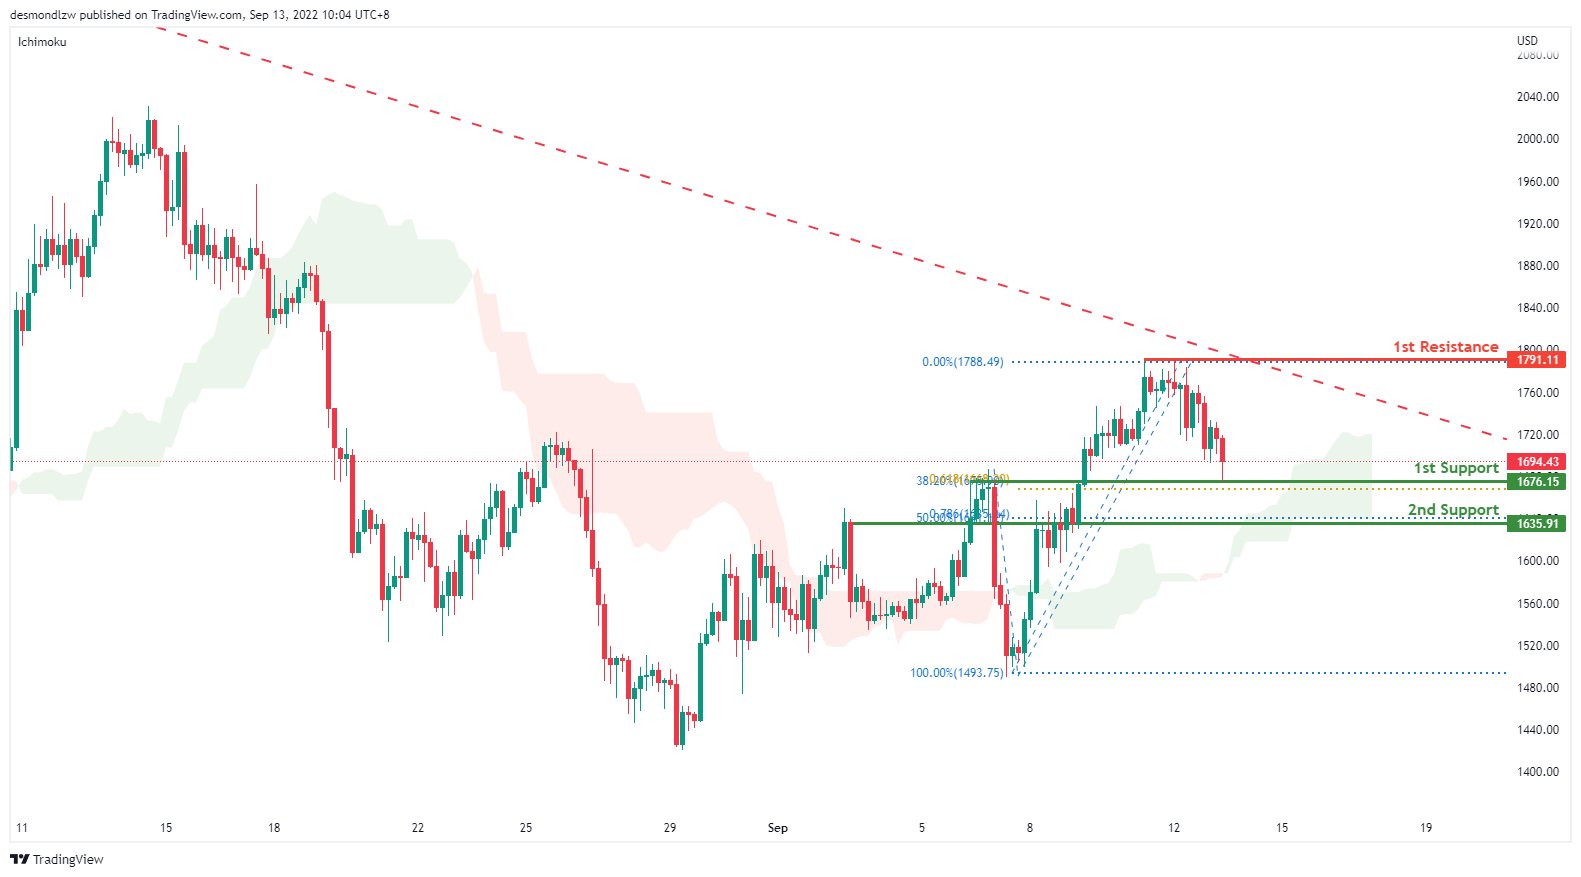
ETHUSD:
On the H4, with price moving above the ichimoku indicator, we have a bullish bias that price will rise to 1st resistance at 1791.11 where the 61.8% fibonacci retracement sits. Price is currently testing the first support at 1676.15 where the 38.2% retracement and 61.8% projection sits. If price were to break first support, it will bring it to the second support at 1635.91 where the 50% retracement and 78.6% projection sits
Areas of consideration:
- H4 time frame, 1st resistance of 1791.11
- H4 time frame, 1st support at 1676.15
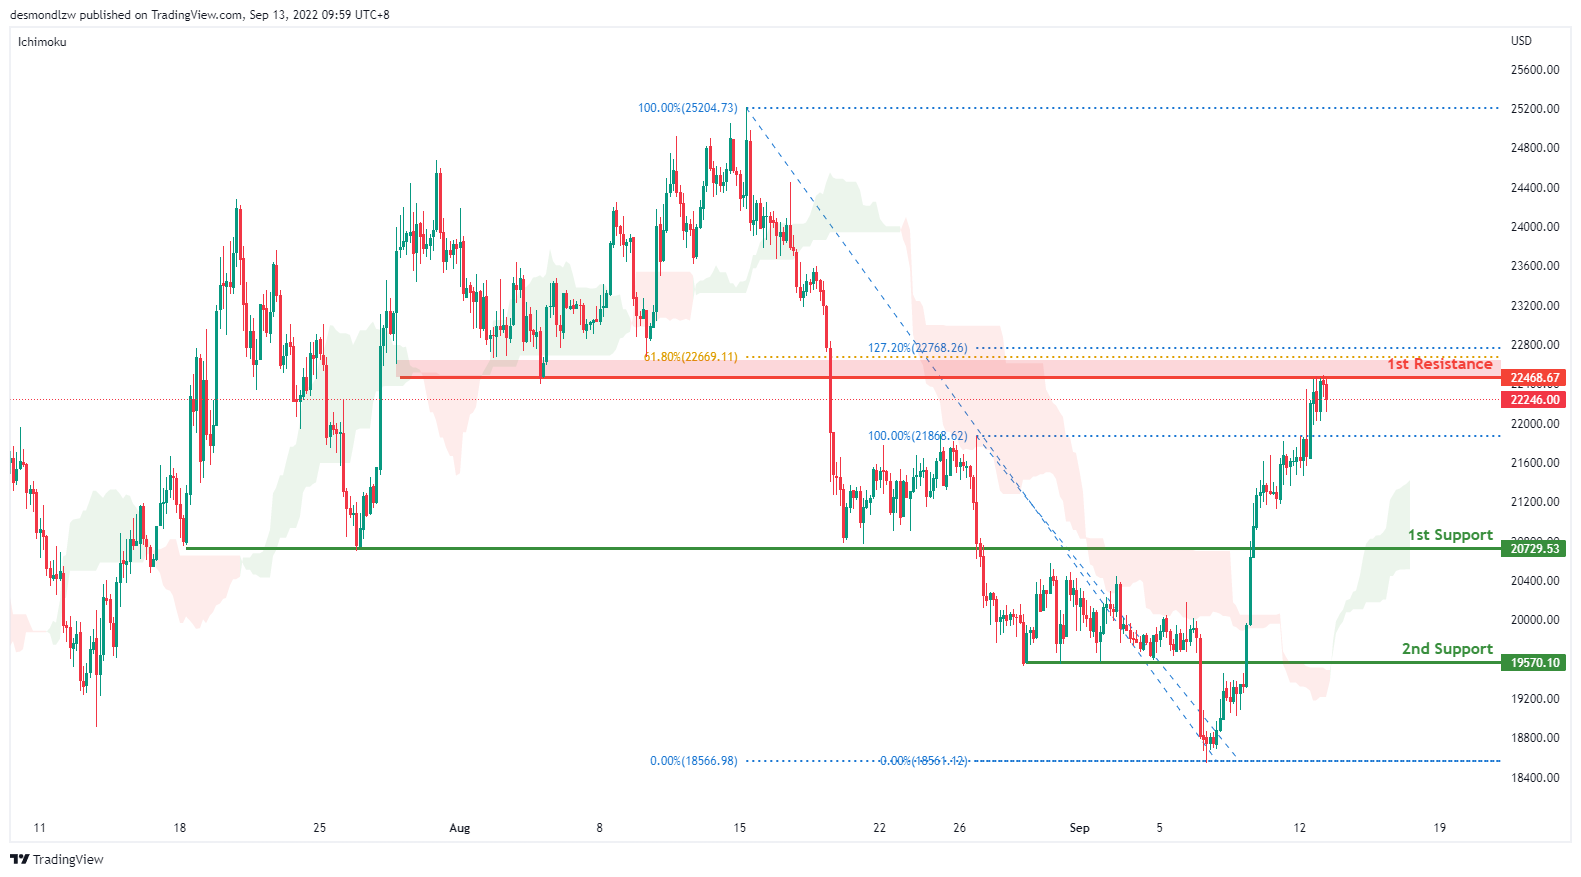
BTCUSD:
On the H4, with price breaking out of a descending channel and moving above the ichimoku indicator, we are bullish bias- that is testing the 1st resistance at 22468.67 where the pullback resistance and 61.8% fibonacci retracement sits. Alternatively, price could pull back to the first support at 20729.53 where the previous swing low sits and then the second support at 19570.10 levels
Areas of consideration:
- H4 time frame, 1st resistance of 22468.67
- H4 time frame, 1st support at 20729.53
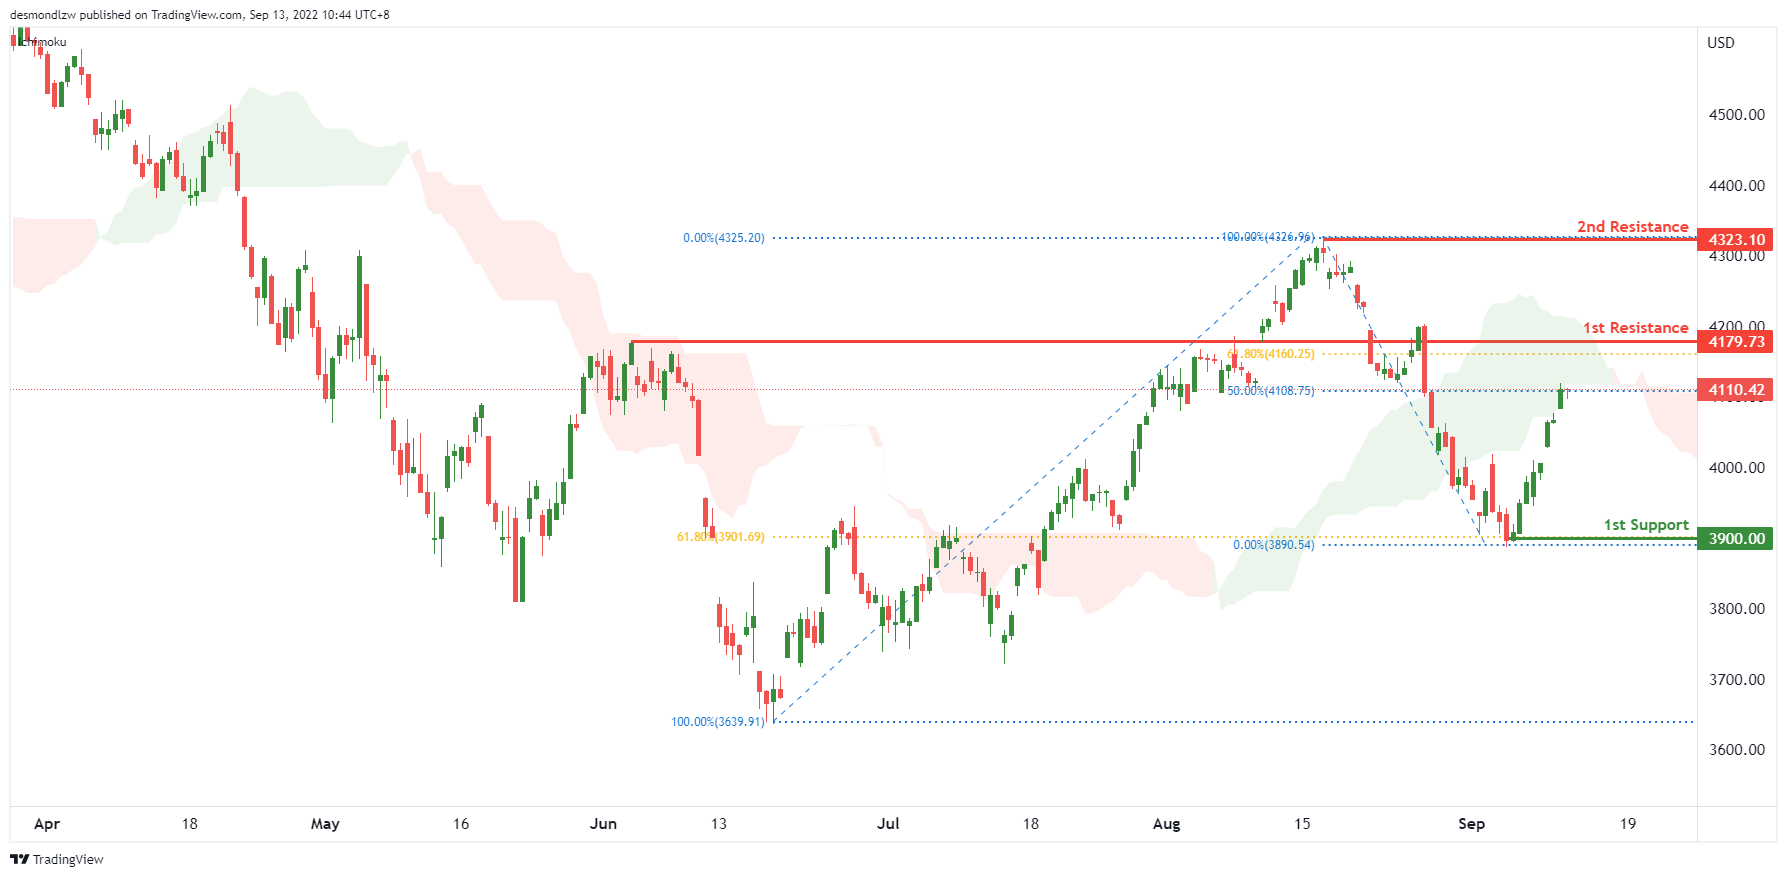
S&P 500:
On the H4, price bounced from the 3900 support level earlier and is climbing steadily towards the 1st resistance of 4179. With price moving below the ichimoku indicator, our bearish bias is still valid, while looking for price to drop from the pullback resistance of 61.8% fibonacci retracement. If price rejects the resistance level, price could fall towards the 1st support of 3900 where the pullback support is. Alternatively, price could break 1st resistance structure and rise to 2nd resistance and pullback resistance of 4323.10.
Areas of consideration:
- H4 time frame, 1st resistance of 4179.73
- H4 time frame, 1st support at 3900


