
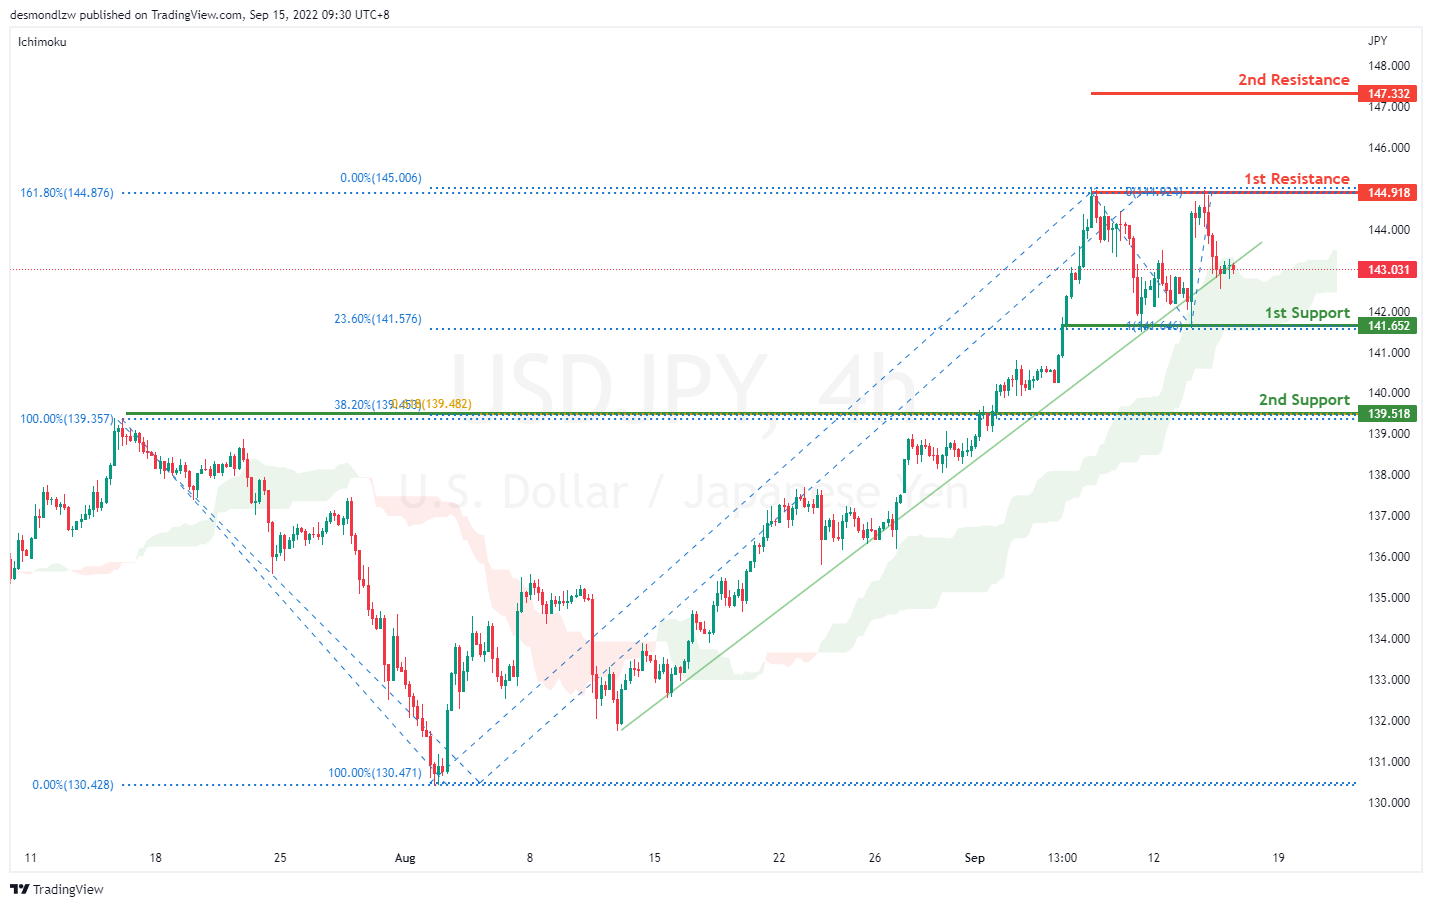
USD/JPY:
On the H4 chart, price is still respecting the ascending trend line. We are still bullish bias- Price is testing along the trend line and if bullish momentum continues, it should bring price to first resistance at 144.918 where the 161.8% extension sits. If it breaks this level, it should bring price to 147.332 where the previous swing high sits. Alternatively it could pull back to the first support at 141.652 where the 23.6% retracement and 100% projection sits then to the second support at 139.518 where the 38.2% retracement and overlapping support sits.
Areas of consideration:
- H4 time frame, 1st resistance at 144.918
- H4 time frame, 1st support at 141.652
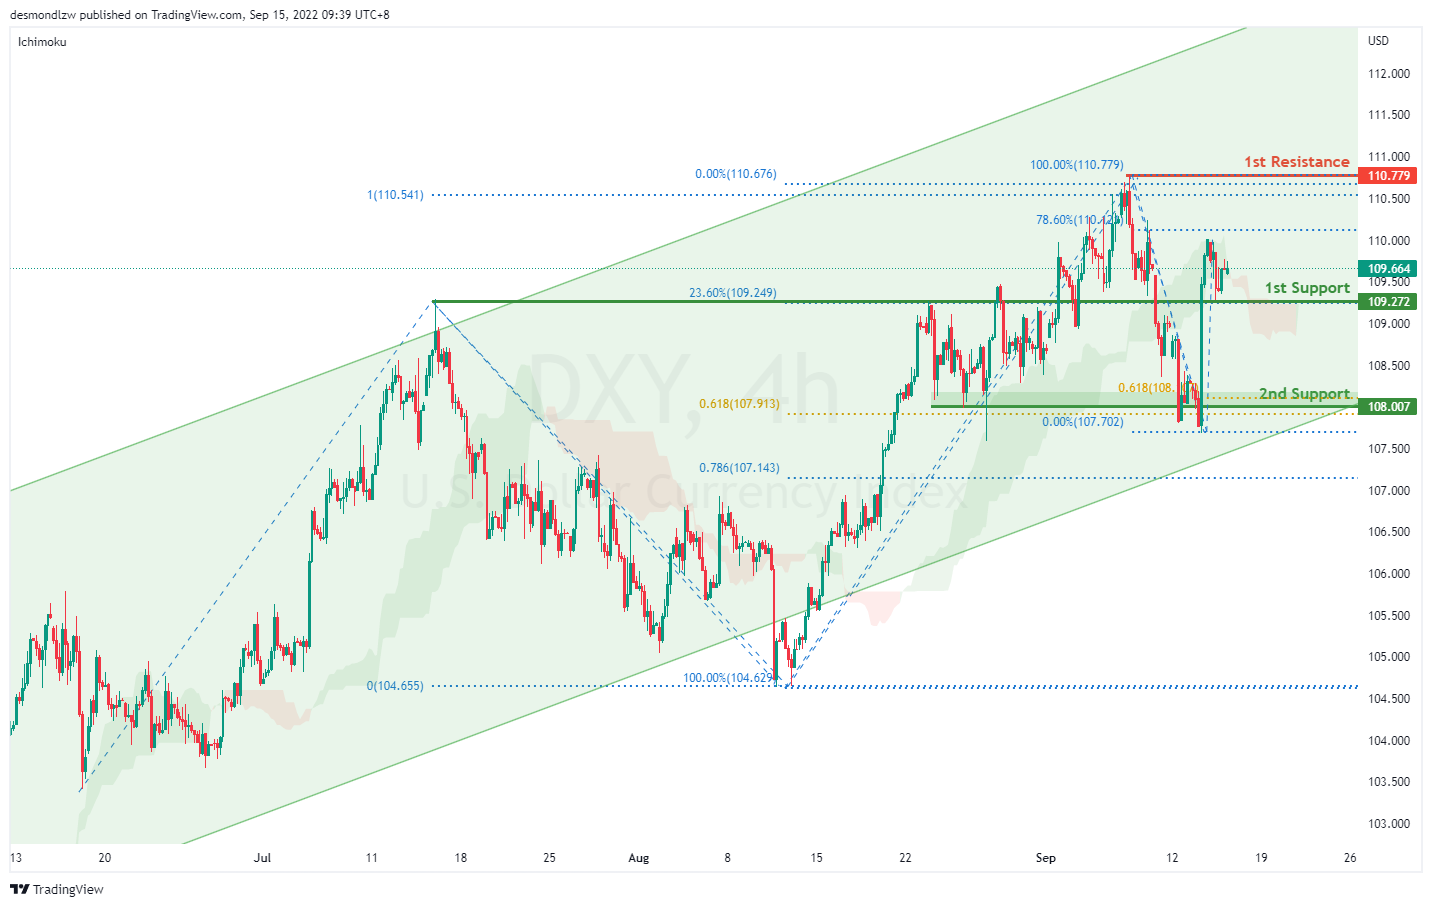
DXY:
On the H4, price is still respecting the bullish channel- we are bullish bias. Price has rebounded off the support level and is moving toward the first resistance at 110.779 levels where the previous swing high sits. Alternatively, price could pull back to test the first support at 109.272 where the 23.6% retracement sits then the second support at 108.007 where the 61.8% projection, 61.8% retracement and previous swing low sits.
Areas of consideration:
- H4 time frame, 1st resistance at 110.779
- H4 time frame, 1st support at 109.272
EUR/USD:
On the H4, price is moving within the channel, we are currently bearish bias. Price seems like its moving to the first support at 0.9886 where the 61.8% projection and previous swing low sits. If bearish momentum continues, it should bring price to second support at 0.9799 where the 78.6% projection sits. Alternatively, if price pulls back it should test the first resistance at 1.0079 level where the 50% retracement and previous swing high sits then the second resistance at 1.0199 where the 61.8% retracement and previous swing high sits
Areas of consideration :
- H4 1st resistance at 1.0079
- H4 1st support at 0.9886

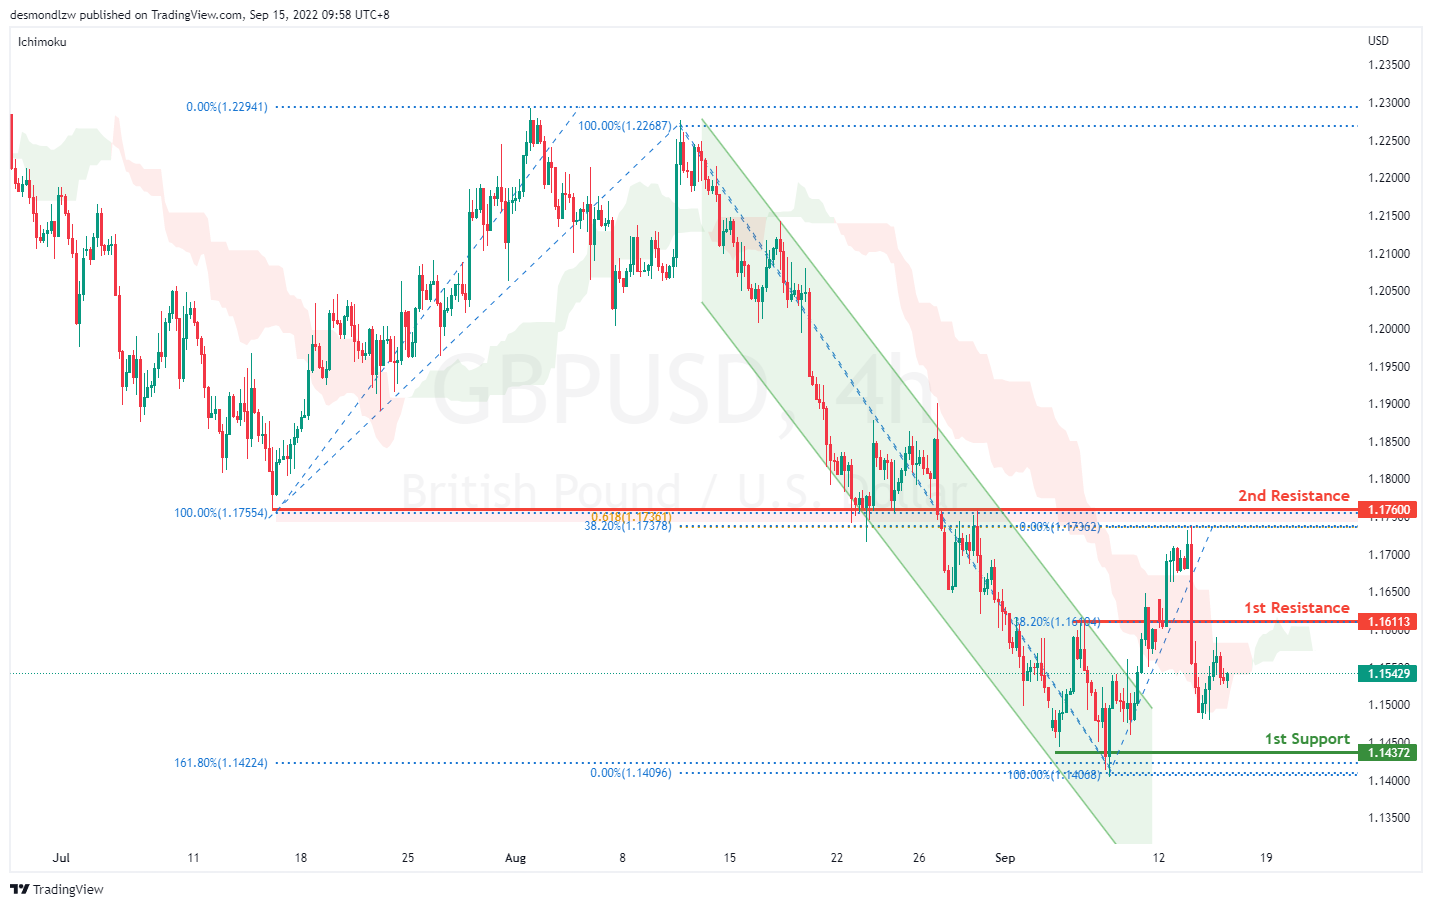
GBP/USD:
On the H4, prices are still moving in a bearish momentum hence we are bearish biassed. Prices seem to be moving toward the first support at 1.1437 where the 161.8% extension and previous swing low sits. Alternatively, price could pull back to test the first resistance at 1.1611 where the 38.2% retracement and overlapping support sits then the second resistance at 1.1760 where the 61.8% retracement and previous swing high sits
Areas of consideration:
- H4 1st resistance at 1.1611
- H4 1st support at 1.1437
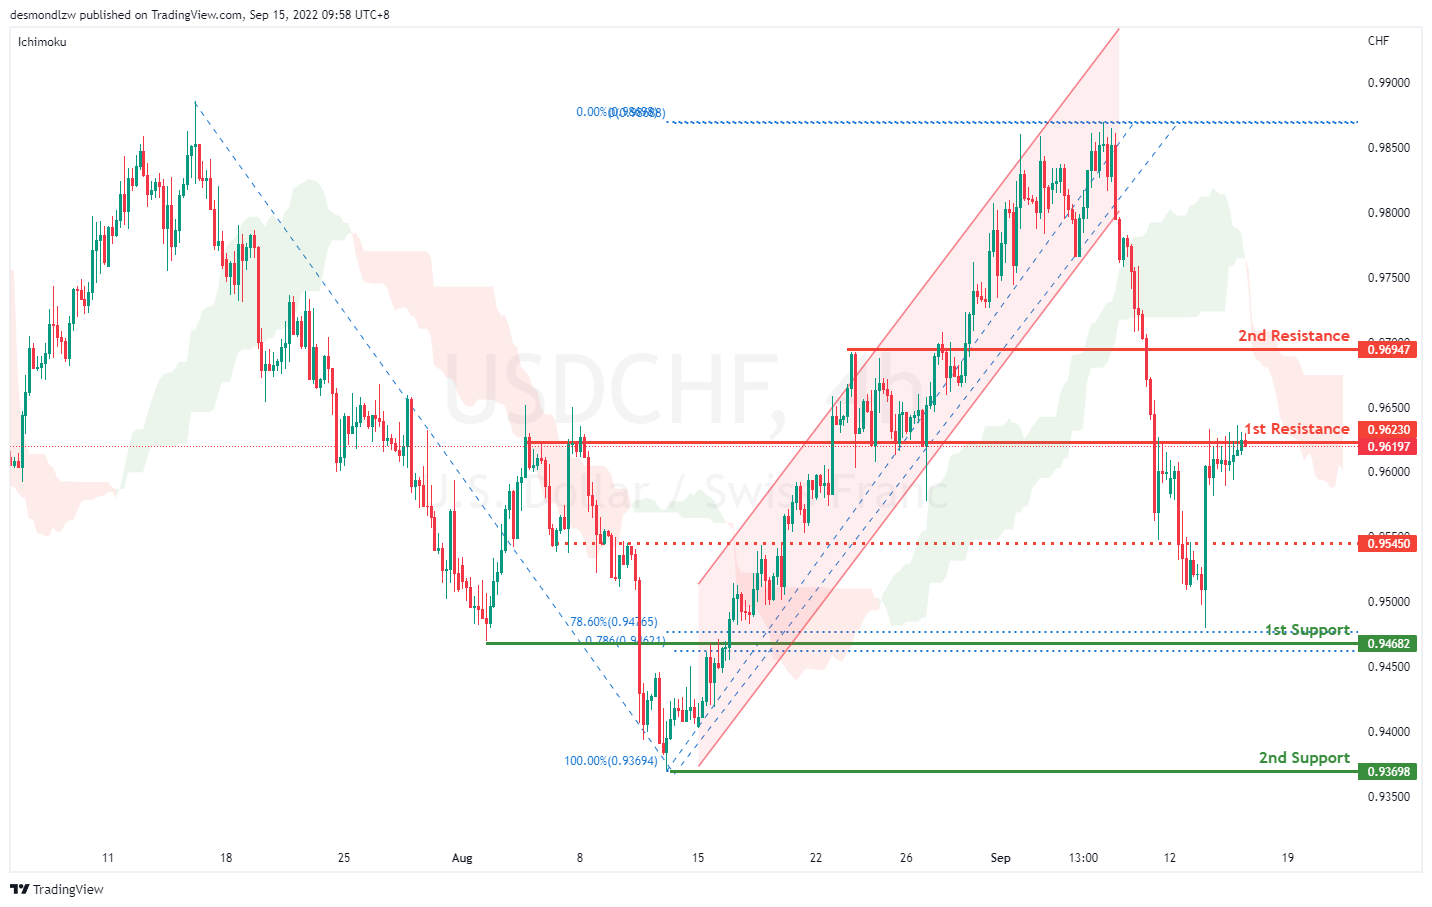
USD/CHF:
On the H4, prices have broken the ascending channel and we are currently bearish bias. Price is testing the first resistance at 0.9623 where the overlapping resistance and 50% retracement sit. If it breaks this level, it might test the second resistance at 0.9694 where the 38.2% retracement sits. Alternatively, price could pull back to test the first support at 0.9468 where the 78.6% retracement sit and then second support at 0.9369 where the previous swing low sits
Areas of consideration
- H4 1st support at 0.9468
- H4 1st resistance at 0.9623
XAU/USD (GOLD):
On the H4, with the price dropping from the 1st resistance and below ichimoku cloud, we have a bearish bias that the price may drop to the 1st support at 1689.301, which is in line with the swing low to the 2nd support at 1680.341, where the previous significant swing low is. Alternatively, the price may rise to the 1st resistance at 1732.496, which is in line with the 61.8% and 38.2% fibonacci retracement and overlap resistance.
Areas of consideration:
- H4 time frame, 1st support at 16989.301
- H4 time frame, 2nd support at 1680.341

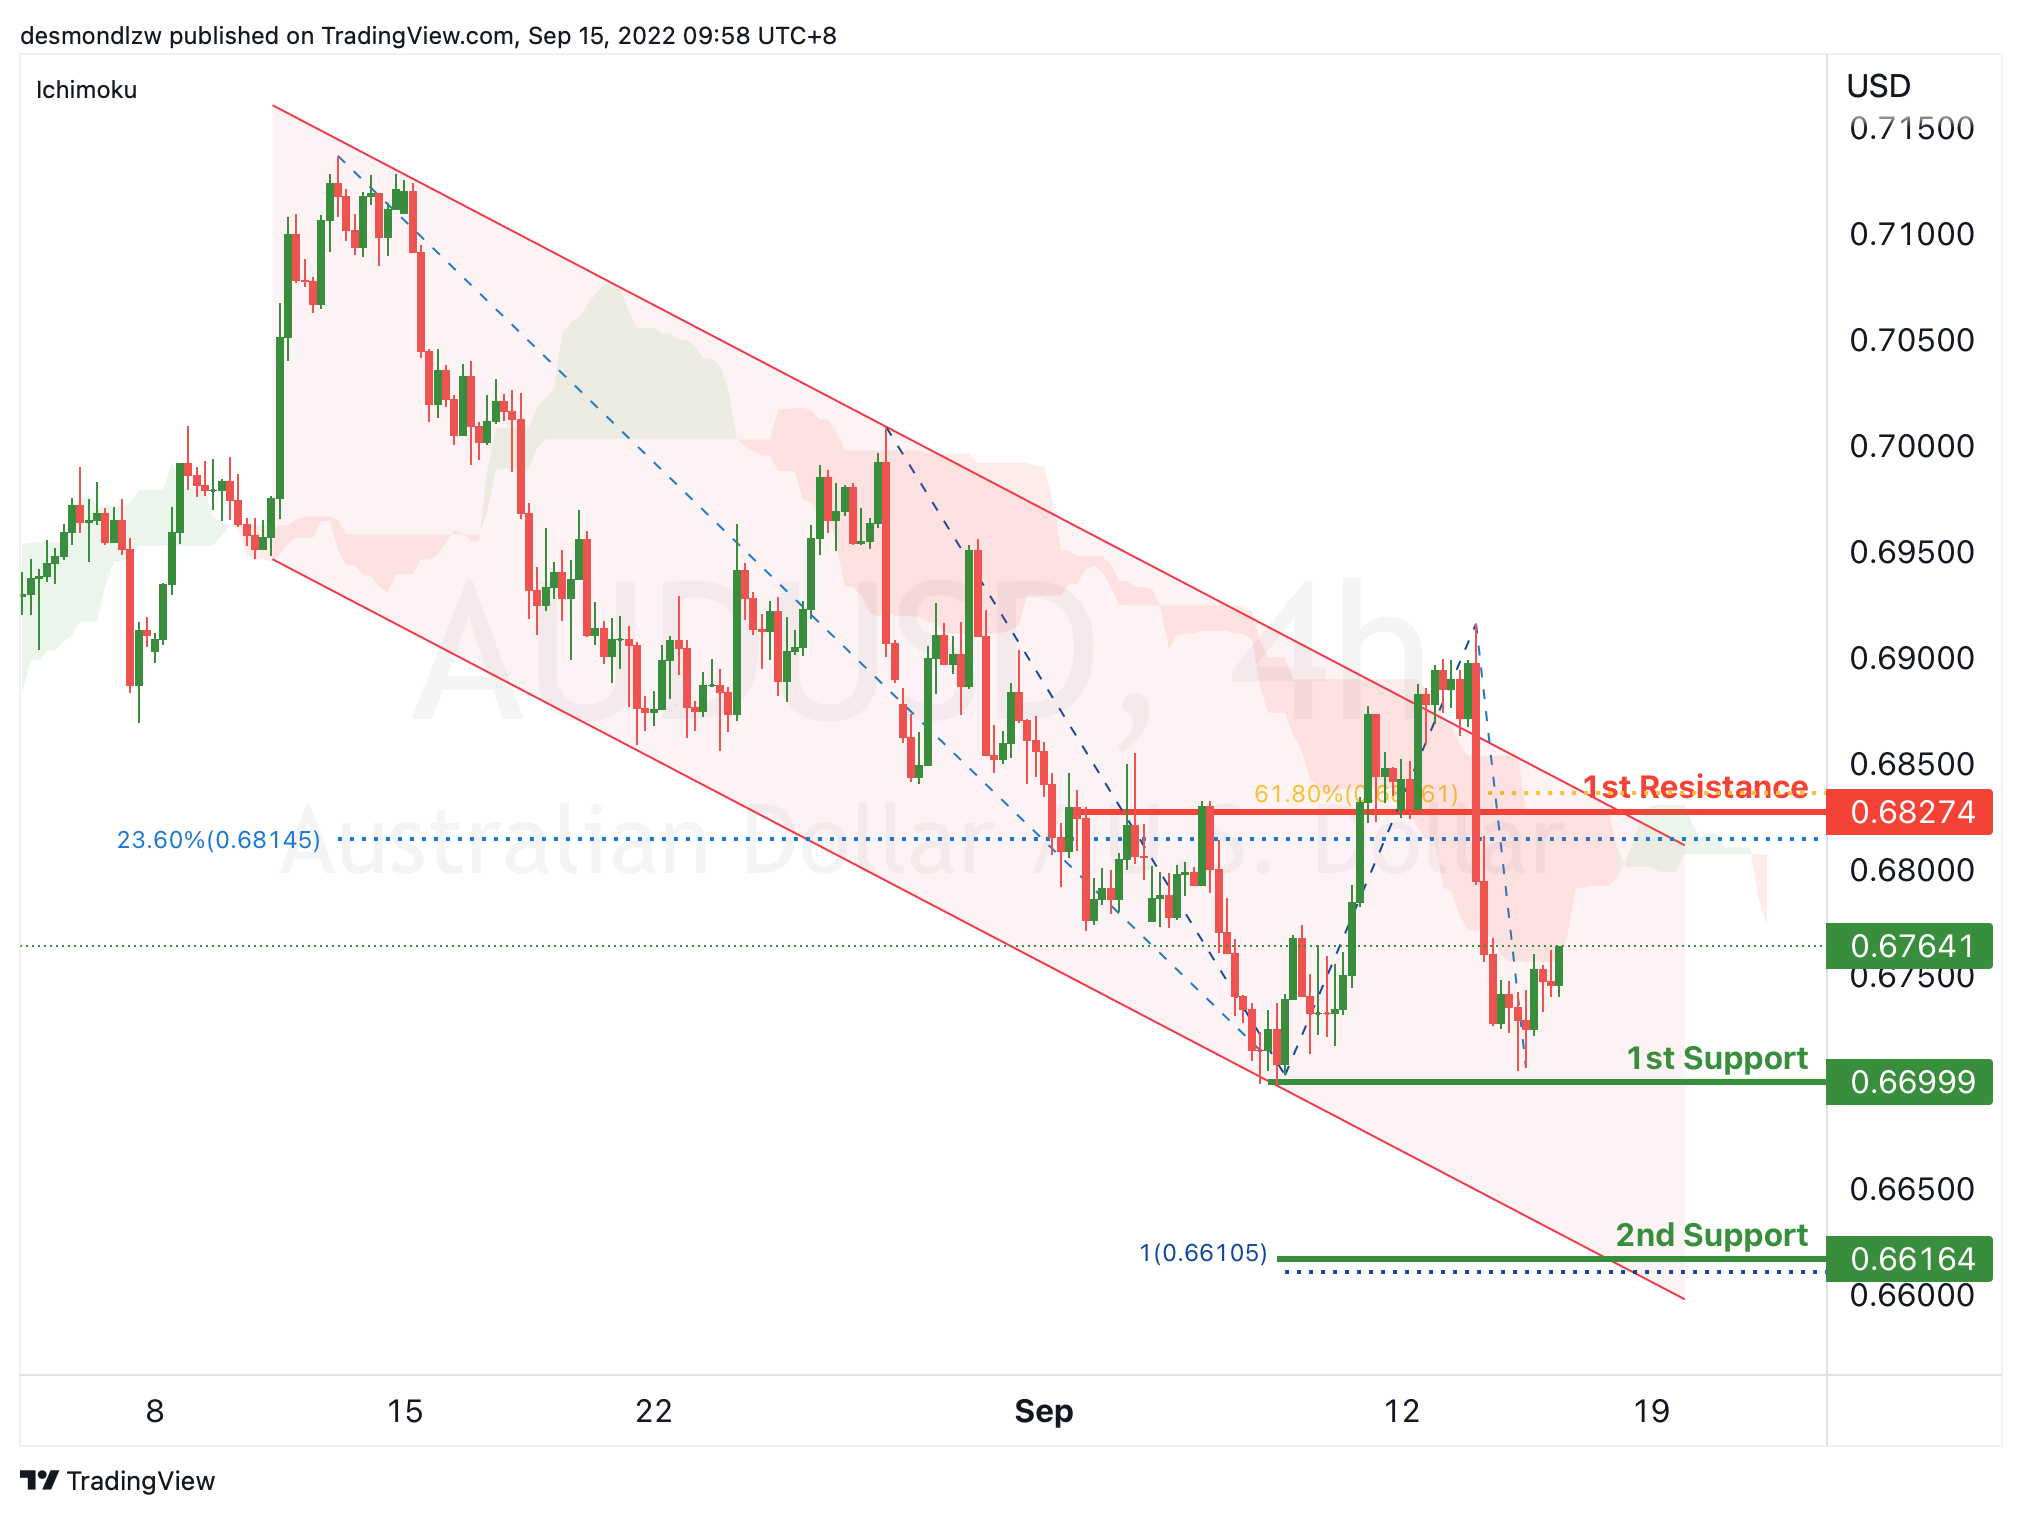
AUD/USD:
On the H4, with the price moving within the descending channel and below ichimoku cloud, we have a bearish bias that the price may drop to the 1st support at 0.66999, which is in line with the previous swing lows. If the 1st support level is broken, the 2nd support could be at 0.66164, where the 100% fibonacci projection is. Alternatively, the price may rise to the 1st resistance at 0.68274, which is in line with the 23.6% fibonacci retracement, 61.8% fibonacci retracement and overlap resistance.
Areas of consideration
- H4 1st support at 0.66999
- H4 2nd support at 0.66164
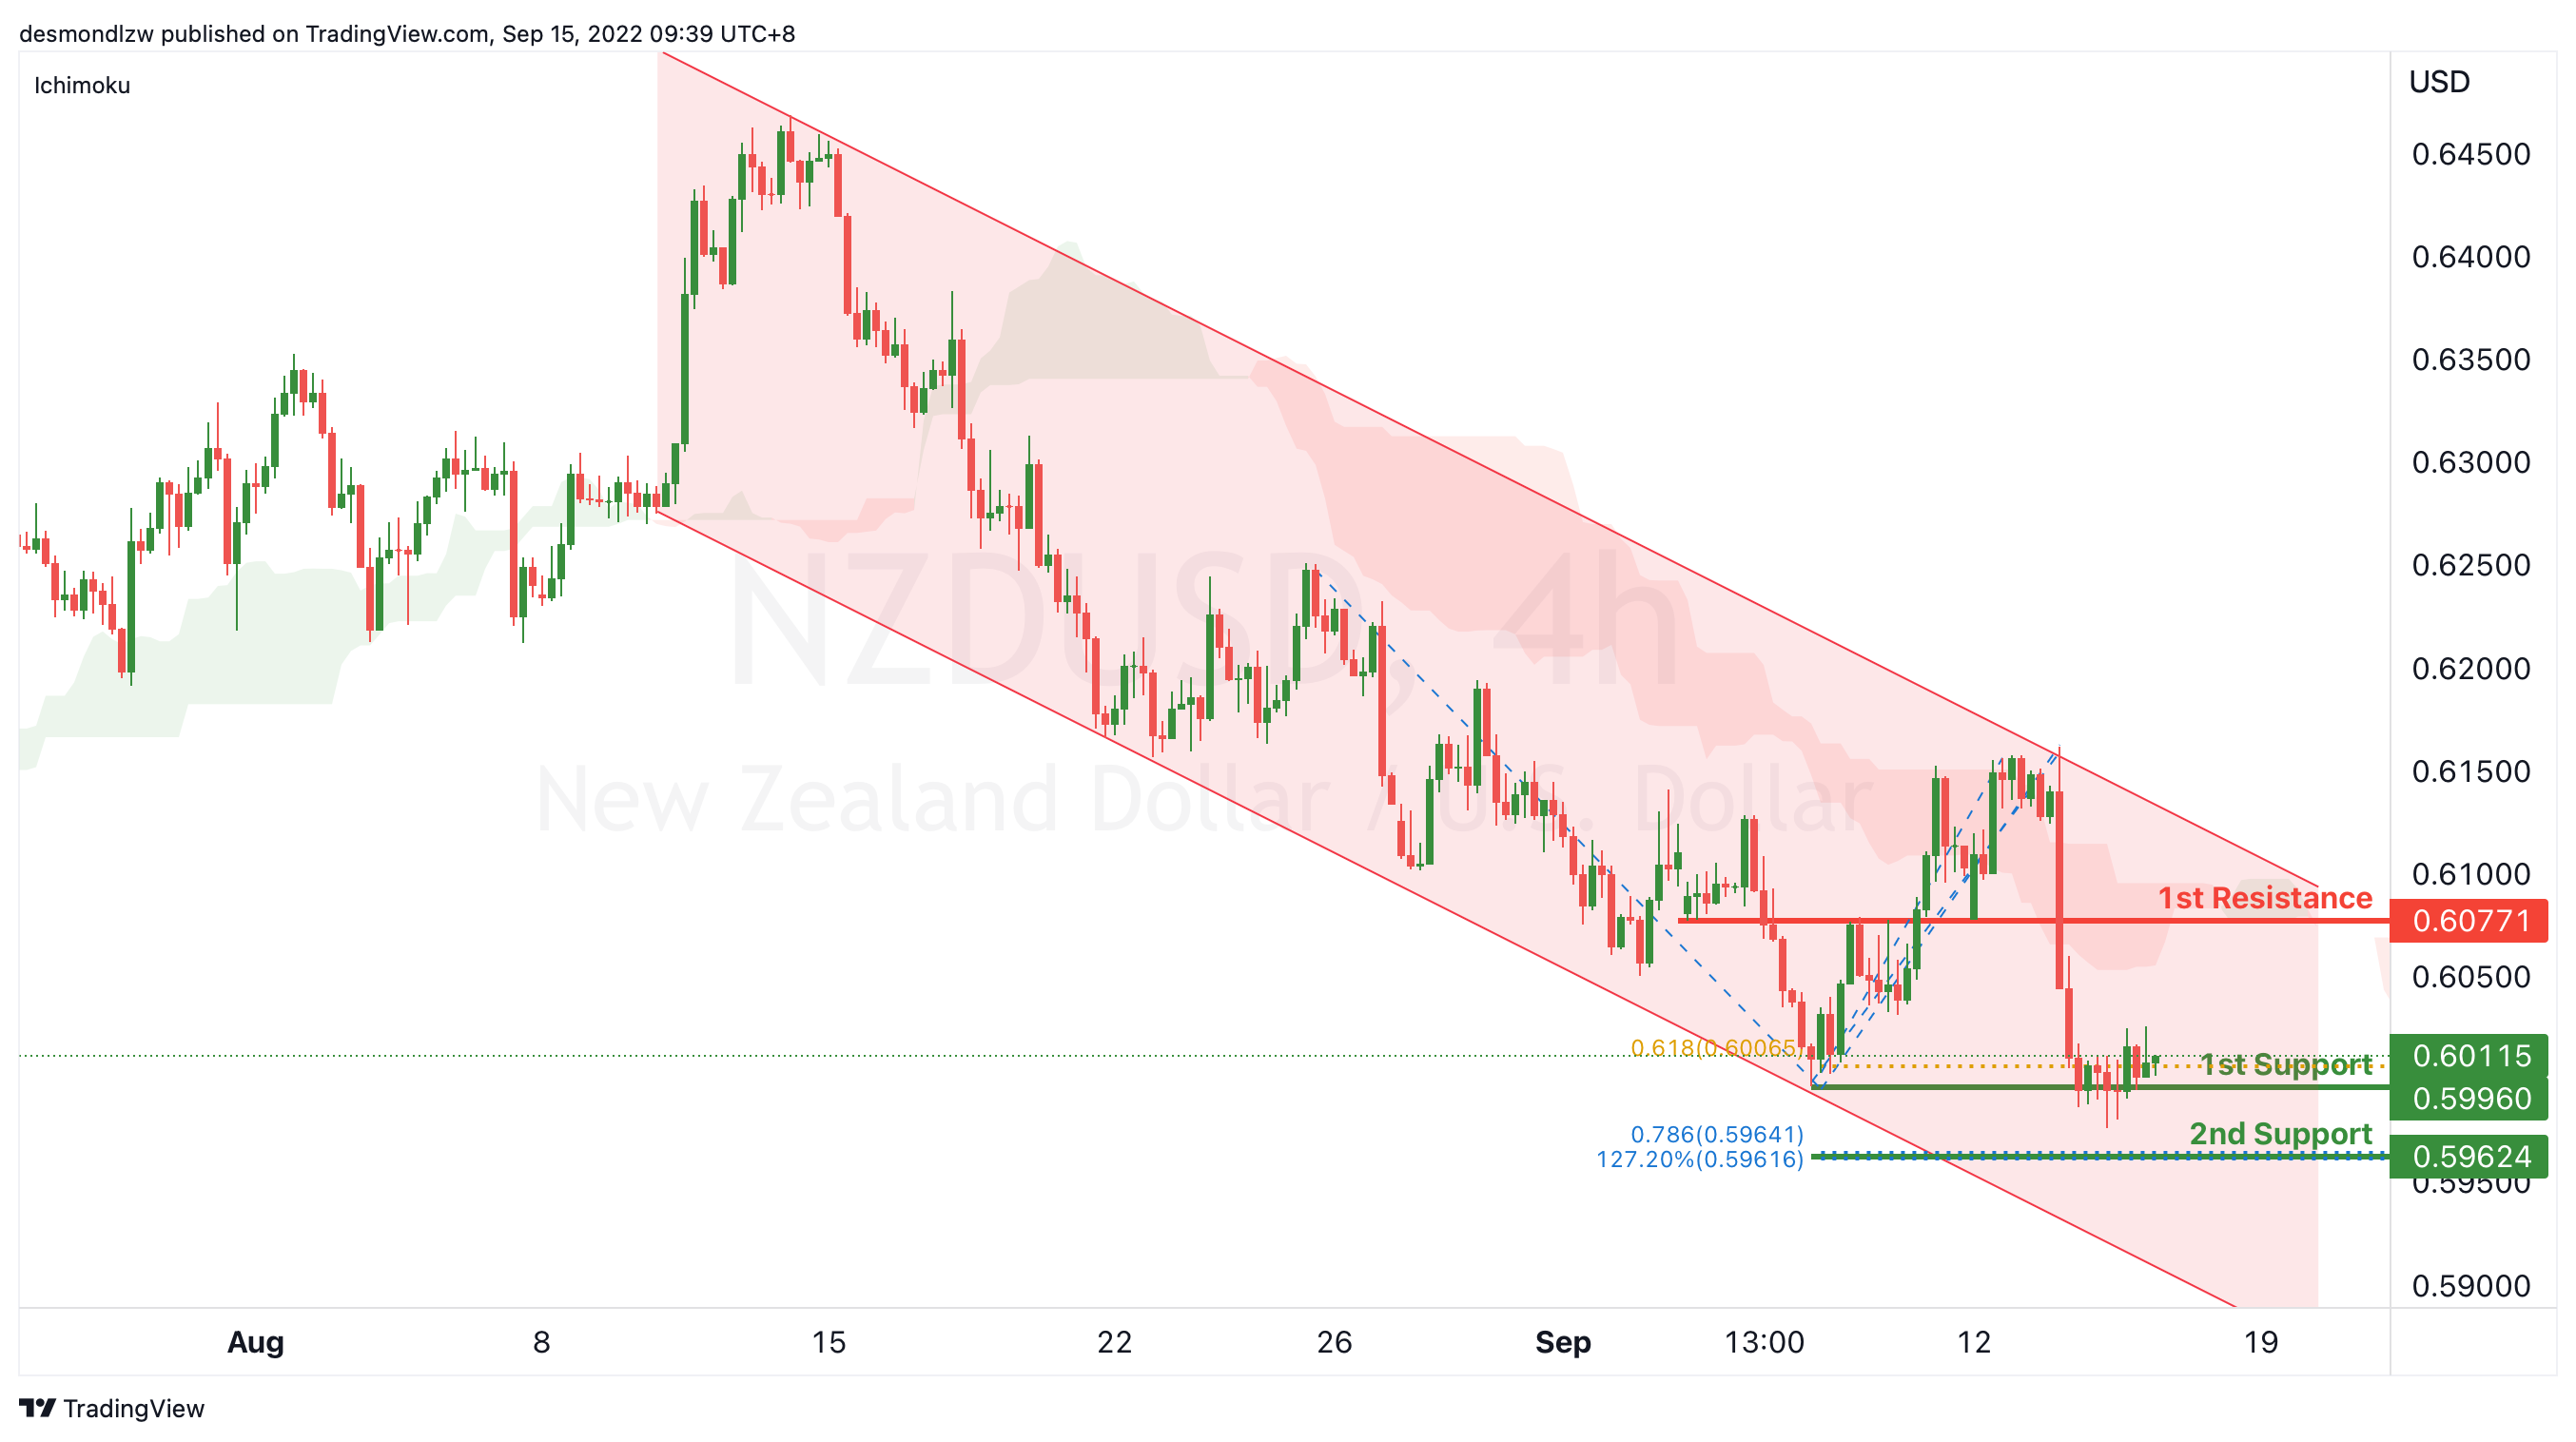
NZD/USD:
On the H4, with the price moving within the descending channel and below ichimoku cloud, we have a bearish bias that the price may drop from the 1st support at 0.59960, which is in line with the swing low and 61.8% fibonacci projection to the 2nd support at 0.59624, where the 78.6% fibonacci projection and 127.2% fibonacci extension are. Alternatively, the price may rise to the 1st resistance at 0.60771, which is in line with the overlap resistance, 61.8% fibonacci retracement.
Areas of consideration:
- H4 time frame, 1st support at 0.59960
- H4 time frame, 2nd support at 0.59624
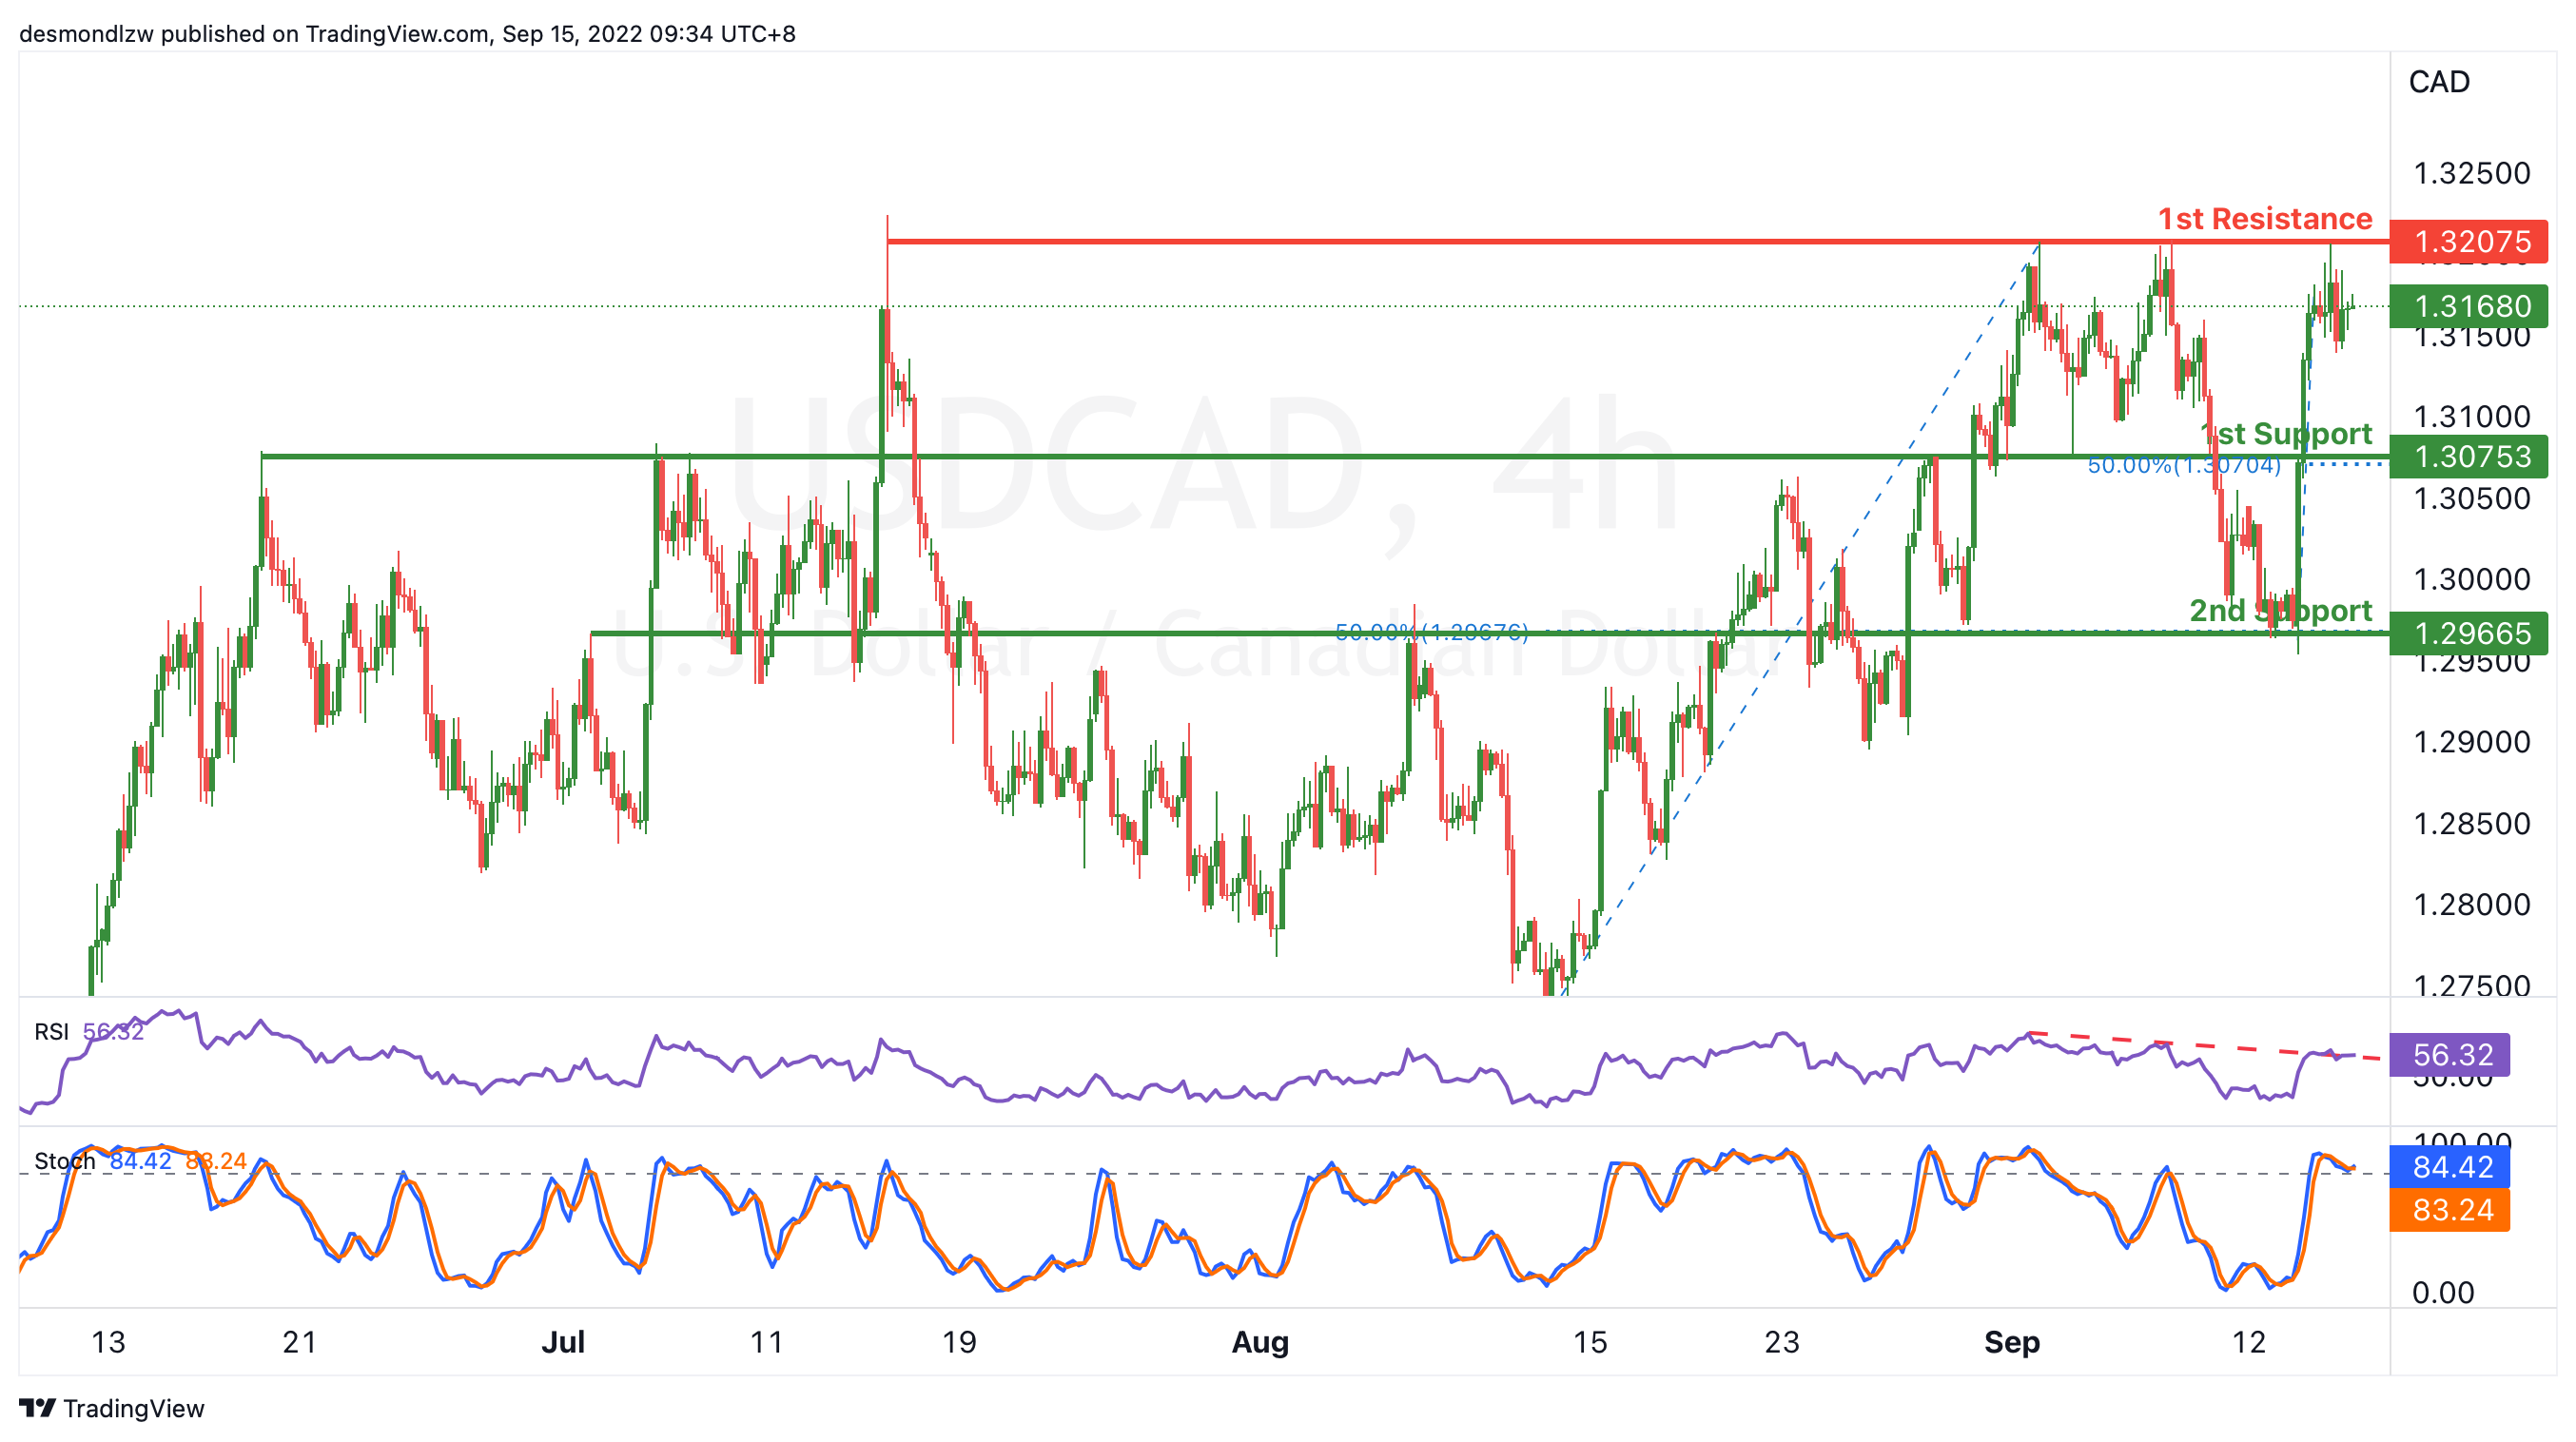
USD/CAD:
On the H4, the price the RSI is testing the descending trendline and stoch is over 80, we have a bearish bias that the price may pull back from the 1st resistance and drop to the 1st support at 1.30753, which is in line with the 50% fibonacci retracement and overlap support. If the 1st support is broken, the next support level could be at 1.29665, where the 50% fibonacci retracement and overlap support are. Alternatively, the price may continue the ascending trend and test the 1st resistance at 1.32075, which is in line with the swing highs.
Areas of consideration:
- H4 time frame, 1st resistance at 1.32075
- H4 time frame, 1st support at 1.30753
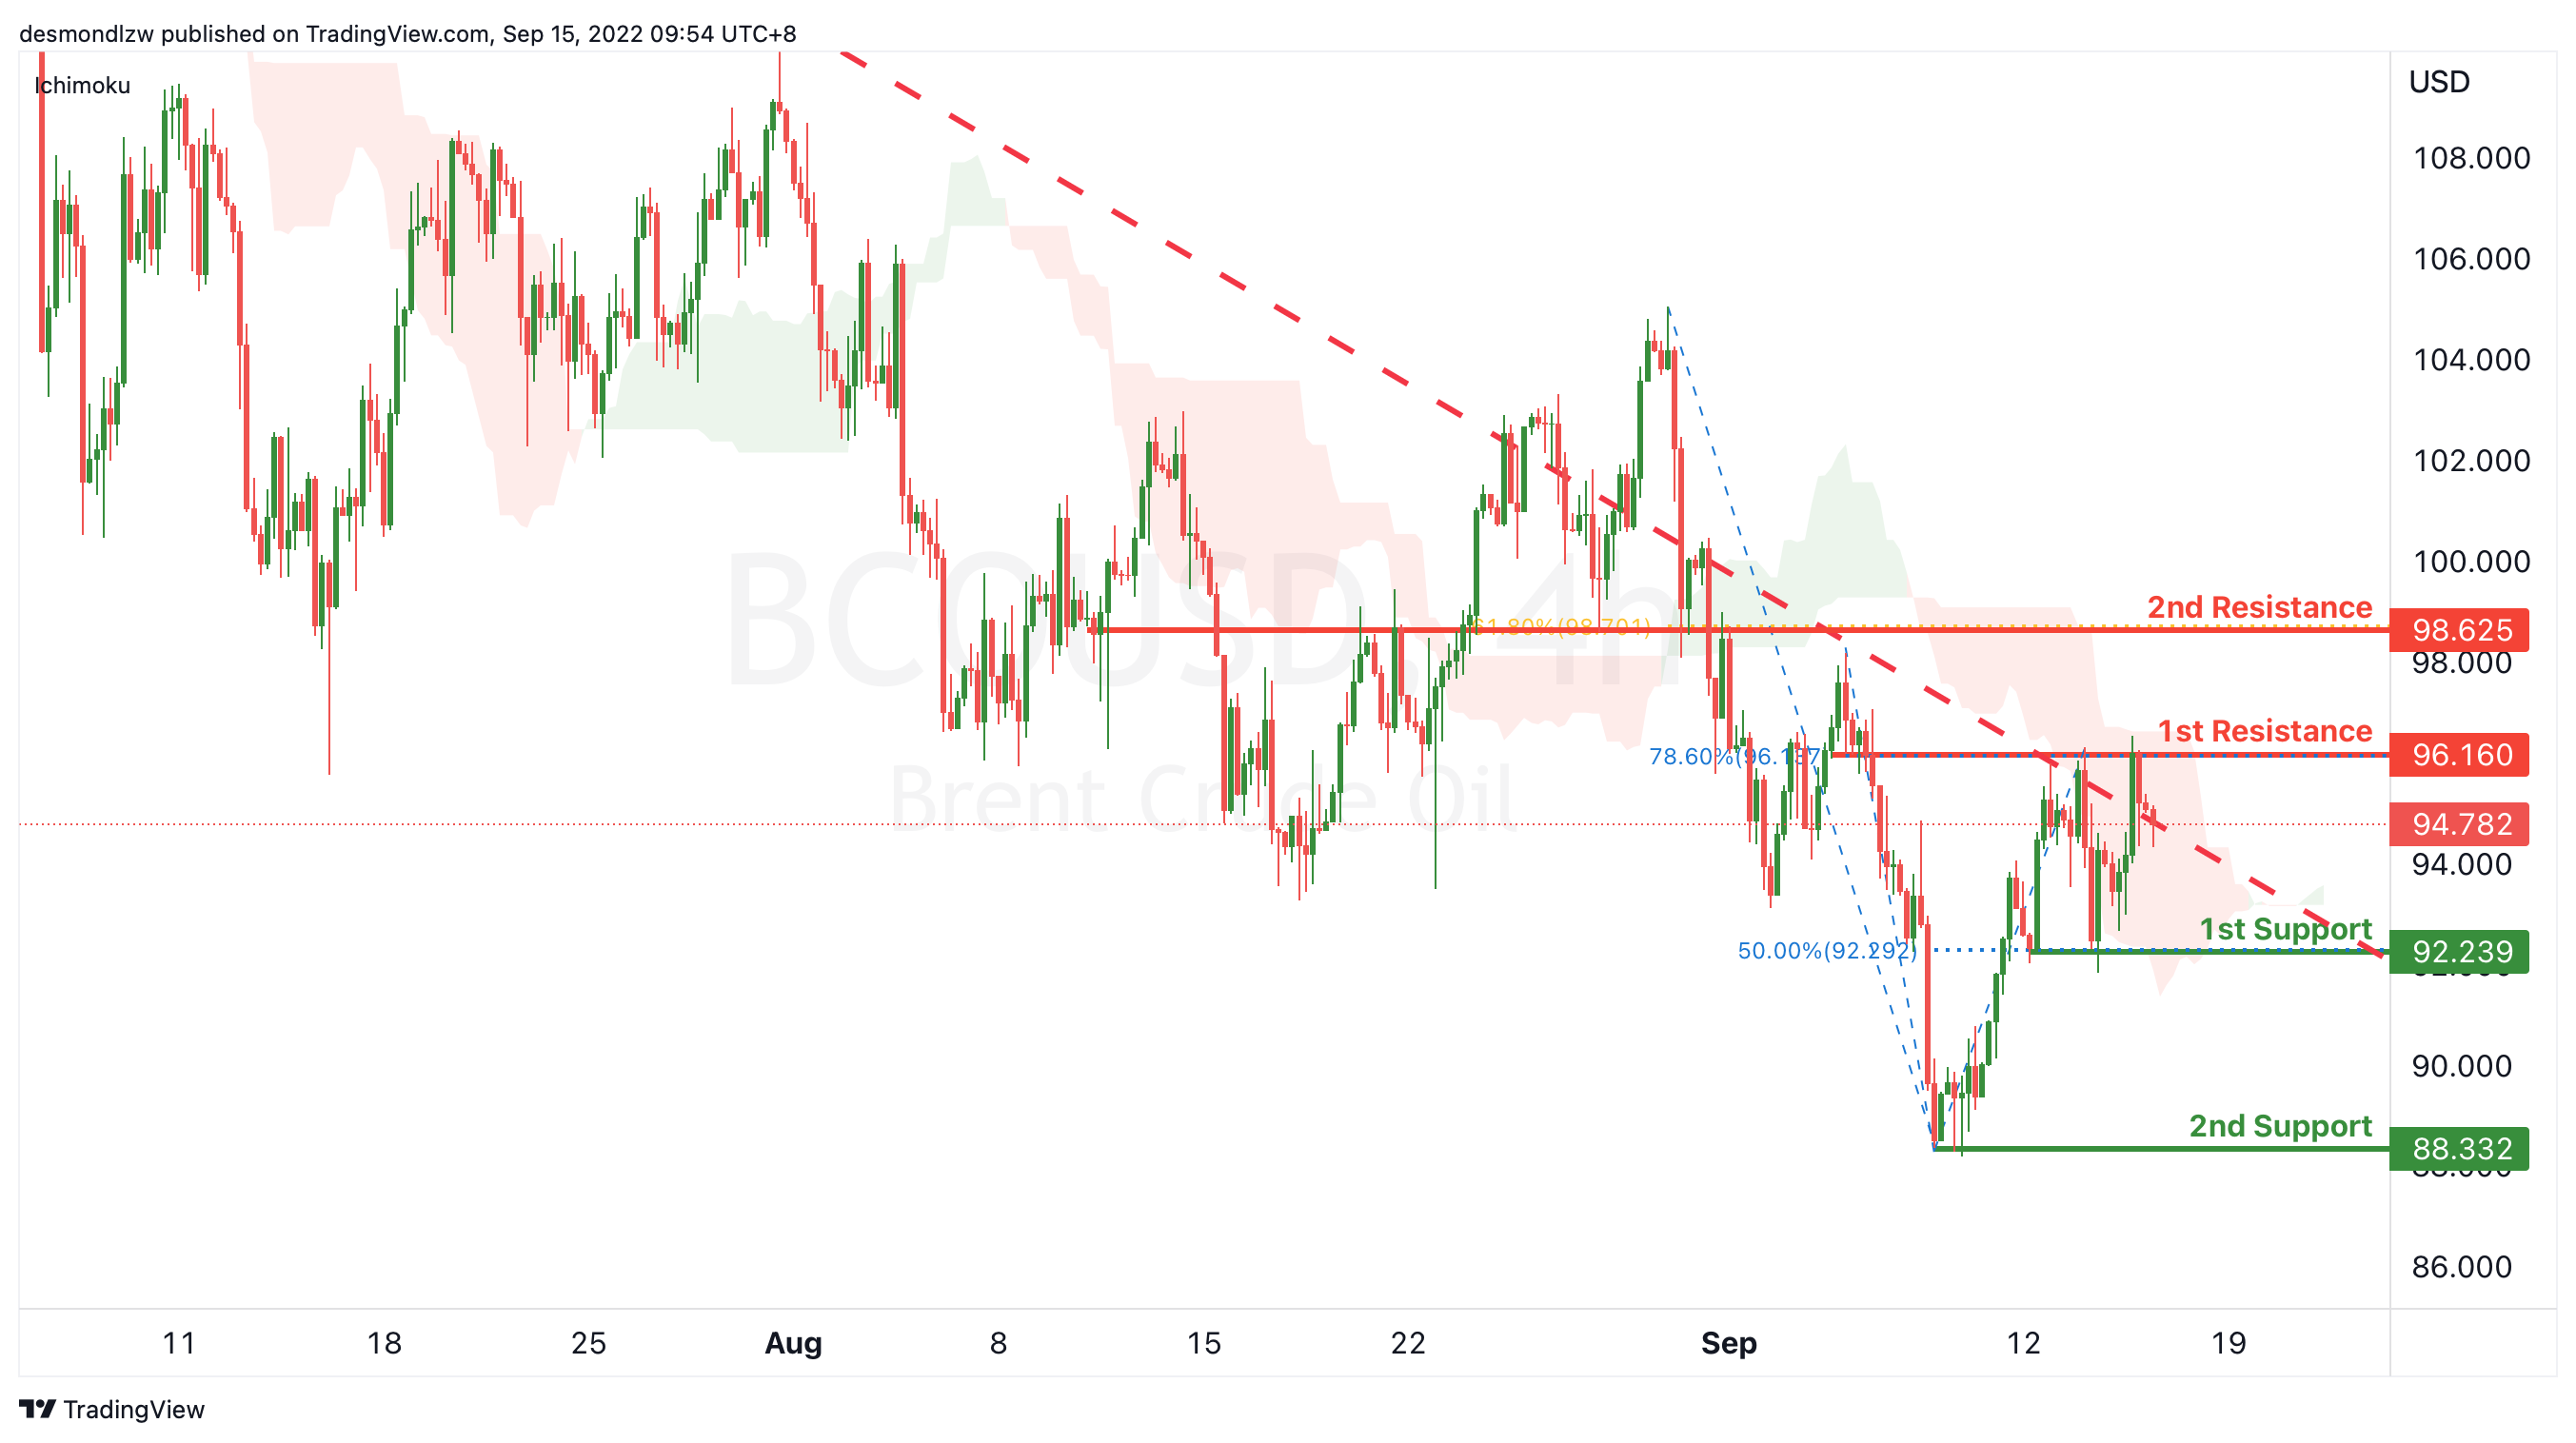
OIL:
On the H4, with price below ichimoku, dropping from the 1st resistance and within the long term descending trendline, we have a weak bearish bias that the price may drop to the 1st support at 92.239, where the pullback support and 50% fibonacci retracement are. If the price can break this resistance level, the next support level could be at 88.332, which is in line with the swing low. Alternatively, the price may rise to the 1st resistance at 96.160, which is in line with the 78.6% fibonacci retracement and overlap resistance. If the 1st resistance is broken, the 2nd resistance could be at 98.625, which is in line with the 618% fibonacci retracement and overlap resistance.
Areas of consideration:
- H4 time frame, 1st resistance at 96.160
- H4 time frame, 1st support at 92.239
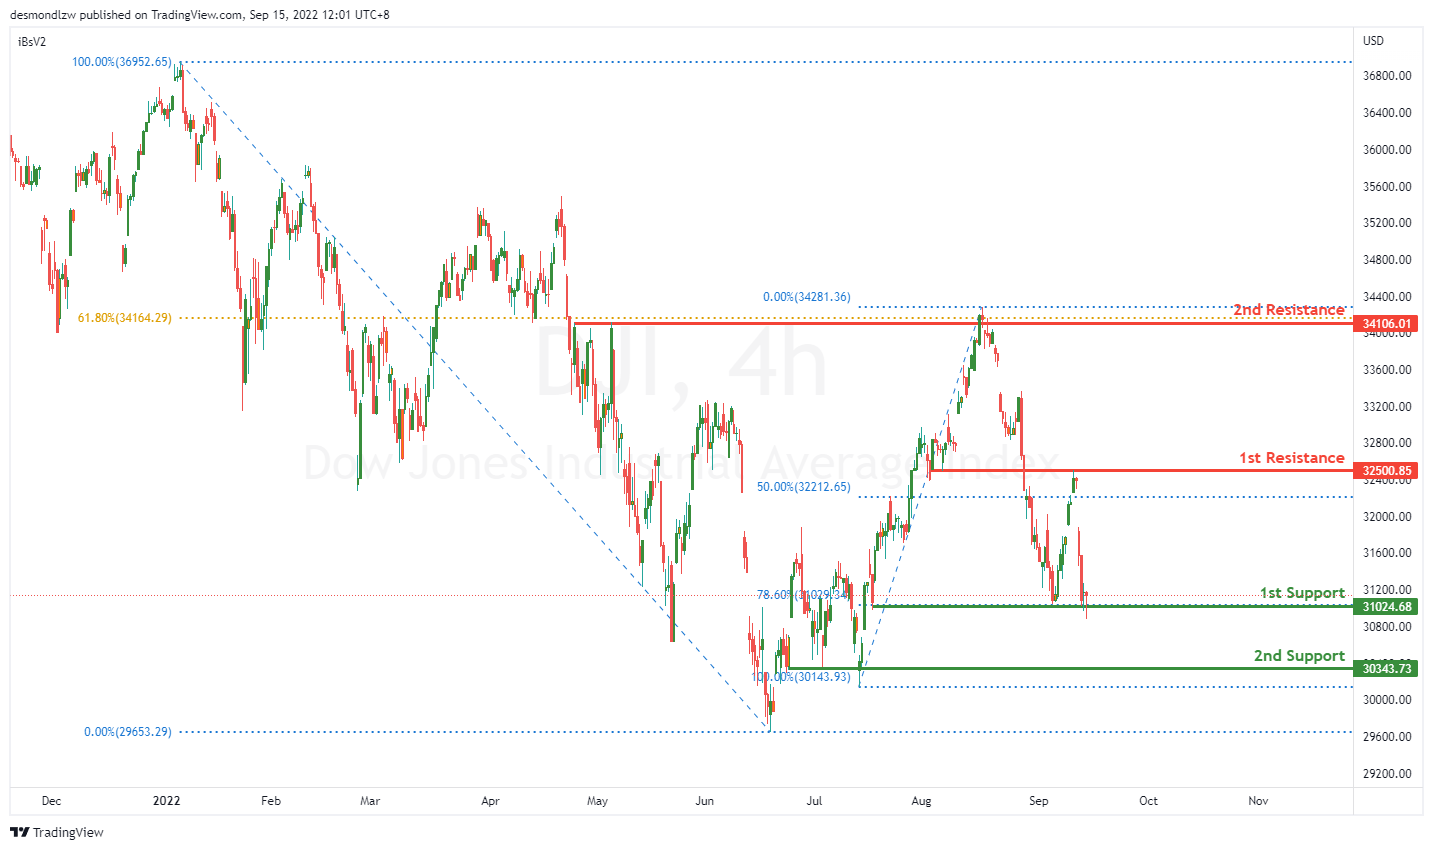
Dow Jones Industrial Average:
On the H4, price is reflected off nicely at the first resistance at 32500.85 where the 50% Fibonacci retracement is and broke right through the first support at 31029.34 where the 78.6% Fibonacci retracement is. Price might continue heading downwards towards the second support at 30343.73 where the previous swing low is.
Areas of consideration:
- H4 time frame, 1st support at 31029.34
- H4 time frame, 2nd support at 30343.73
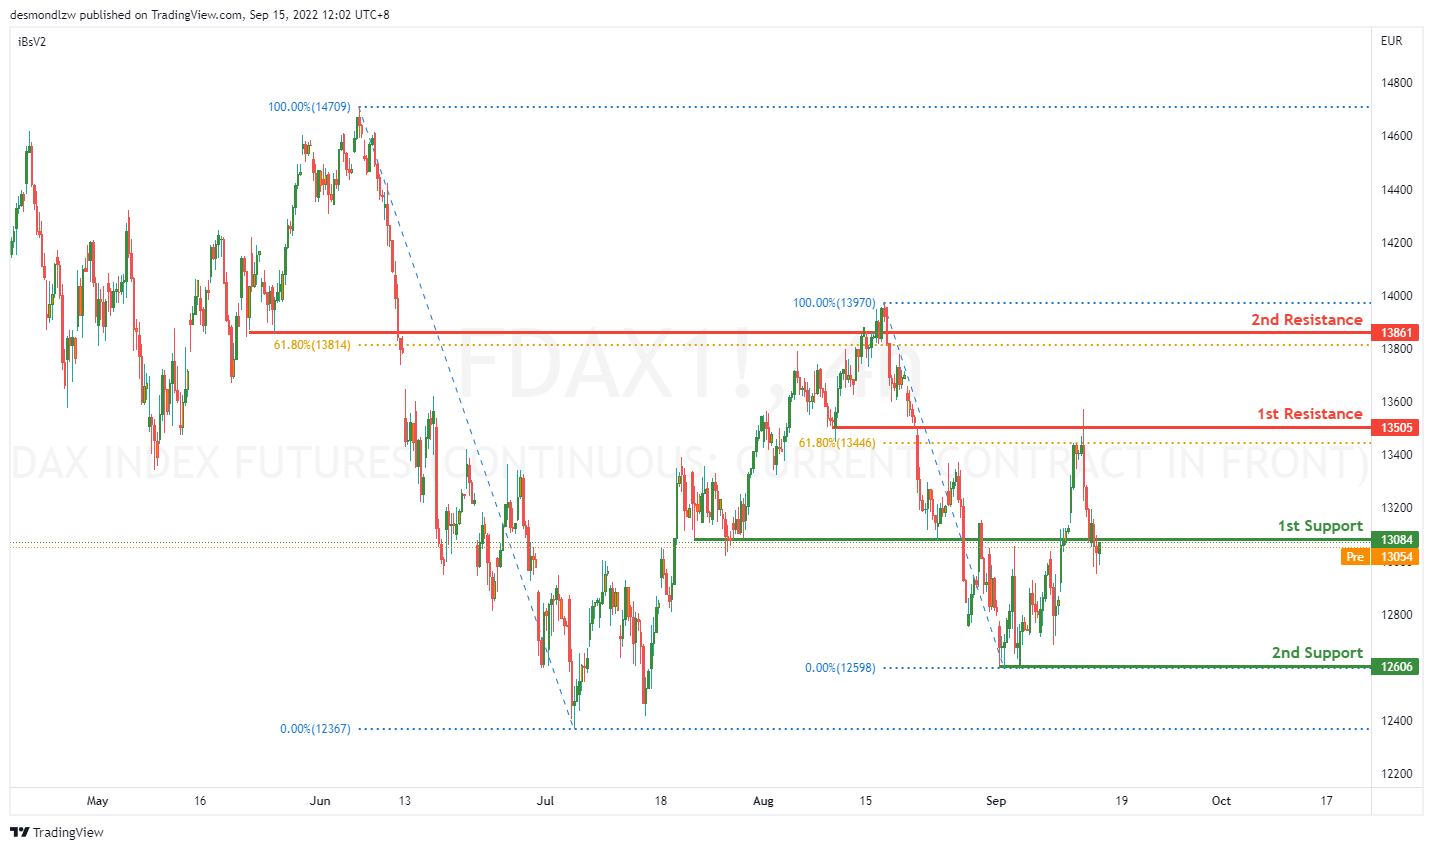
DAX:
On the H4, price has reflected of the first resistance at 13505 where the 61.8% retracement is and got a big reaction breaking through the first support at 13084. Price might continue going down towards the second support at 12606 where the swing low is.
Areas of consideration:
- H4 time frame, 1st support at 13084
- H4 time frame, 2nd support at 12606
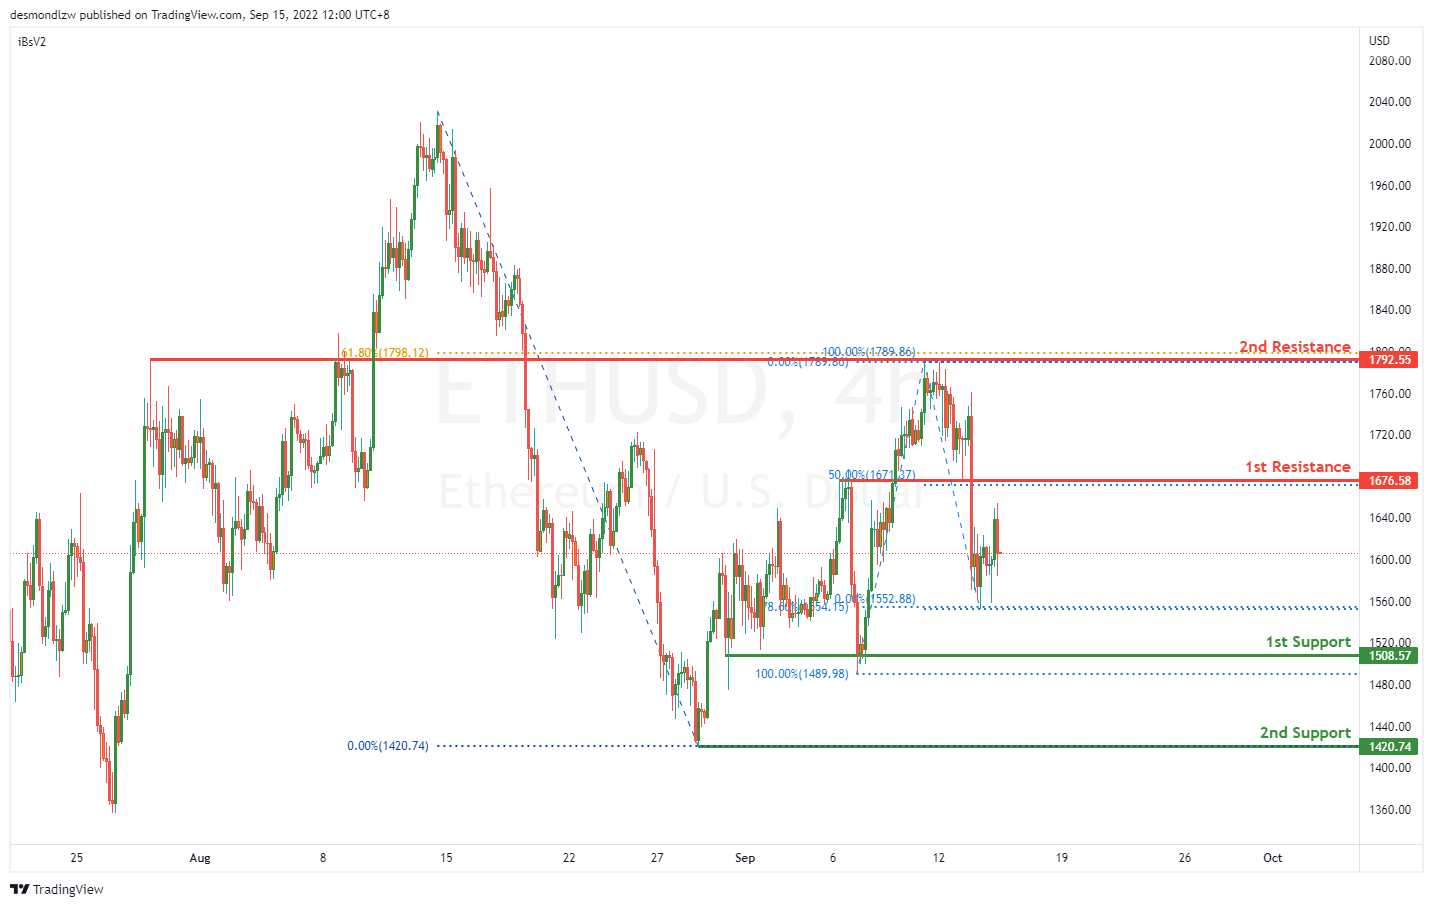
ETHUSD:
On the H4, price has reflected off the second resistance at 1789.8 where the 61.8% Fibonacci level is and pulled back hence we are currently bearish bias. Price look like it’s moving toward the first support at 1508.57 where the previous swing low is at. If bearish momentum continues it should bring price to the second support at 1420.74 where the previous swing low sits. Alternatively price just touched the 78.6% Fibonacci projection at 1554.15, so it could come back to test the first resistance at 1676.58 where the 50% retracement is.
Areas of consideration:
- H4 time frame, 1st resistance of 1676.58
- H4 time frame, 1st support at 1508.57
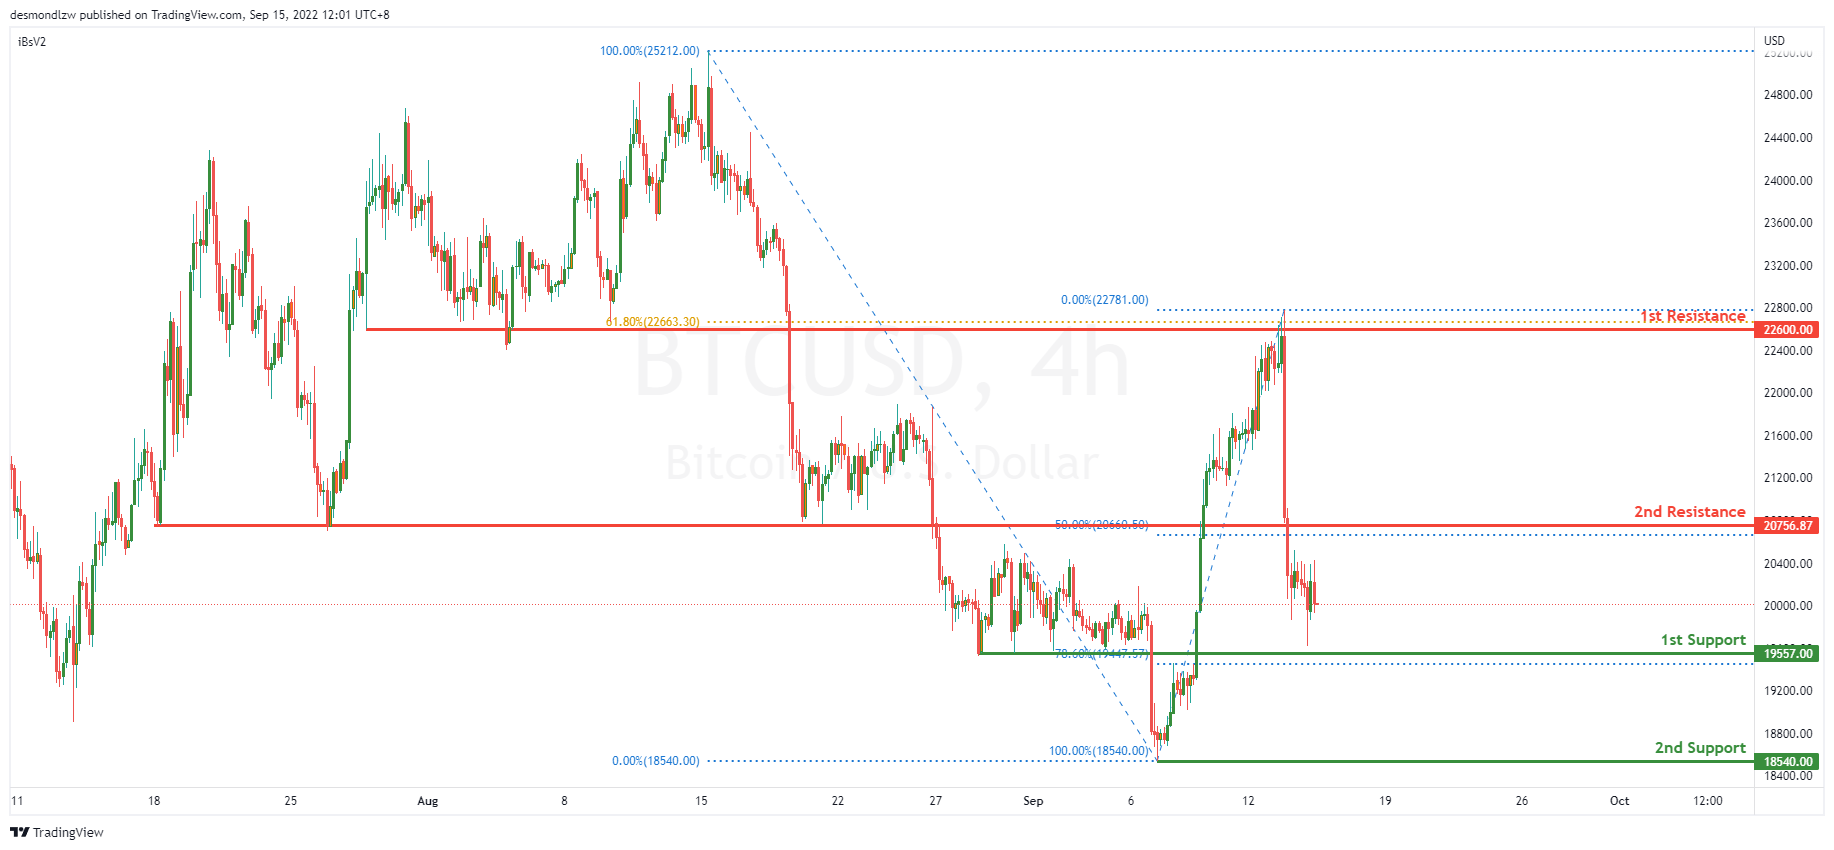
BTCUSD:
On the H4, price reflected off the first resistance at 22600.00, broke past the second resistance at 20756.87 and is moving in a bearish momentum hence we are bearish. Price is moving toward the first support at 19557.00 where the 78.6% retracement sits. If bearish momentum continues, it should bring price to the second support 18540.00 where the previous swing low sits. Alternatively, price could pull back to test the second resistance at 20756.87 where the 50% retracement is.
Areas of consideration:
- H4 time frame, 1st resistance of 22600.00
- H4 time frame, 1st support at 19557.00
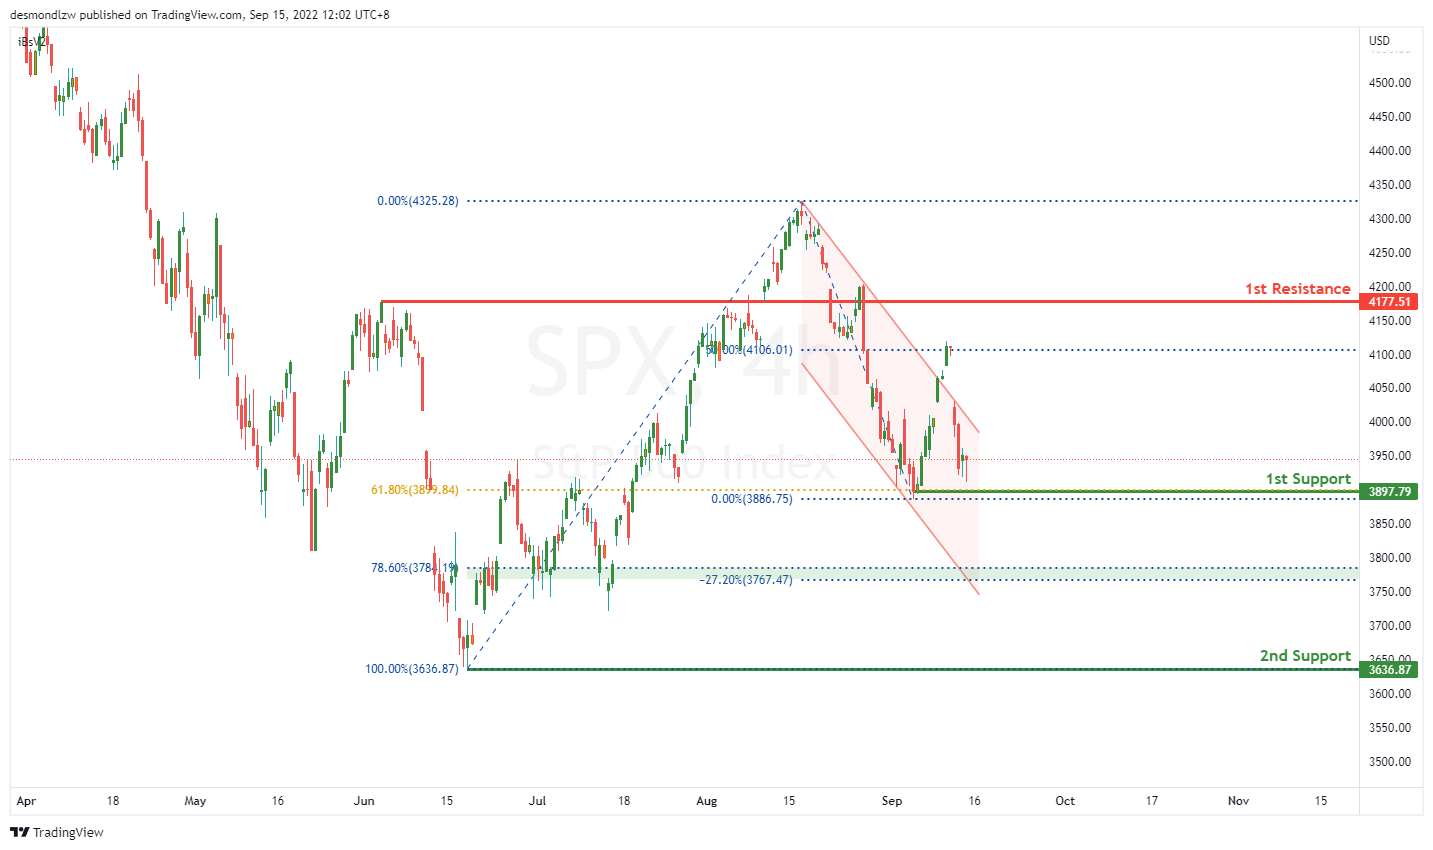
S&P 500:
On the H4, the price reversed from the 4100 price area forming a bearish channel, with the price falling towards the 1st support are of 3900. With our bearish bias still valid, as price trades back towards the 61.8% Fibonacci retracement, look for price to test the 1st support area. If the price breaks below the 1st support level, the price could fall towards the 78.6% Fibonacci retracement level of 3784.19. There could be some pullback up towards the 1st Support level area else it could head towards the 2nd support of 3636.87. As the price falls towards the 2nd support, it could find some pullback towards the 78.6% Fibonacci retracement pullback support area.
Areas of consideration:
- H4 time frame, 1st support at 3900
- H4 time frame, 2nd support at 3636.87


