
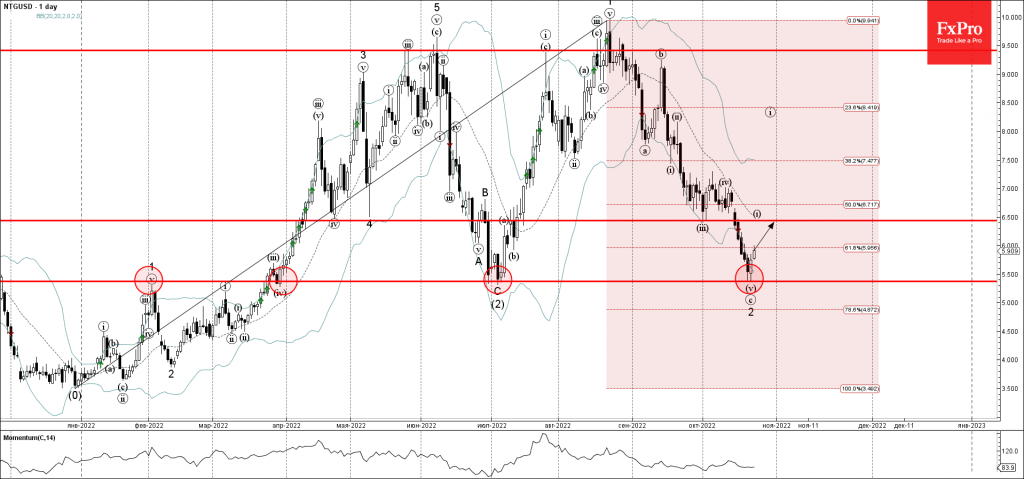
- Natural gas reversed from support level 5.370
- Likely to rise to resistance level 6.500
Natural gas recently reversed up from the support level 5.370 (previous multi-month low from July), standing near the lower daily Bollinger Band.
The upward reversal from the support level 5.370 created the daily candlesticks pattern Piercing Line, which started the active impulse wave 3.
Natural gas can be expected to rise further toward the next resistance level 6.5000 (former support from the start of October).


