
Hello fellow traders. In this technical article we’re going to take a look at the Elliott Wave charts charts of EURJPY published in members area of the website. As our members know EURJPY forex pair ended the cycle from the August low at 148.38 peak and now giving as correction. Recently EURJPY made short term recovery against the 148.38 peak that has unfolded as Elliott Wave Double Three Pattern. It made clear 7 swings from the lows and complete at the extreme zone. In further text we’re going to explain the Elliott Wave pattern and forecast
Before we take a look at the real market example, let’s explain Elliott Wave Double Three pattern.
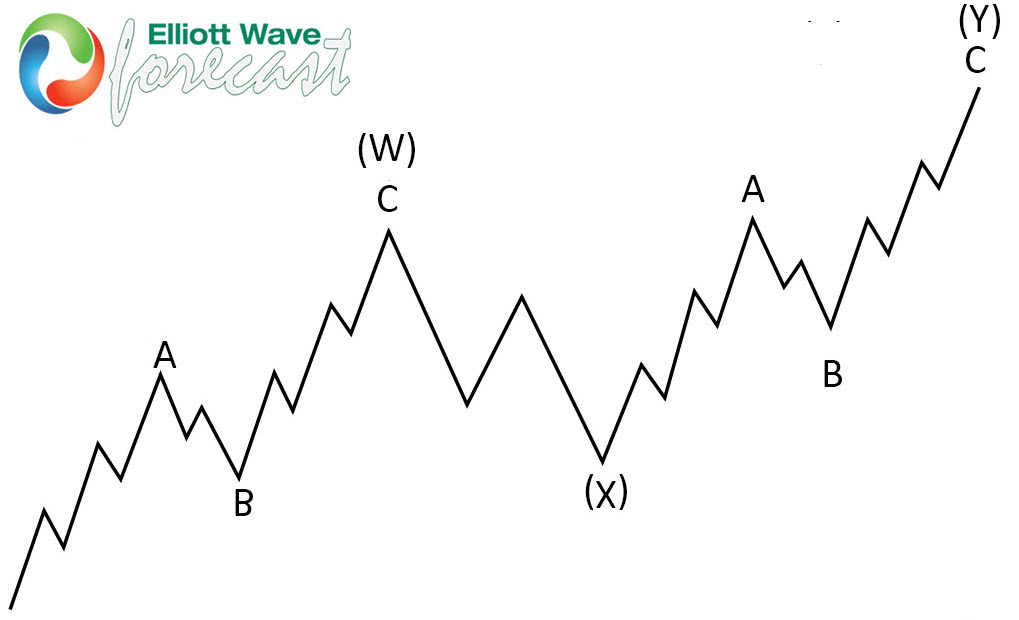
Elliott Wave Double Three Pattern
Double three is the common pattern in the market , also known as 7 swing structure. It’s a reliable pattern which is giving us good trading entries with clearly defined invalidation levels.
The picture below presents what Elliott Wave Double Three pattern looks like. It has (W),(X),(Y) labeling and 3,3,3 inner structure, which means all of these 3 legs are corrective sequences. Each (W) and (Y) are made of 3 swings , they’re having A,B,C structure in lower degree, or alternatively they can have W,X,Y labeling.
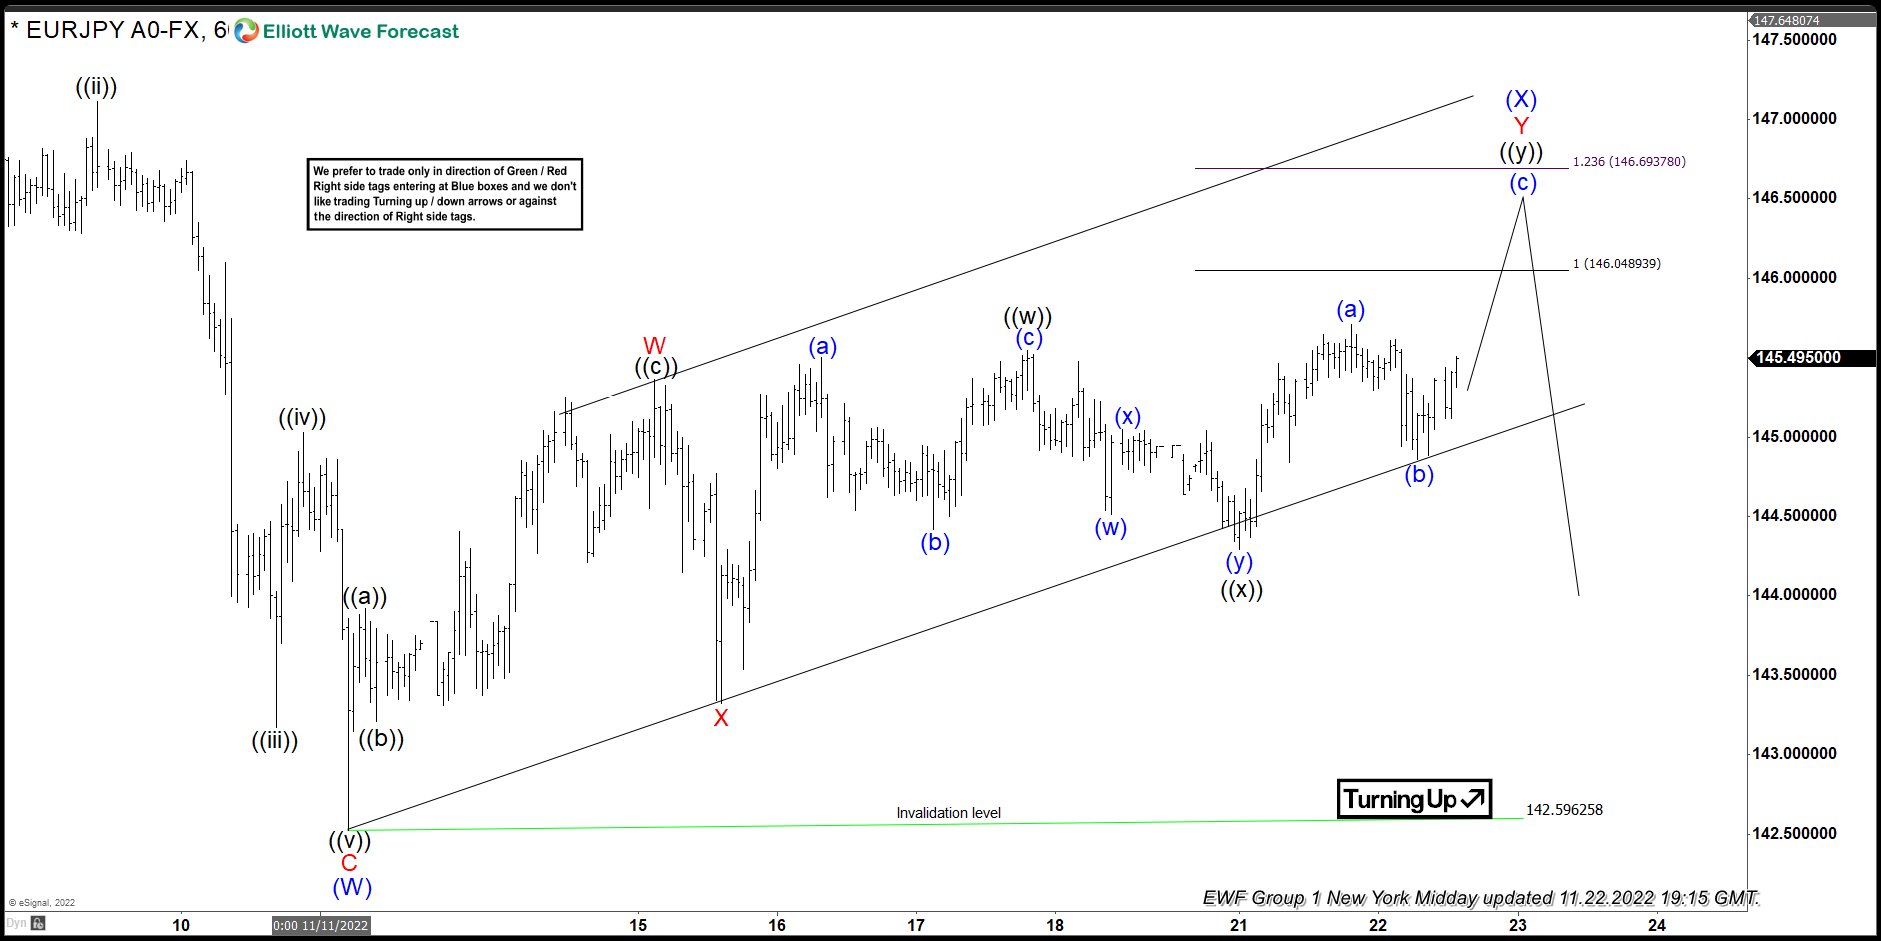
EURJPY 1h Hour Elliott Wave Analysis 11.22.2022
EURJPY is giving us (X) blue recovery that is unfolding as Elliott Wave Double Three Pattern. Correction has WXY red inner labeling. If we take a close look , we can see that price structure is still incomplete. We are missing another leg up tpward 146.048-146.693 to complete proposed correction. At that zone buyers should be ideally taking profits and sellers can appear again. Consequently , we expect to see reaction from the marked area. From mentioned zone we can get either decline toward new lows or larger 3 waves pull back at least.
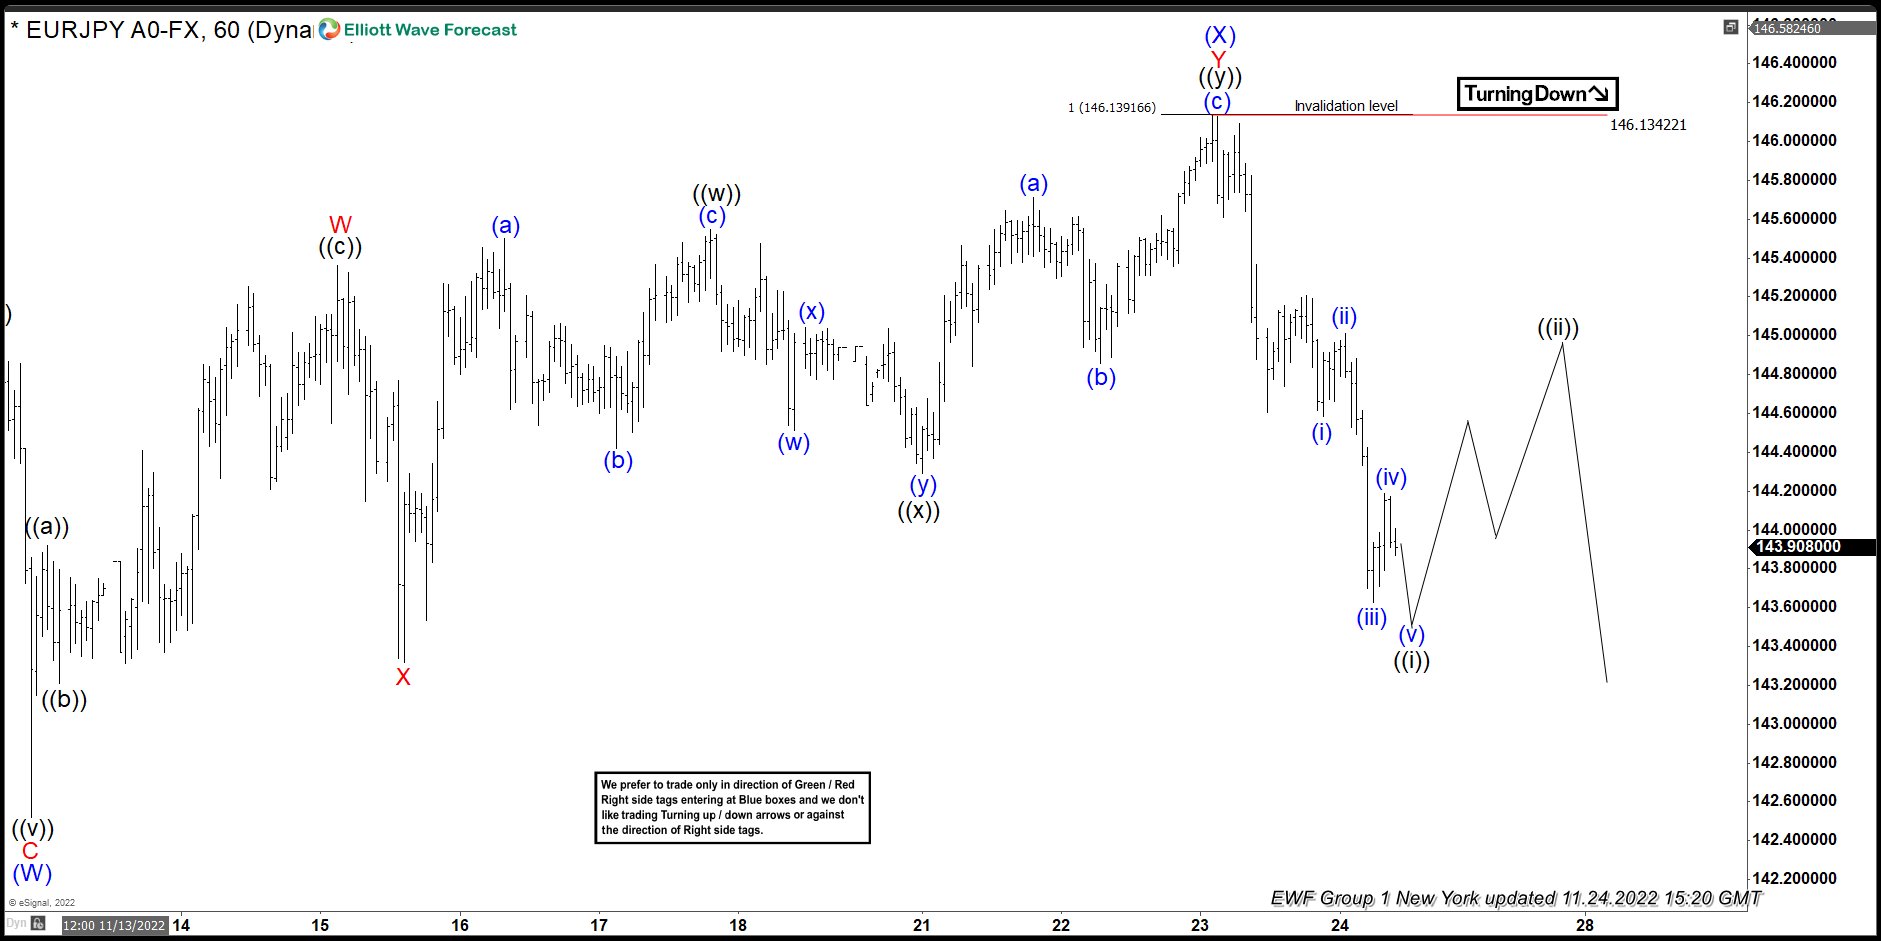
EURJPY 1h Hour Elliott Wave Analysis 11.24.2022
Sellers appeared right at the marked extreme zone : 146.048-146.693 and we got good reaction. Current view suggests (X) blue connector completed at 146.134 high. We are about to complete short term cycle from the mentioned peak and expecting to see 3 waves bounce. The price now must hold below 146.13 peak in order to keep proposed view intact, otherwise larger correction can be taking place.


