
USD/JPY:
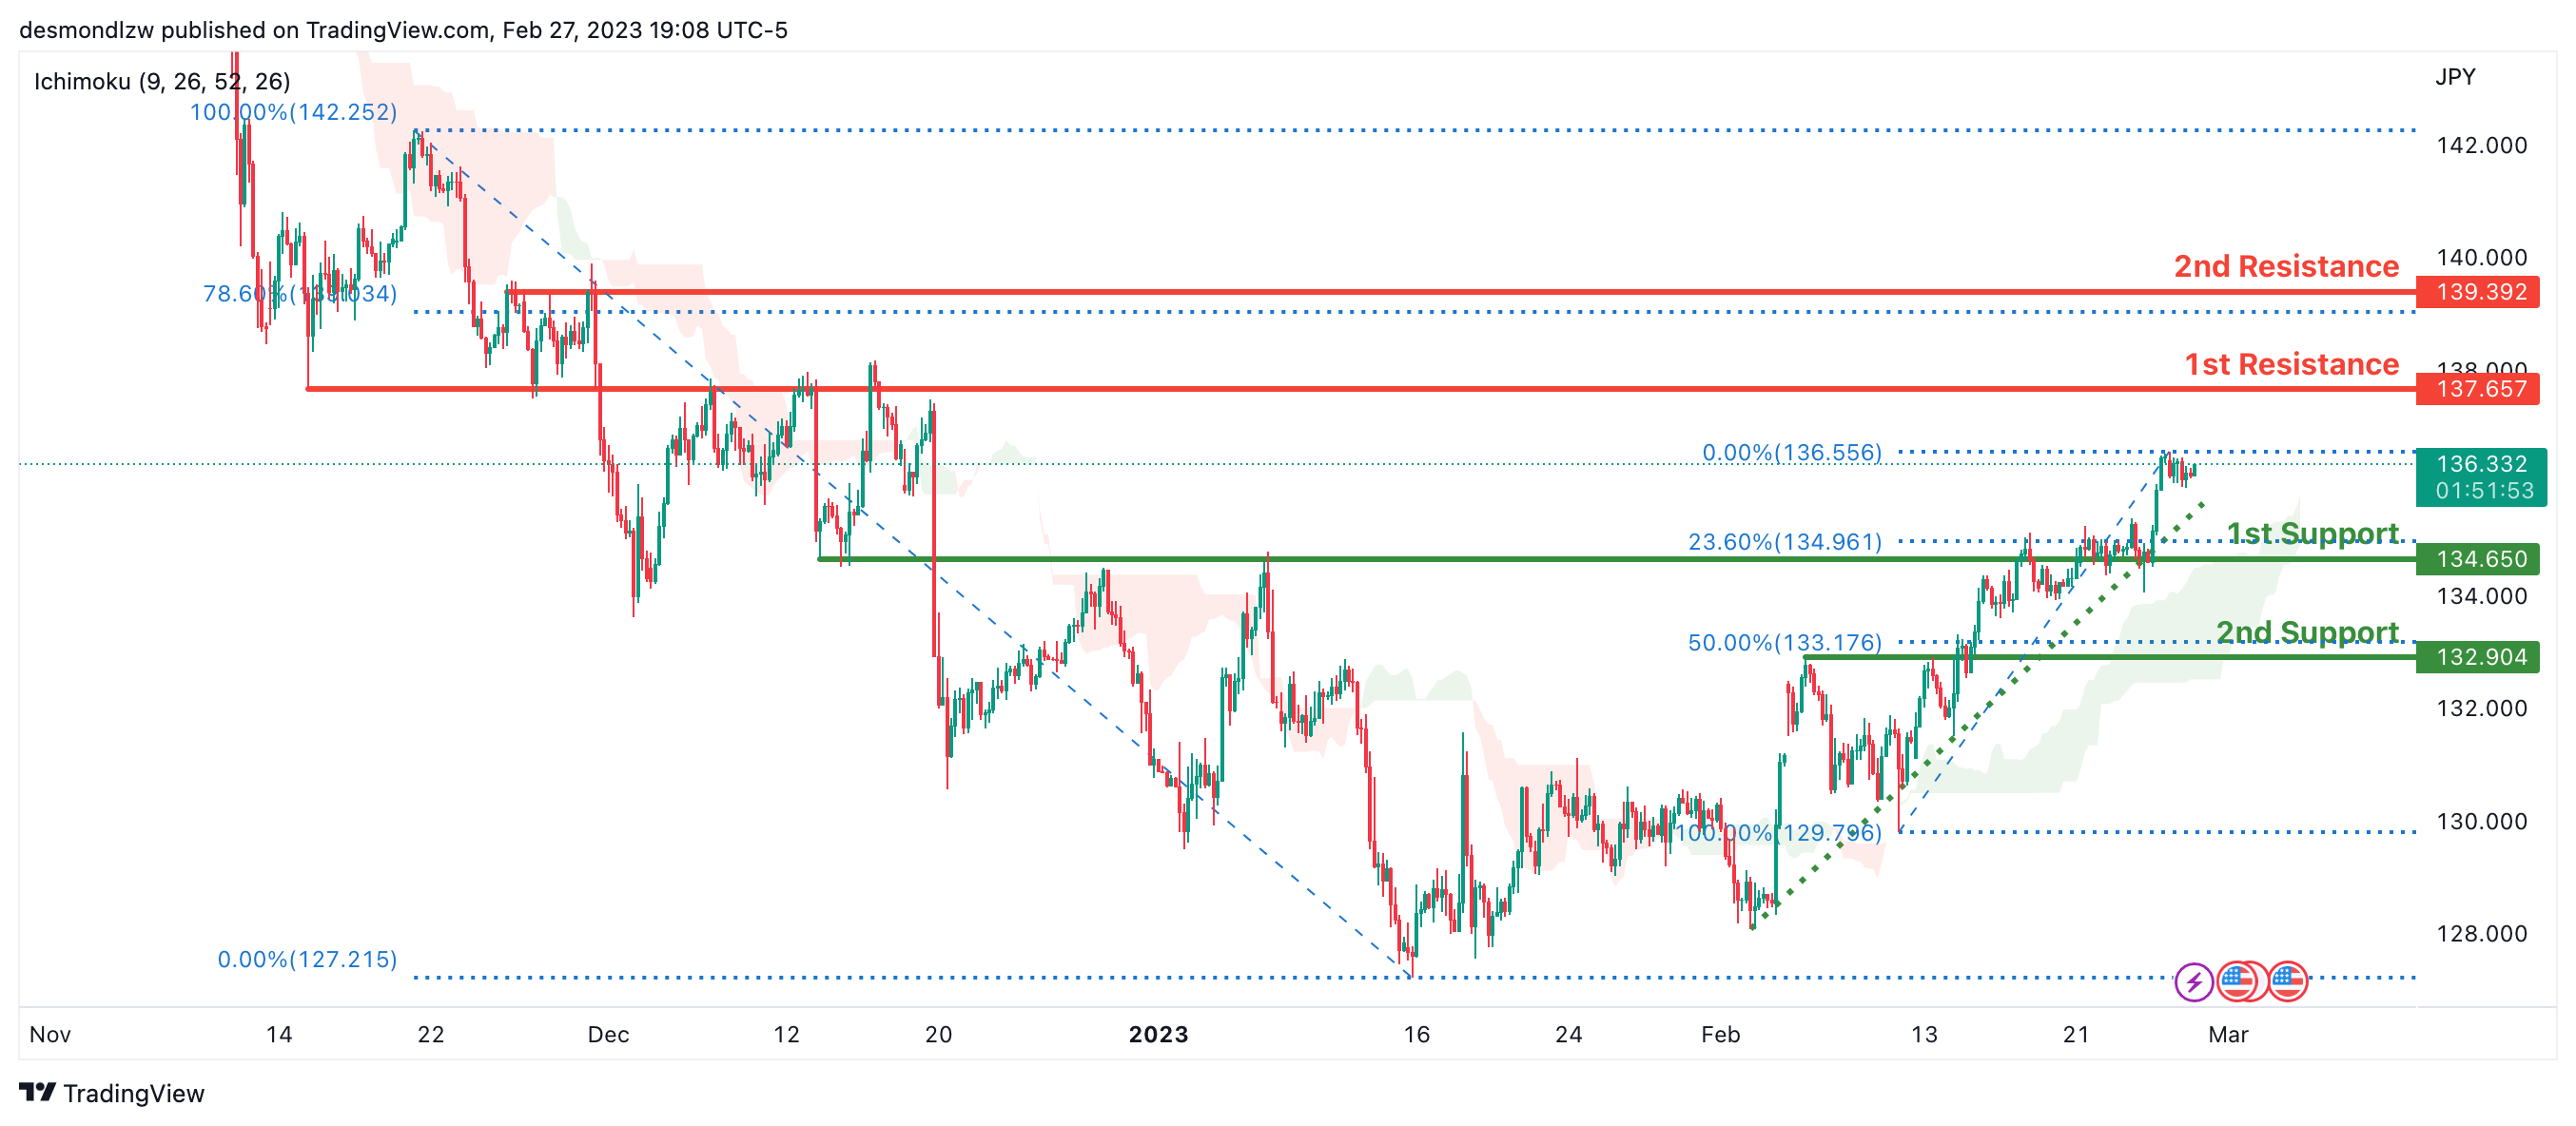
Looking at the H4 chart, my overall bias for USDJPY is bullish due to the current price being above the Ichimoku cloud, indicating a bullish market. To add confluence to this bias, price is also along an ascending trendline.If this bullish momentum continues, expect the price to continue heading towards the 1st resistance at 137.657, where the overlap resistance is.
In an alternate scenario, price could possibly head back down to retest the 1st support at 134.650, where the overlap support intersects with the 23.6% Fibonacci line.
Areas of consideration:
- H4 time frame, 1st resistance at 137.657
- H4 time frame, 1st support at 134.650
DXY:
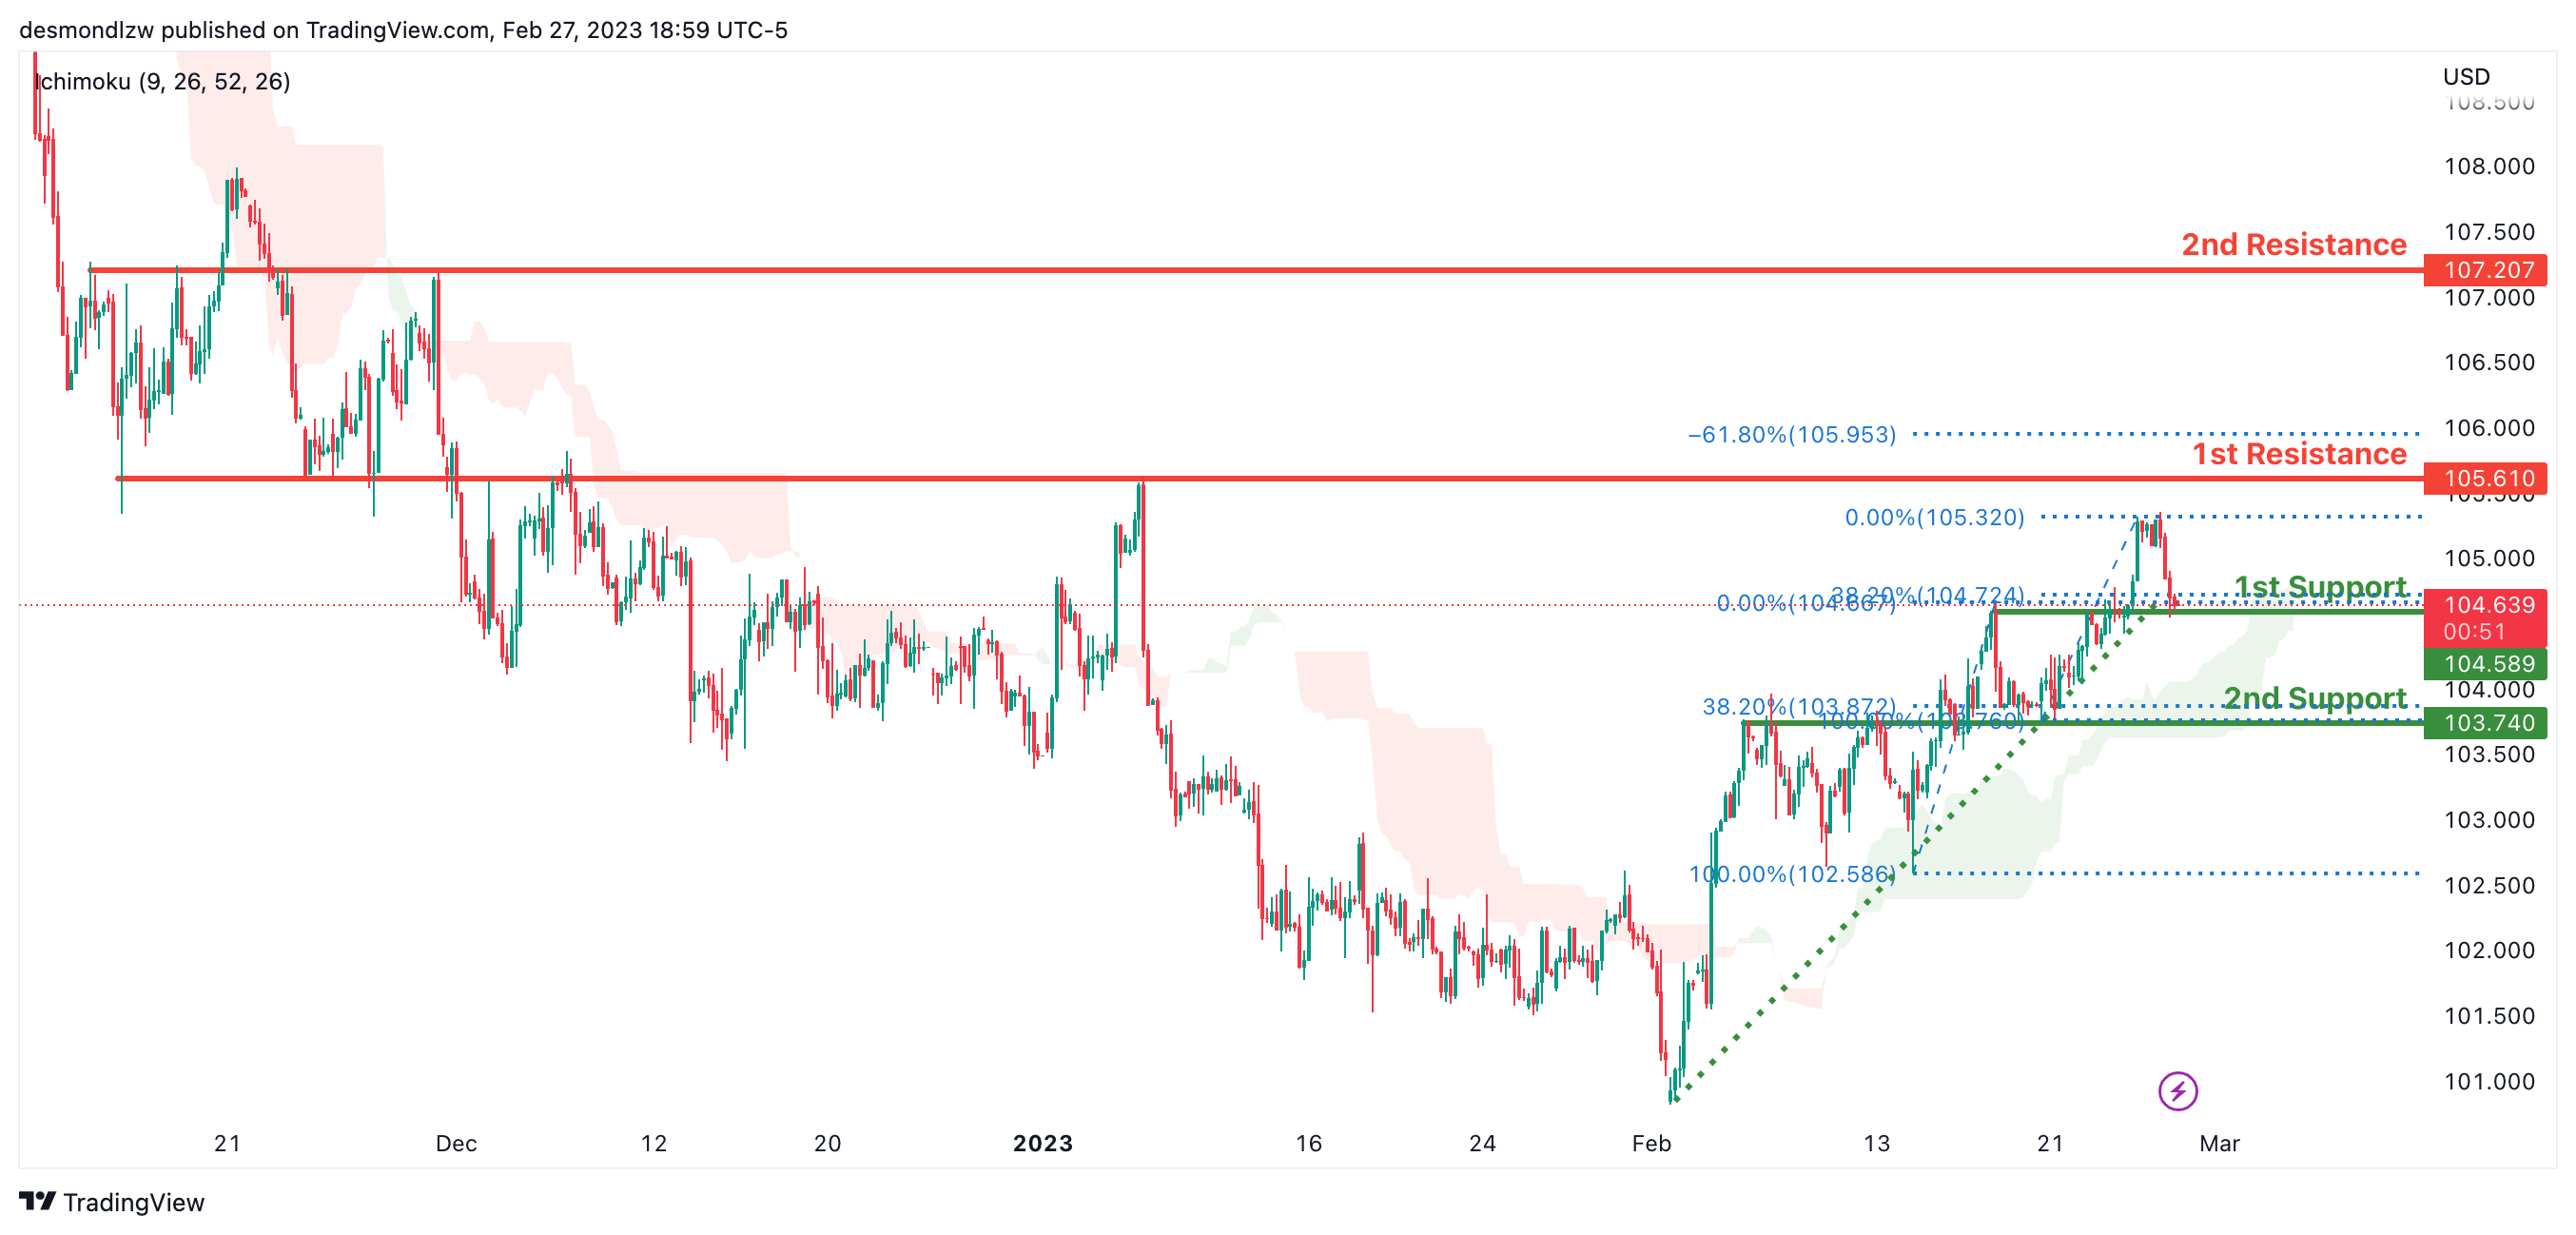
Looking at the H4 chart, my overall bias for DXY is bullish due to the current price crossing above the Ichimoku cloud, indicating a bullish market. To add confluence to this bias, price is also along an ascending trendline.If this bullish momentum continues, expect the price to possibly break the 1st resistance at 105.610, where the overlap resistance and 78.6% Fibonacci line is before heading towards the 2nd resistance at 107.207 which is the overlap resistance.
In an alternative scenario, price could head back down to break the 1st support at 104.667, where the overlap support and 38.2% Fibonacci line is before heading towards the 2nd support at 103.740, where the overlap support and 38.2% Fibonacci line is.
Areas of consideration:
- H4 time frame, 1st resistance at 105.610
- H4 time frame, 2nd resistance at 107.207
- H4 time frame, 1st support at 104.667
- H4 time frame, 2nd support at 103.740
EUR/USD:
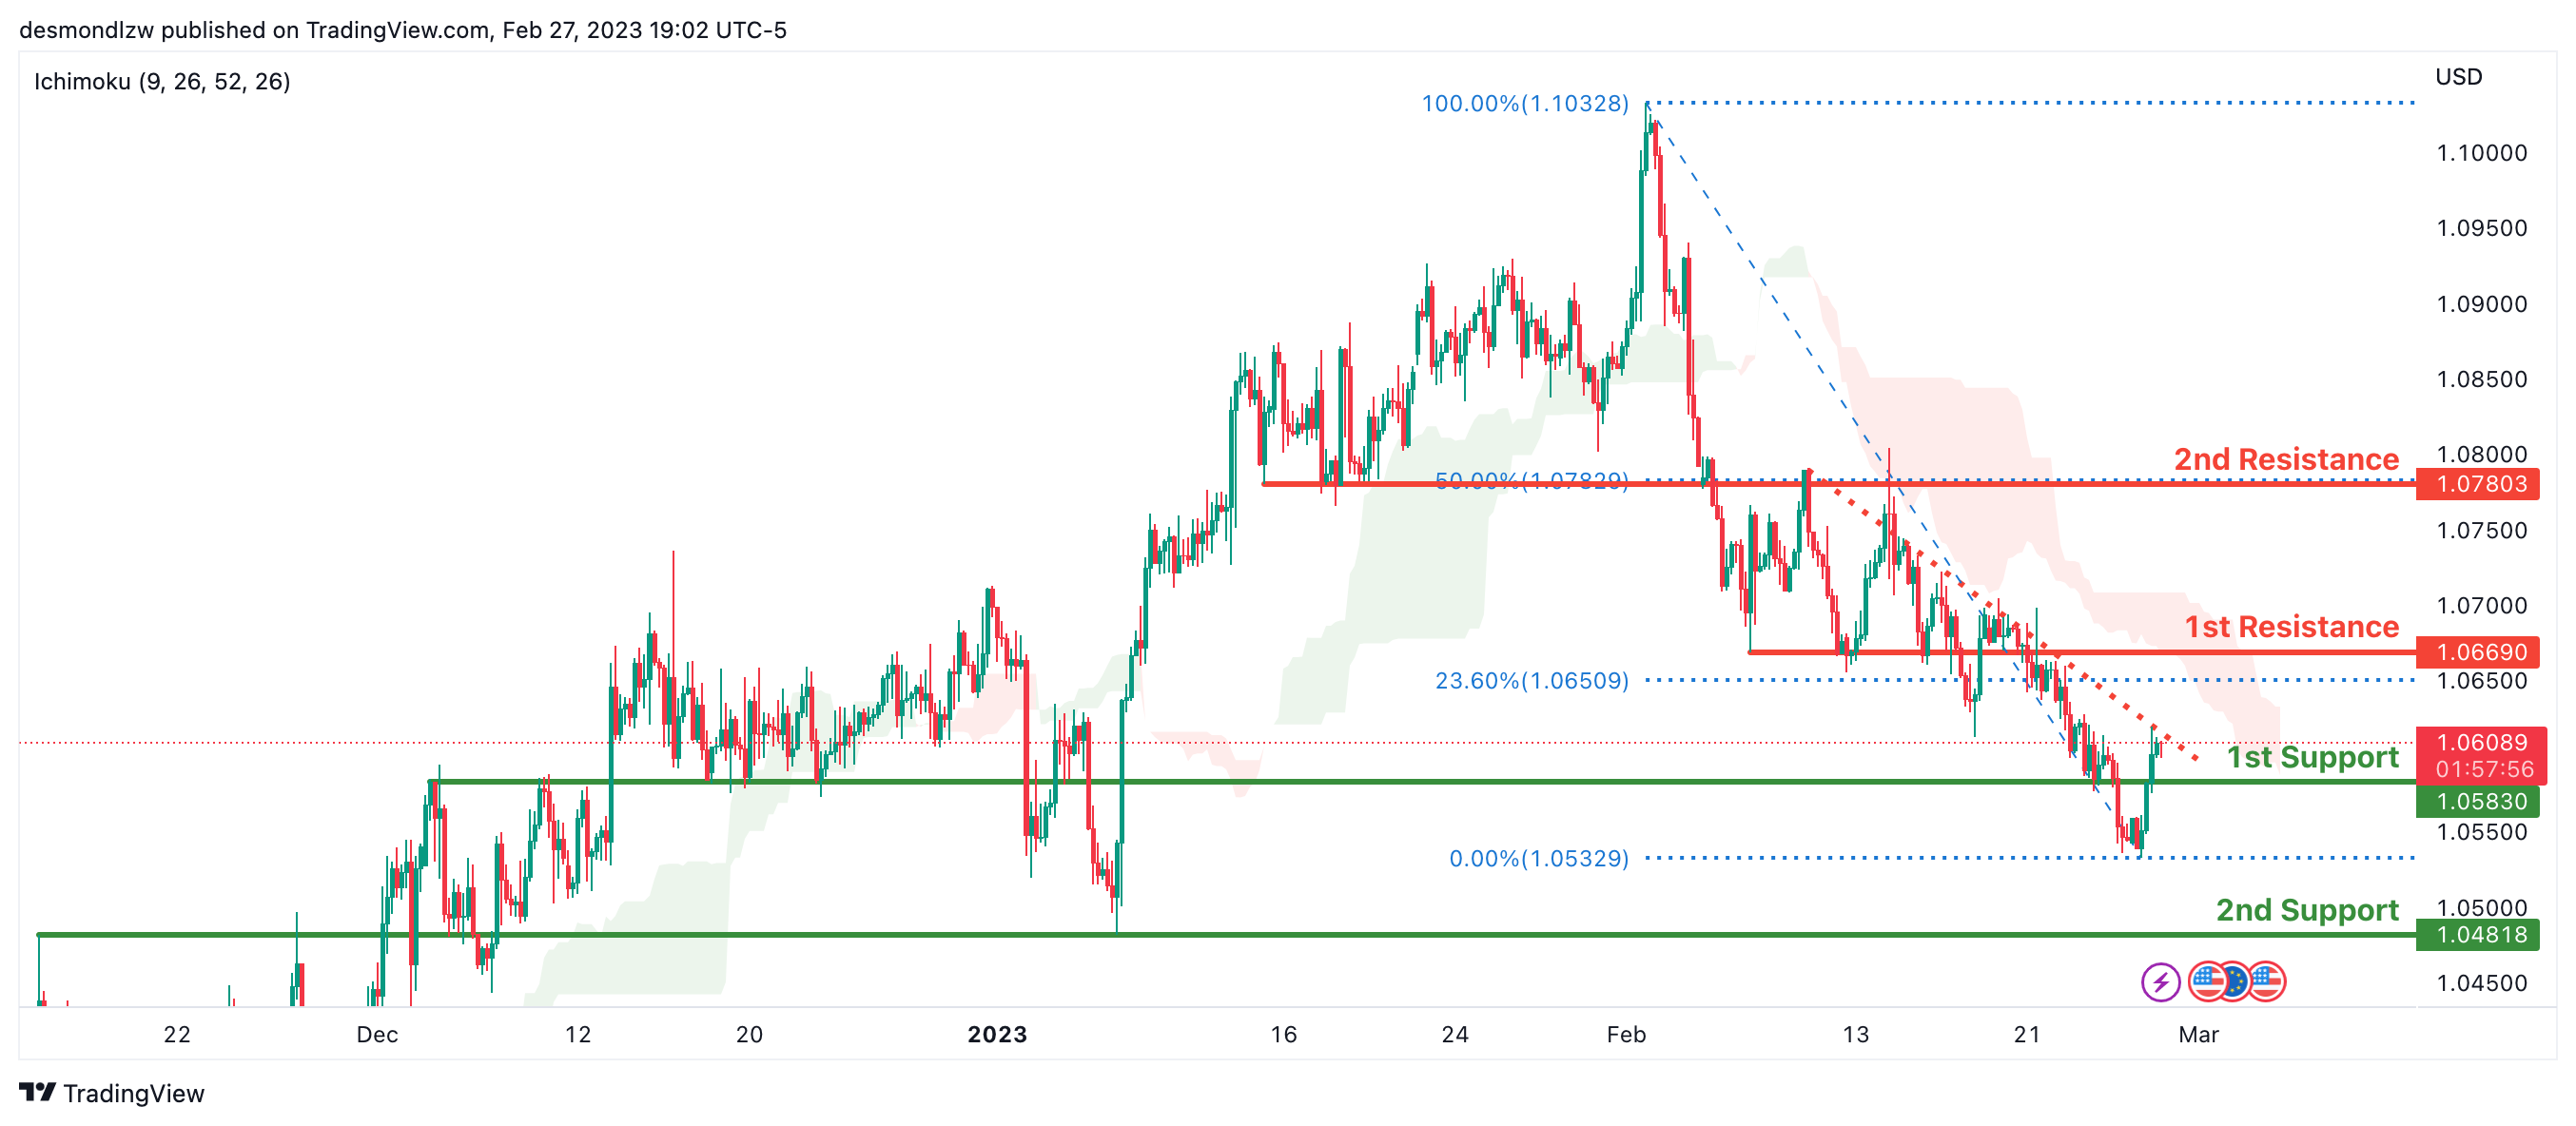
Looking at the H4 chart, my overall bias for EURUSD is bearish due to the current price crossing below the Ichimoku cloud, indicating a bearish market structure. To add confluence to this bias, price is also along a descending trendline.If this bearish momentum continues, expect the price to head towards the 1st support at 1.05830, where the overlap resistance is.
at 1.04818 which is the overlap support is.
In an alternate scenario, price could possibly head back up to retest the 1st resistance at 1.06690, where the overlap resistance and 23.6% Fibonacci line is.
Areas of consideration :
- H4 1st resistance at 1.05830
- H4 1st support at 1.04818
GBP/USD:
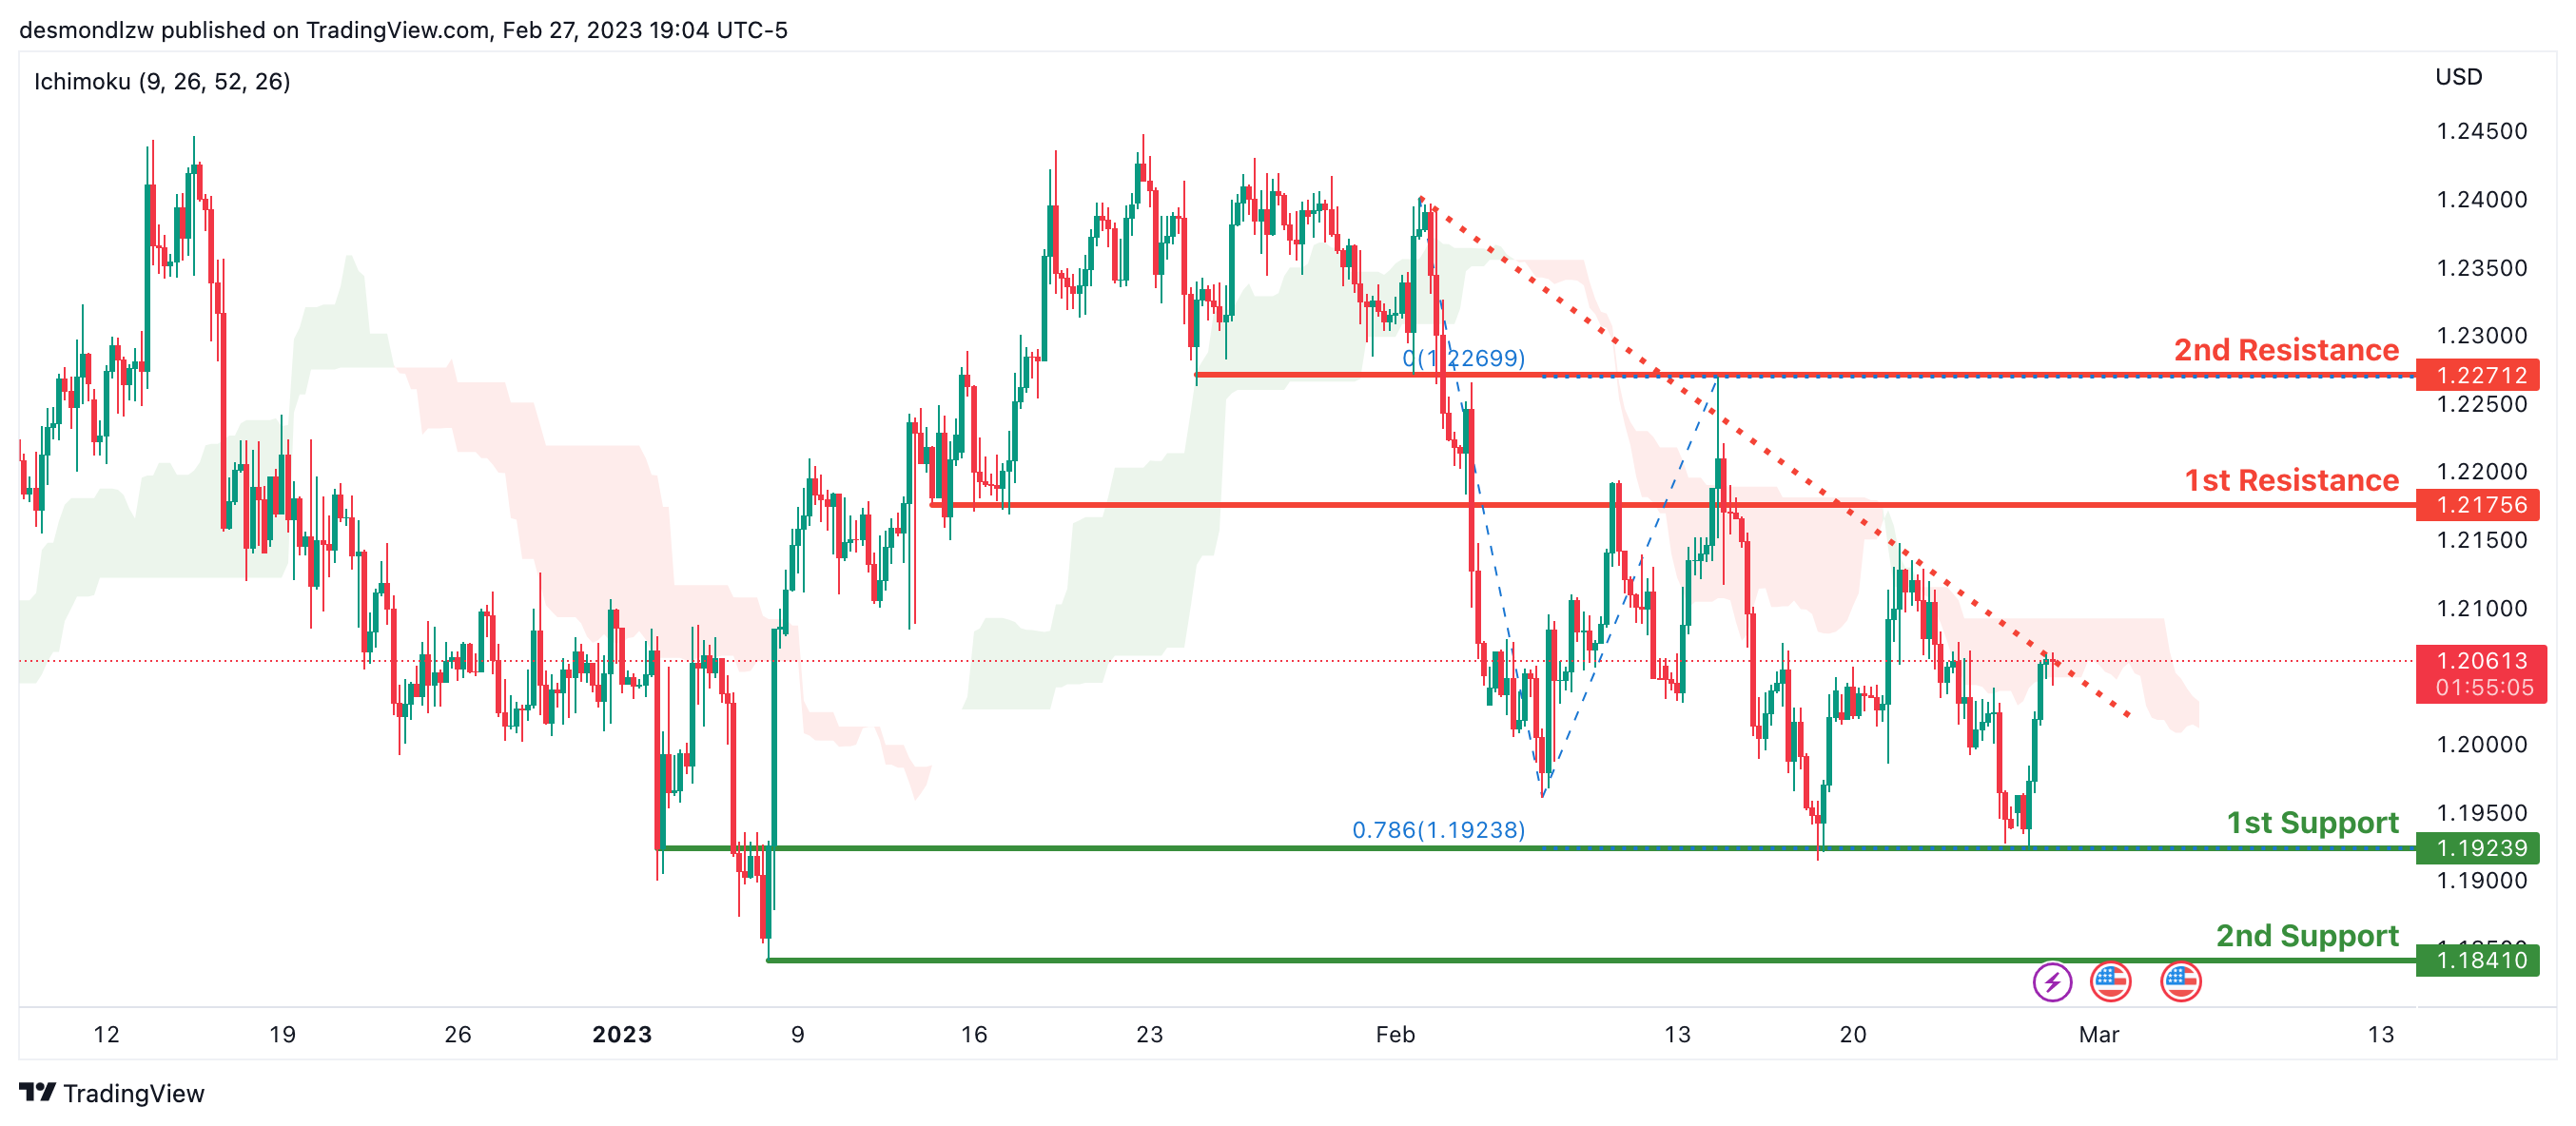
Looking at the H4 chart, my overall bias for GBPUSD is bearish due to the current price crossing below the Ichimoku cloud, indicating a bearish market. To add confluence to this bias, price is also along a descending trendline.If this bearish momentum continues, expect the price to head towards the 1st support at 1.19239, where the overlap support is.
In an alternate scenario, price could head back up to retest the 1st resistance line at 1.21756 where the overlap resistance is.
Areas of consideration:
- H4 1st resistance at 1.21756
- H4 1st support at 1.19239
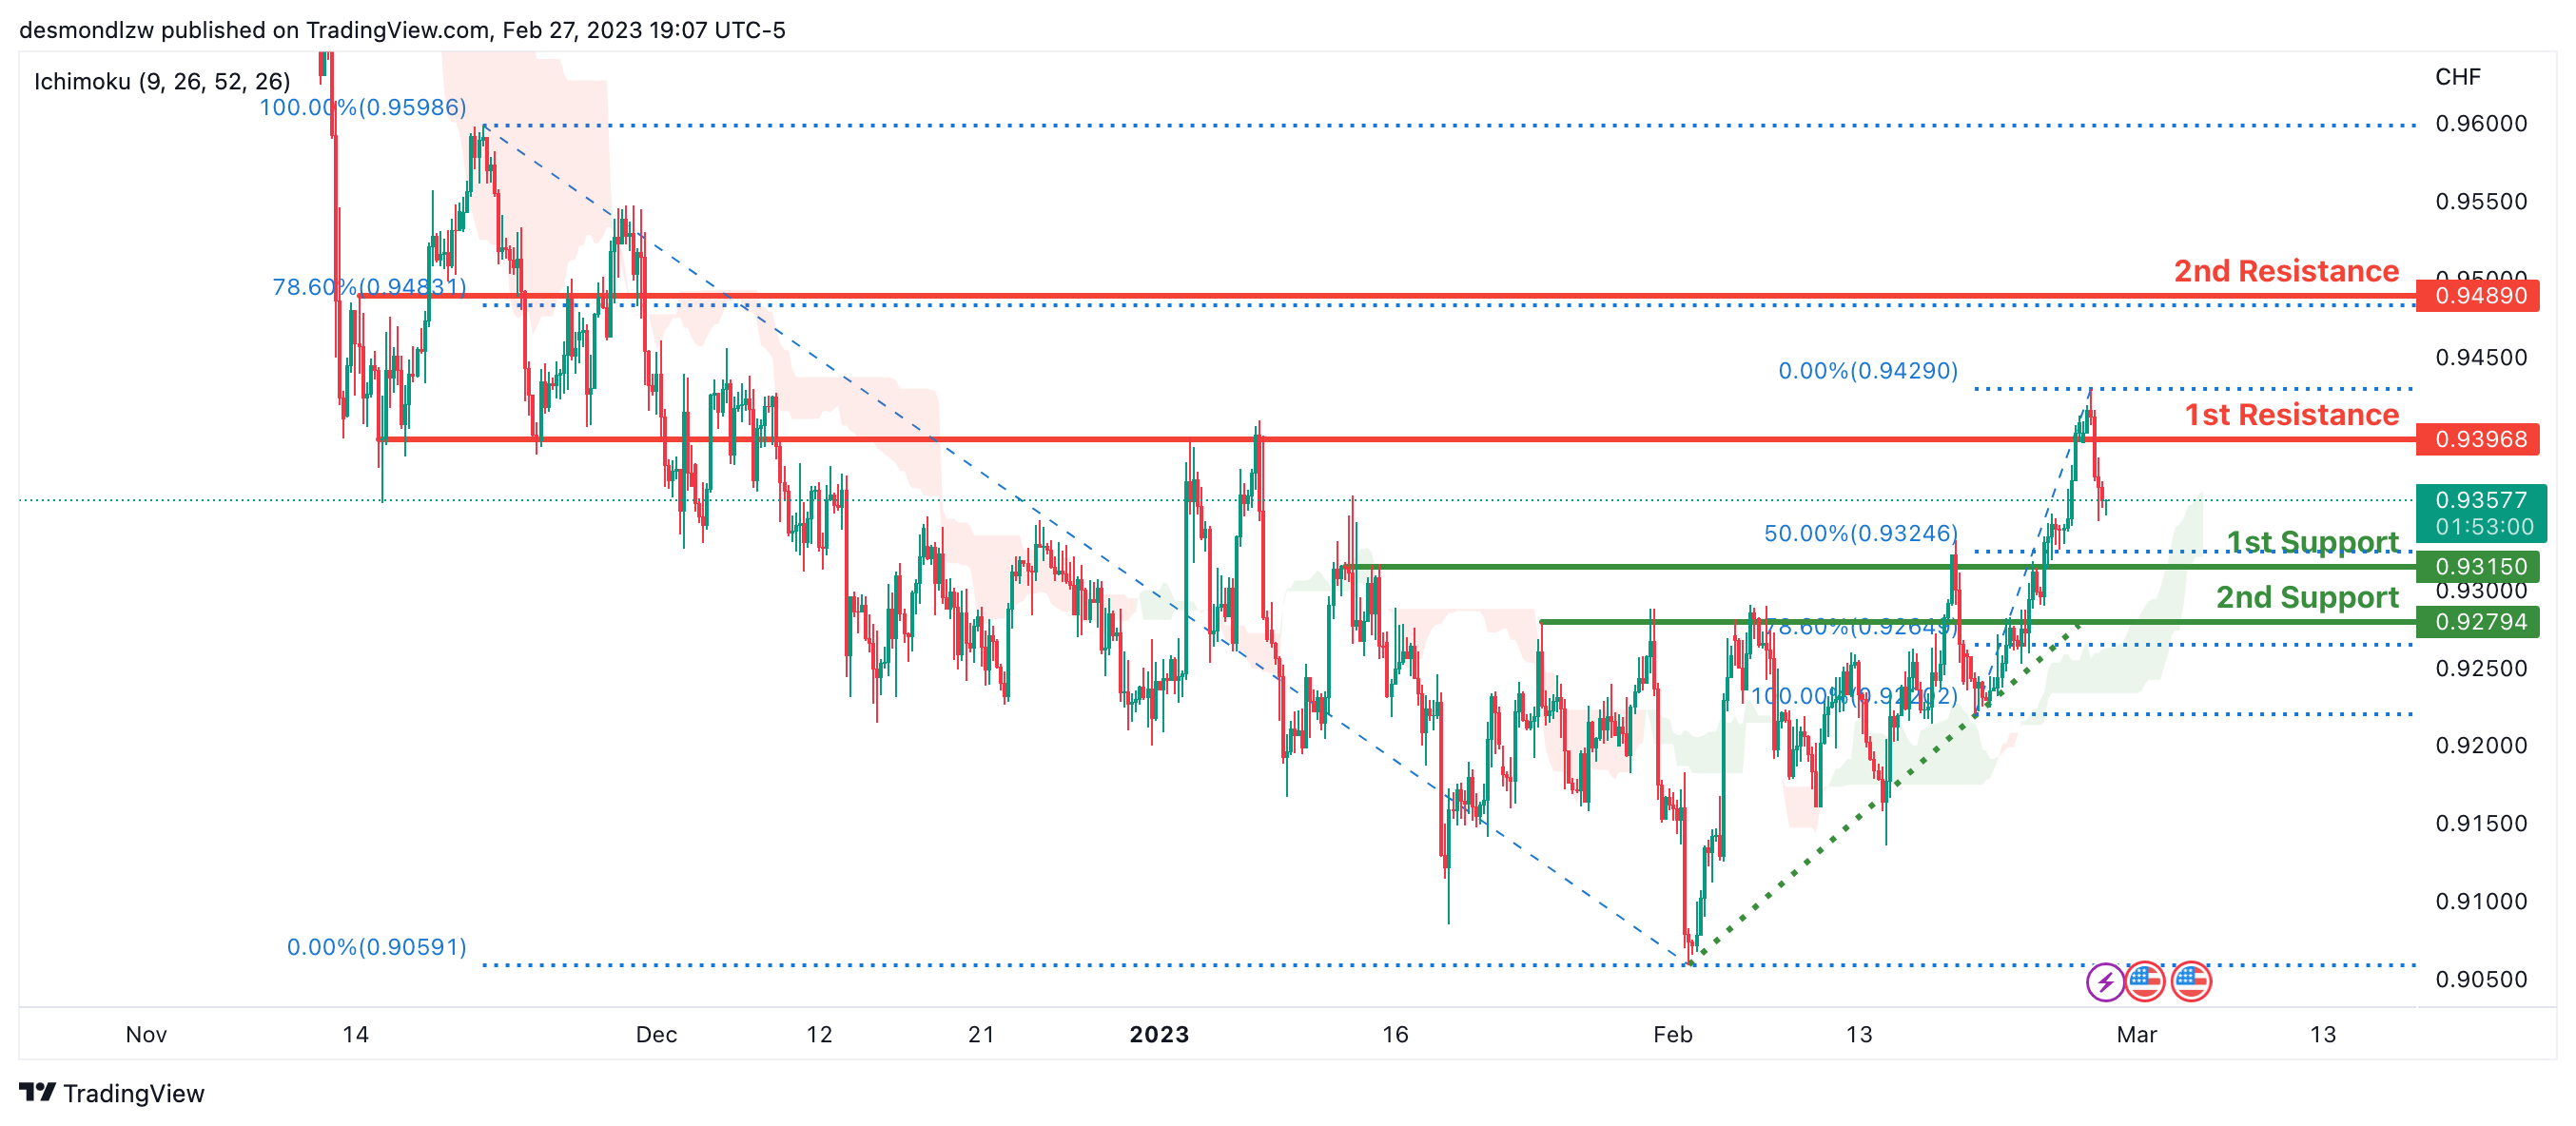
USD/CHF:
Looking at the H4 chart, my overall bias for USDCHF is bullish due to the current price being above the Ichimoku cloud, indicating a bullish market. To add confluence to this bias, price is also along an ascending trendline.If the current bullish trend continues, expect the price to possibly continue heading towards the 1st resistance at 0.93968 where the overlap resistance is.In an alternative scenario, price could possibly head back down to retest the 1st support at 0.93150, where the overlap support and 50% Fibonacci line is
Areas of consideration
- H4 1st support at 0.93150
- H4 1st resistance at 0.93968
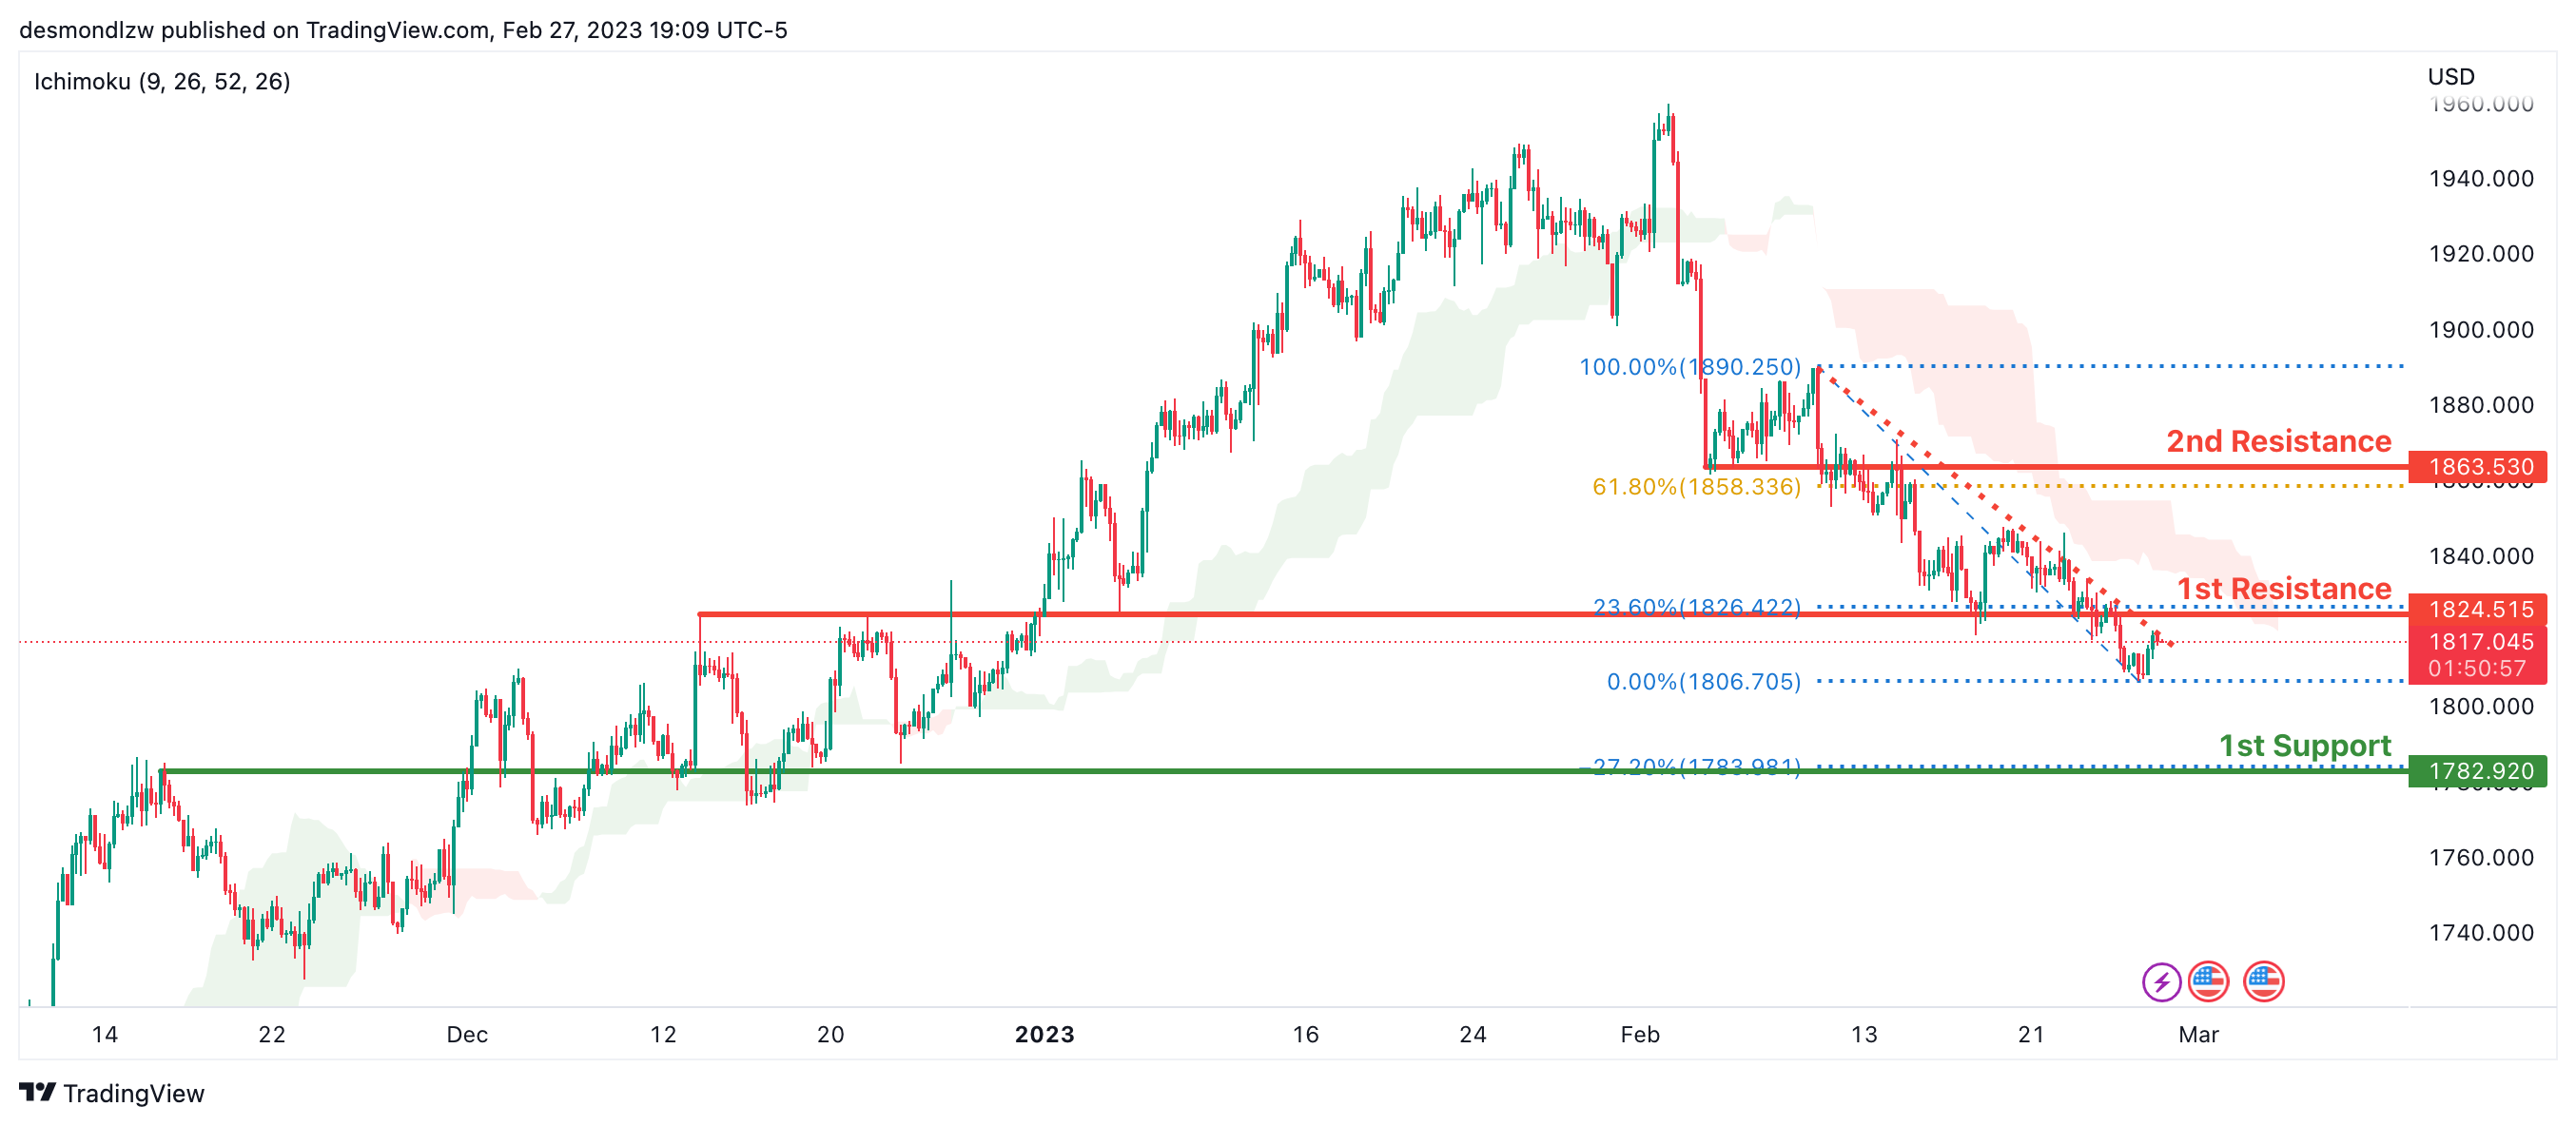
XAU/USD (GOLD):
Looking at the H4 chart, my overall bias for XAUUSD is bearish due to the current price being below the Ichimoku cloud, indicating a bearish market. To add confluence to this bias, price is also along a descending trendline.If this bearish momentum continues, expect the price to possibly continue heading towards the 1st support at 1782.920 where the overlap support intersects with the -27.2% Fibonacci expansion line.
In an alternative scenario, price could possibly head back up to retest the 1st resistance at 1824.515 where the overlap resistance and 23.6% Fibonacci line is
Areas of consideration:
- H4 time frame, 1st resistance at 1824.515
- H4 time frame, 1st support at 1782.920
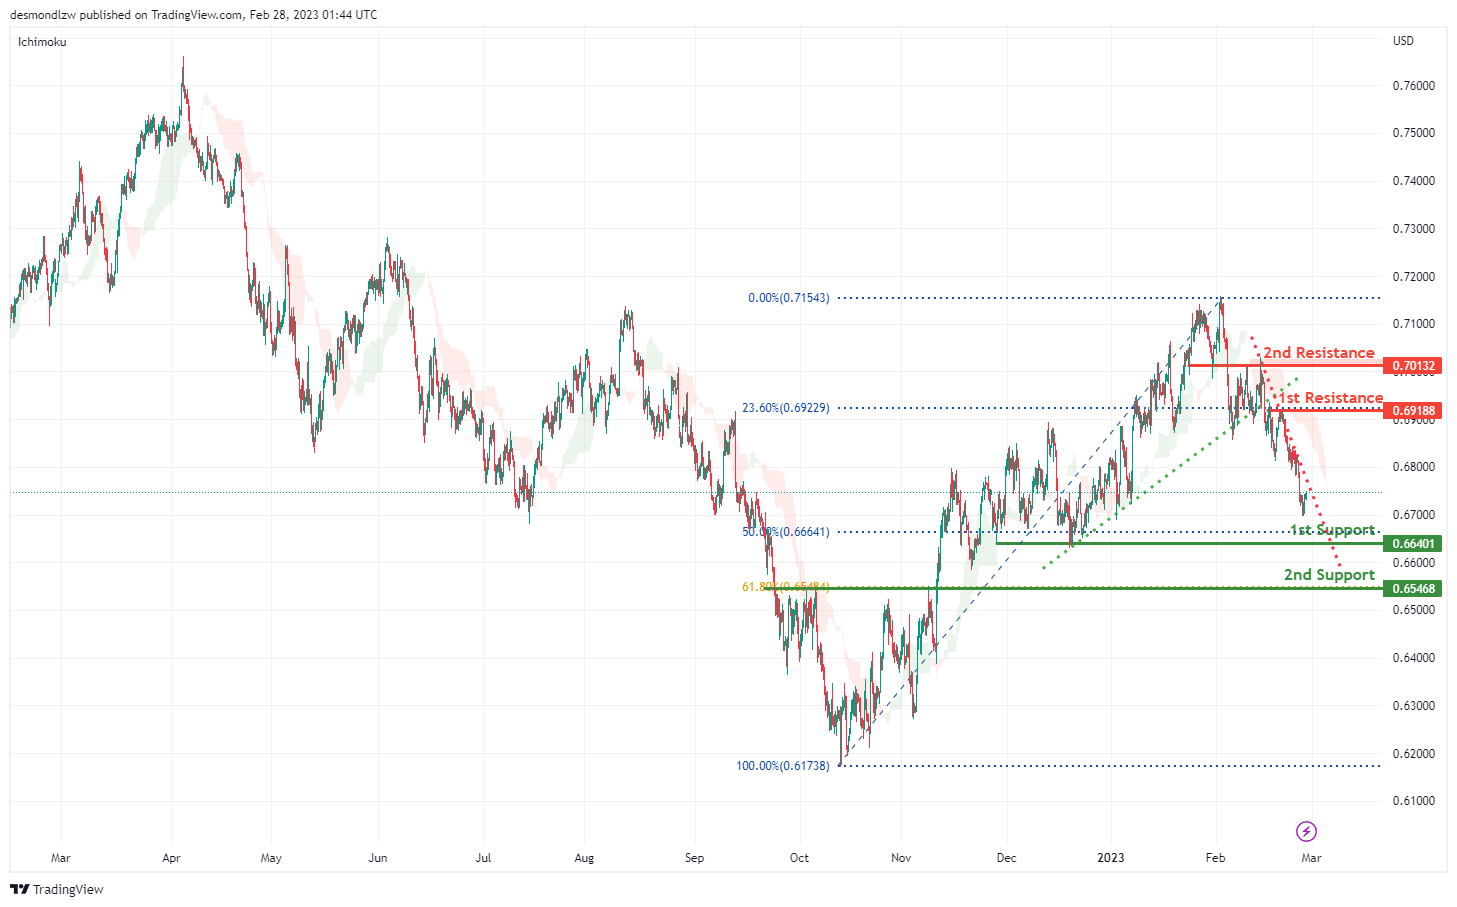
AUD/USD:
Looking at the H4 chart, my overall bias for AUDUSD is bearish due to the current price being below the Ichimoku cloud, and the price has broken the ascending trend line,a downward trend line has been created, indicating a bearish market.
The price could possibly godown towards the 1st support level at 0.66401 which is the recent overlap swing low. There is 2nd support at 0.65468 where the 61.8 % Fibonacci line are.
In an alternate scenario, The price could possibly go up towards the 1st resistance level at 0.69188 which is the recent overlap swing high, There is 2nd resistance at 0.70132 which is in line with the 23.6% Fibonacci retracement.
Areas of consideration
- H4. 2nd resistance at 0.70132
- H4. 1st resistance at 0.69188
- H4, 1st support at 0.66401
- H4, 2nd support at 0.65468
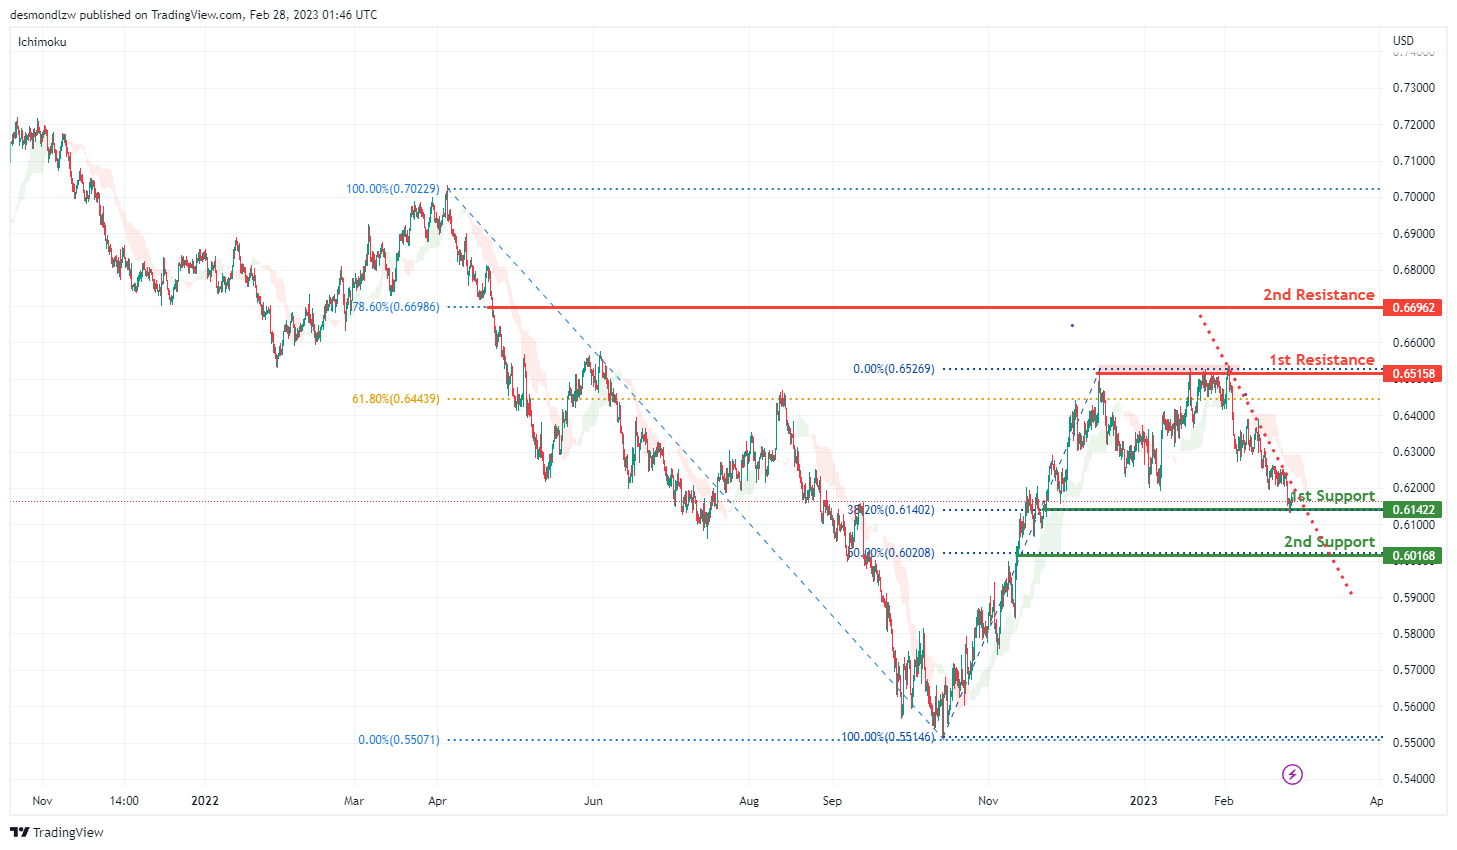
NZD/USD:
Looking at the H4 chart, my overall bias for NZDUSD is bearish, as the current price is below the Ichimoku Cloud. A descending trend line has been created, indicating a bearish market. Expecting the price go down towards the 1st support at 0.61422 where the overlap swing low and 38.2% Fibonacci line are. The 2nd support is at 0.60168 where the 50% Fibonacci line is.
In an alternate scenario, price could possibly go up towards the 1st resistance level at 0.65158 which is the recent overlap swing high. There is a 2nd resistance at 0.66962 where the 78.6% Fibonacci line is.
Areas of consideration:
- H4 time frame, 2nd resistance at 0.66962
- H4 time frame, 1st resistance at 0.65158
- H4 time frame, 1st support at 0.61422
- H4 time frame, 2nd support at 0.60168
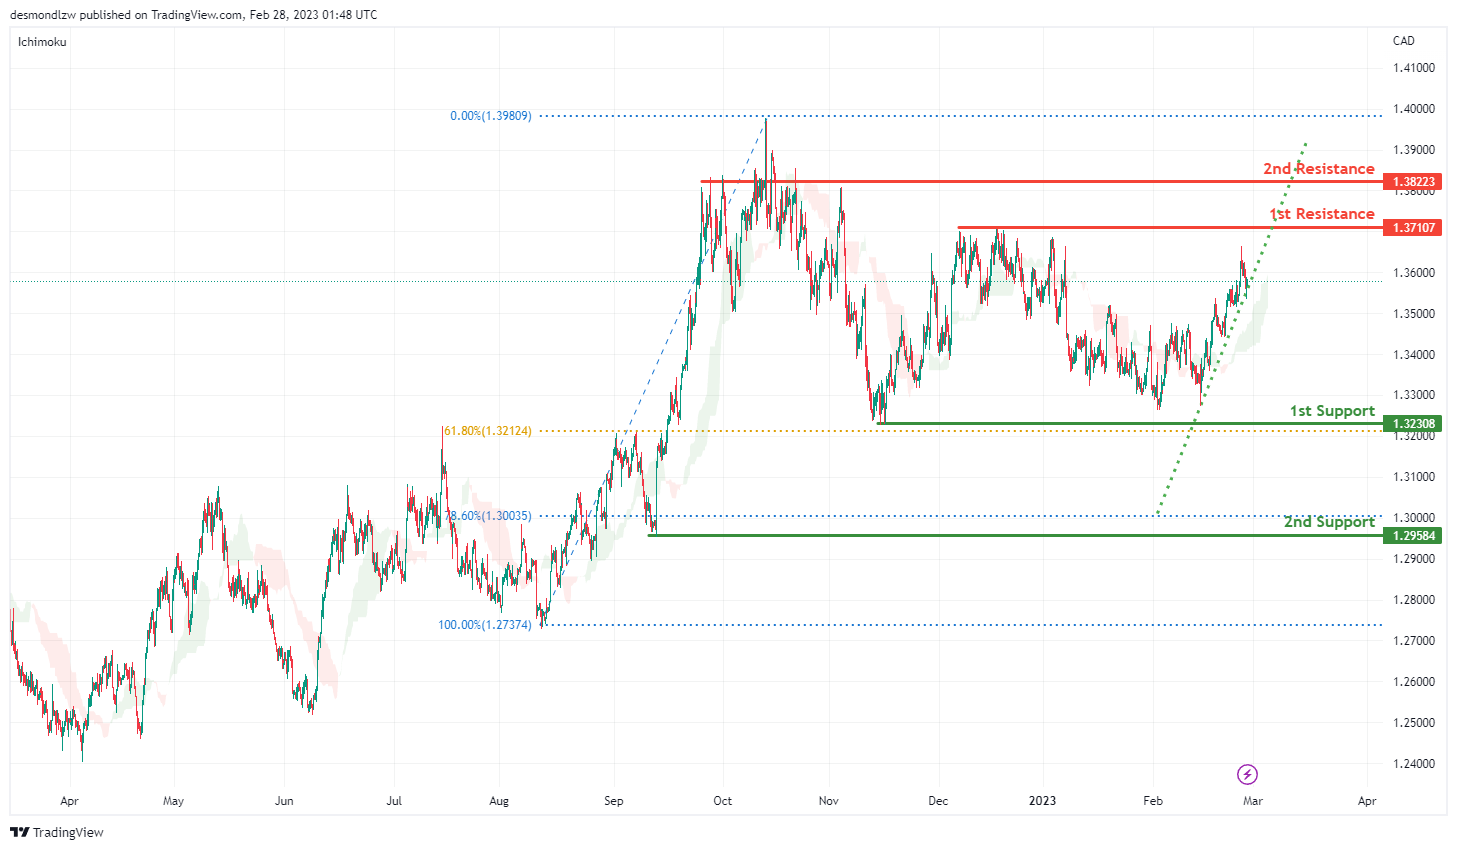
USD/CAD:
Looking at the H4 chart, my overall bias for USDCAD is bullish , as the current price is above the Ichimoku cloud. An ascending trend line has been created, indicating a bullish market. Expecting the current price to possibly break the 1st resistance at 1.37107 which is the overlap of the recent swing high, before it heads to the 2nd resistance at 1.38223 which is the previous swing high.
In an alternative scenario, the price could possibly drop to the 1st support at 1.32308 which is the previous swing low and also in line with the 61.8% Fibonacci retracement. The 2nd support is at 1.29584 where the 78.6% Fibonacci line is .
Areas of consideration:
- H4 time frame, 2nd resistance at 1.38223
- H4 time frame, 1st resistance at 1.37107
- H4 time frame, 1st support at 1.32308
- H4 time frame, 2nd support at 1.29584
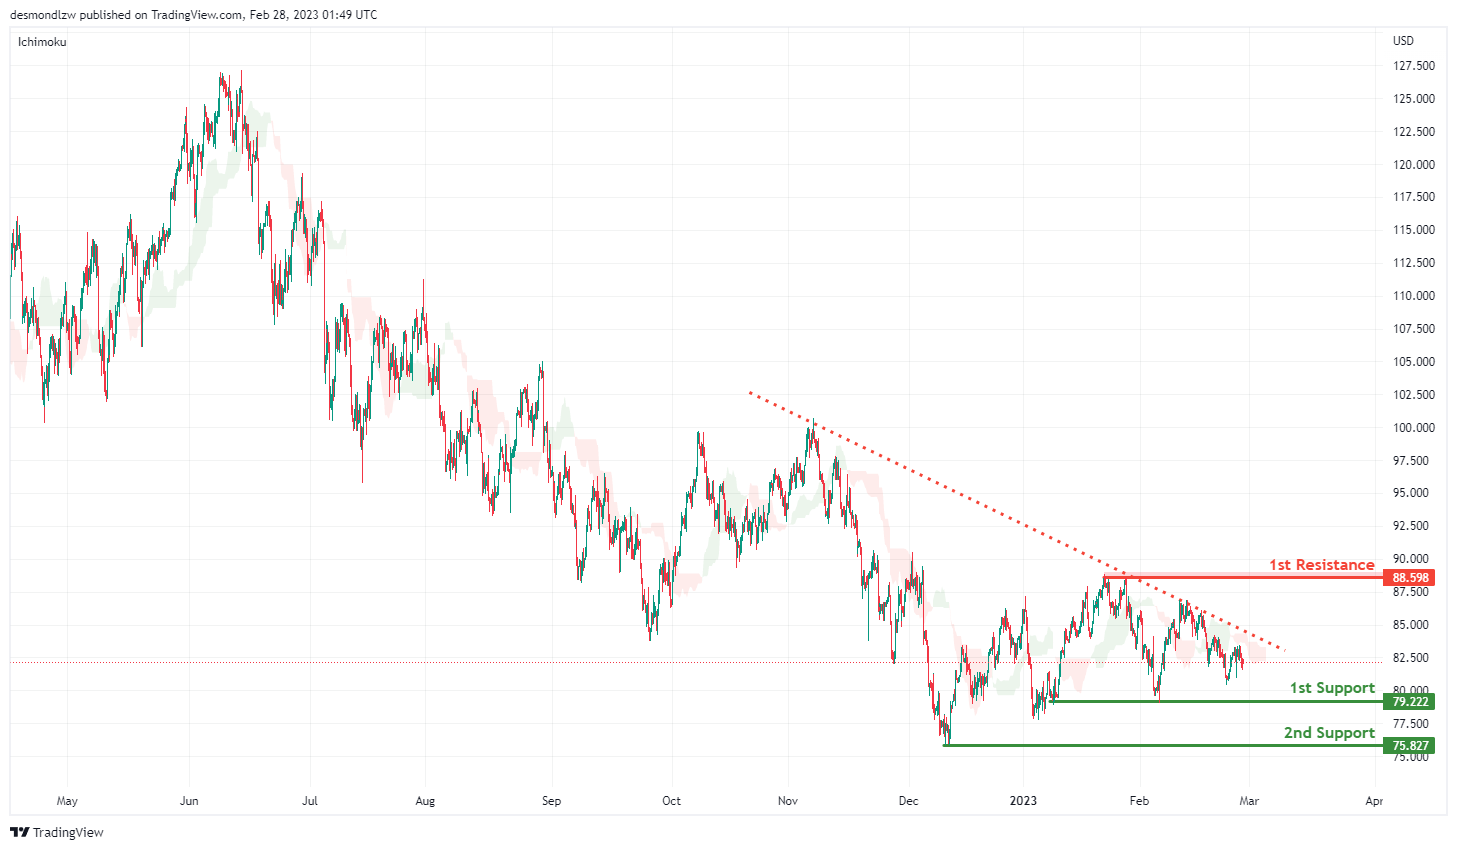
OIL:
Looking at the H4 chart, my overall bias for BOC is bearish as the current price is below the Ichimoku cloud, and there is an descending trend line. Expecting the price to head down towards the 1st support level at 79.222 which is the recent overlap swing low, before the price drops to the 2nd support at 75.827.
In an alternate scenario, the price could possibly head up towards the 1st resistance level at 88.598 which is the recent swing high.
Areas of consideration:
- H4 time frame, 1st resistance at 88.598
- H4 time frame,1st support at 79.222
- H4 time frame, 2nd support at 75.827
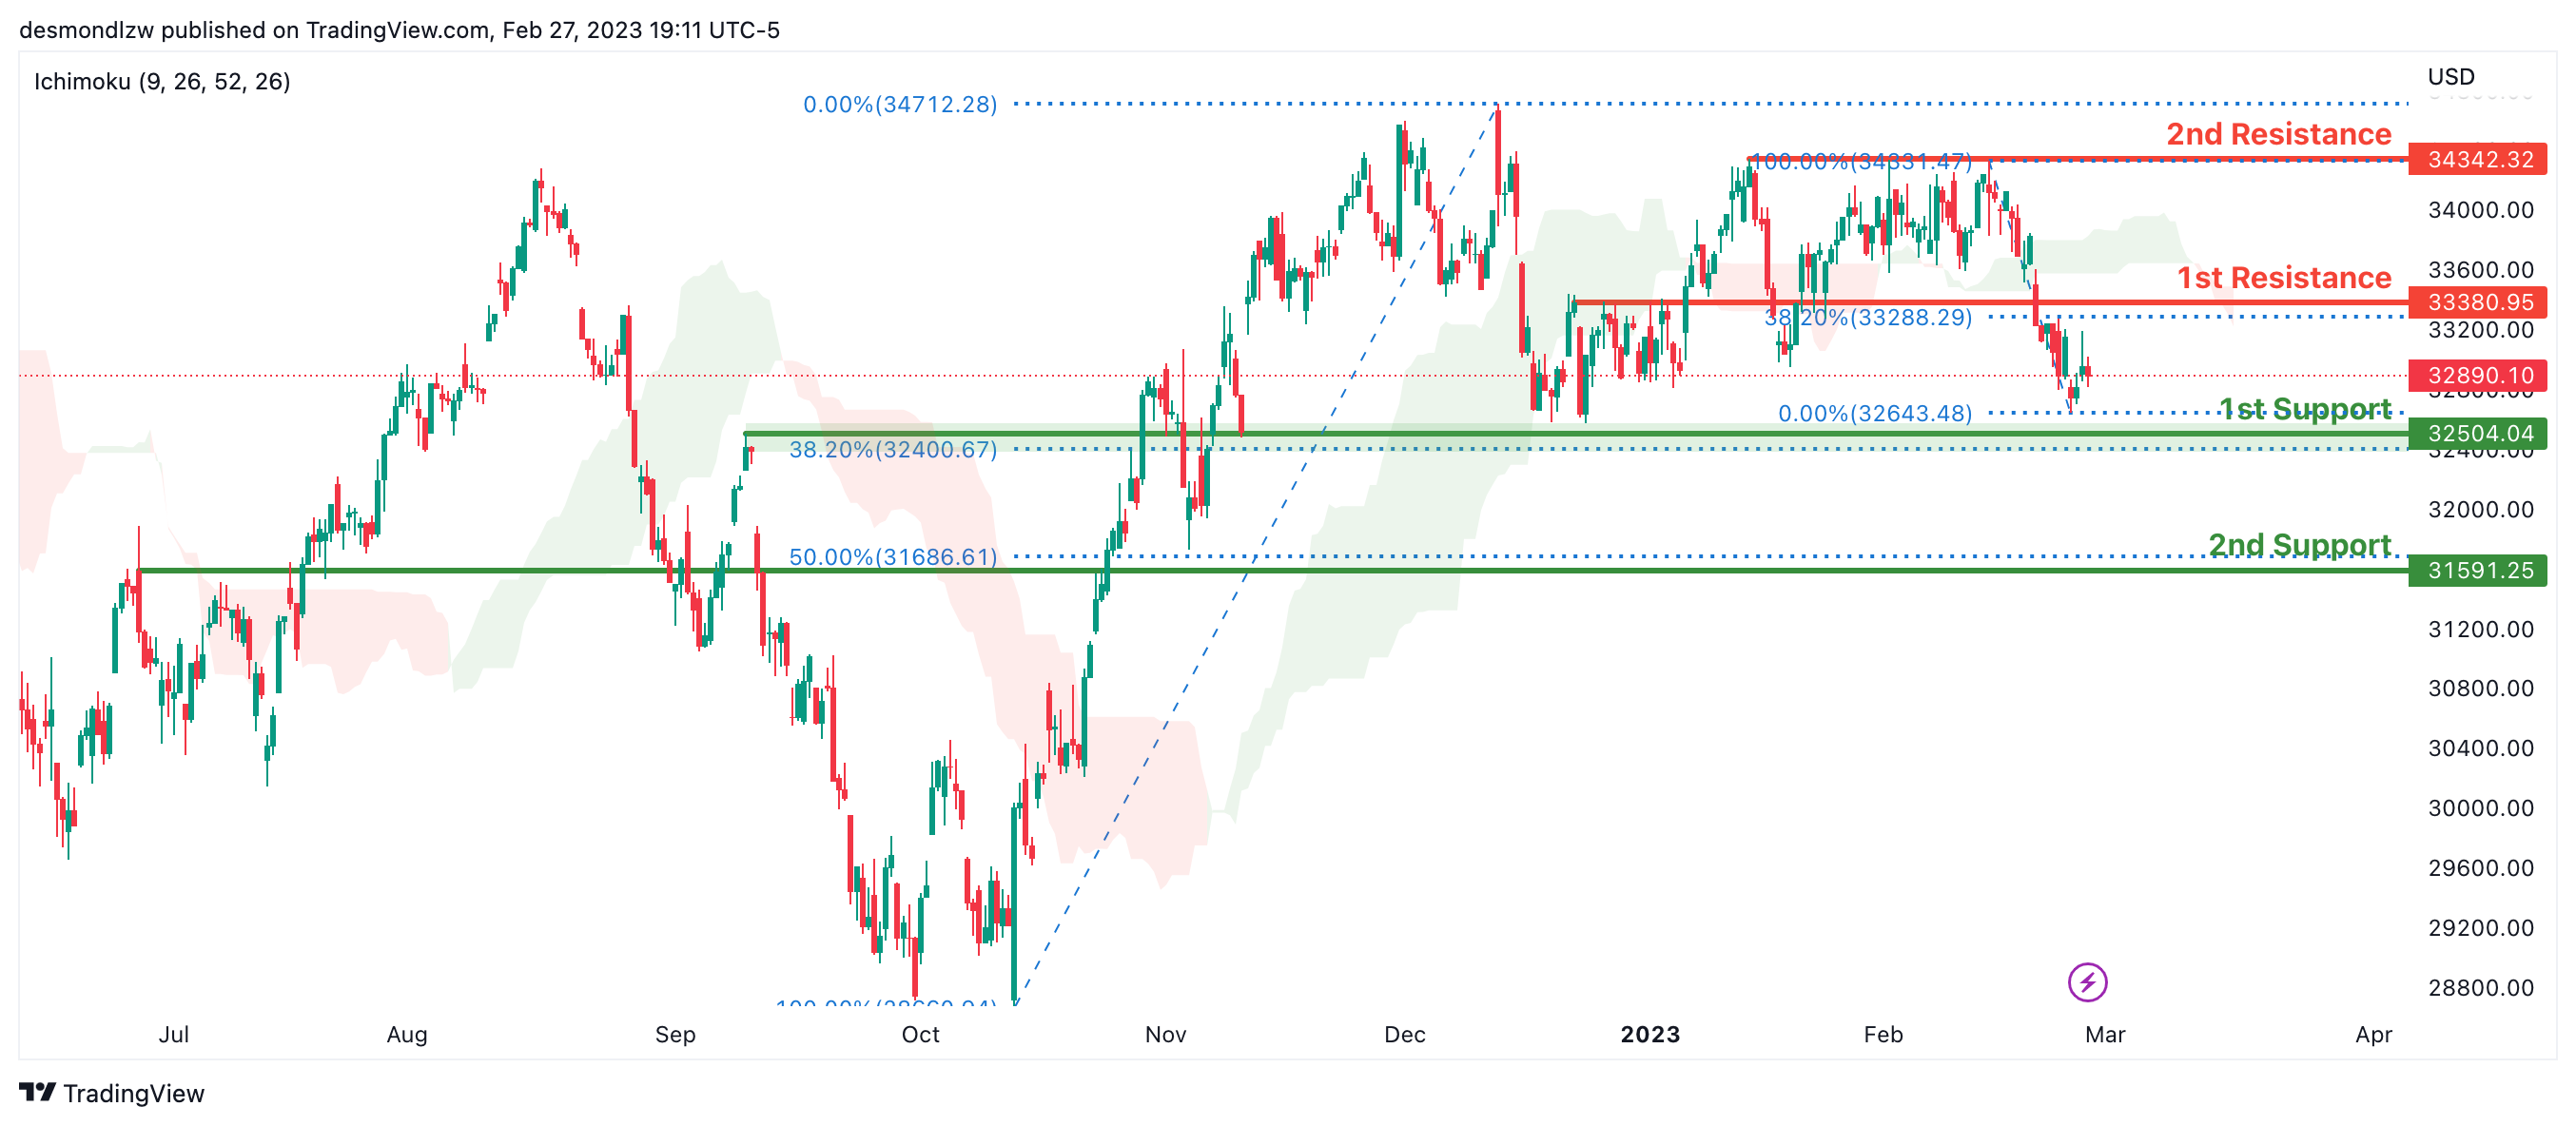
Dow Jones Industrial Average:
On the H4 chart, the overall bias for DJI is bearish. To add confluence to this, the price is crossing below the Ichimoku cloud which indicates a bearish market.If this bearish momentum continues, expect the price to possibly continue heading towards the 1st support at 32504.04, where the 38.2% Fibonacci line and overlap support is.In an alternative scenario, price could possibly head back up towards the 1st resistance at 33380.95, where the 23.6% Fibonacci line is.
Areas of consideration:
- H4 time frame, 1st support at 32504.04
- H4 time frame, 1st Resistance at 33380.95
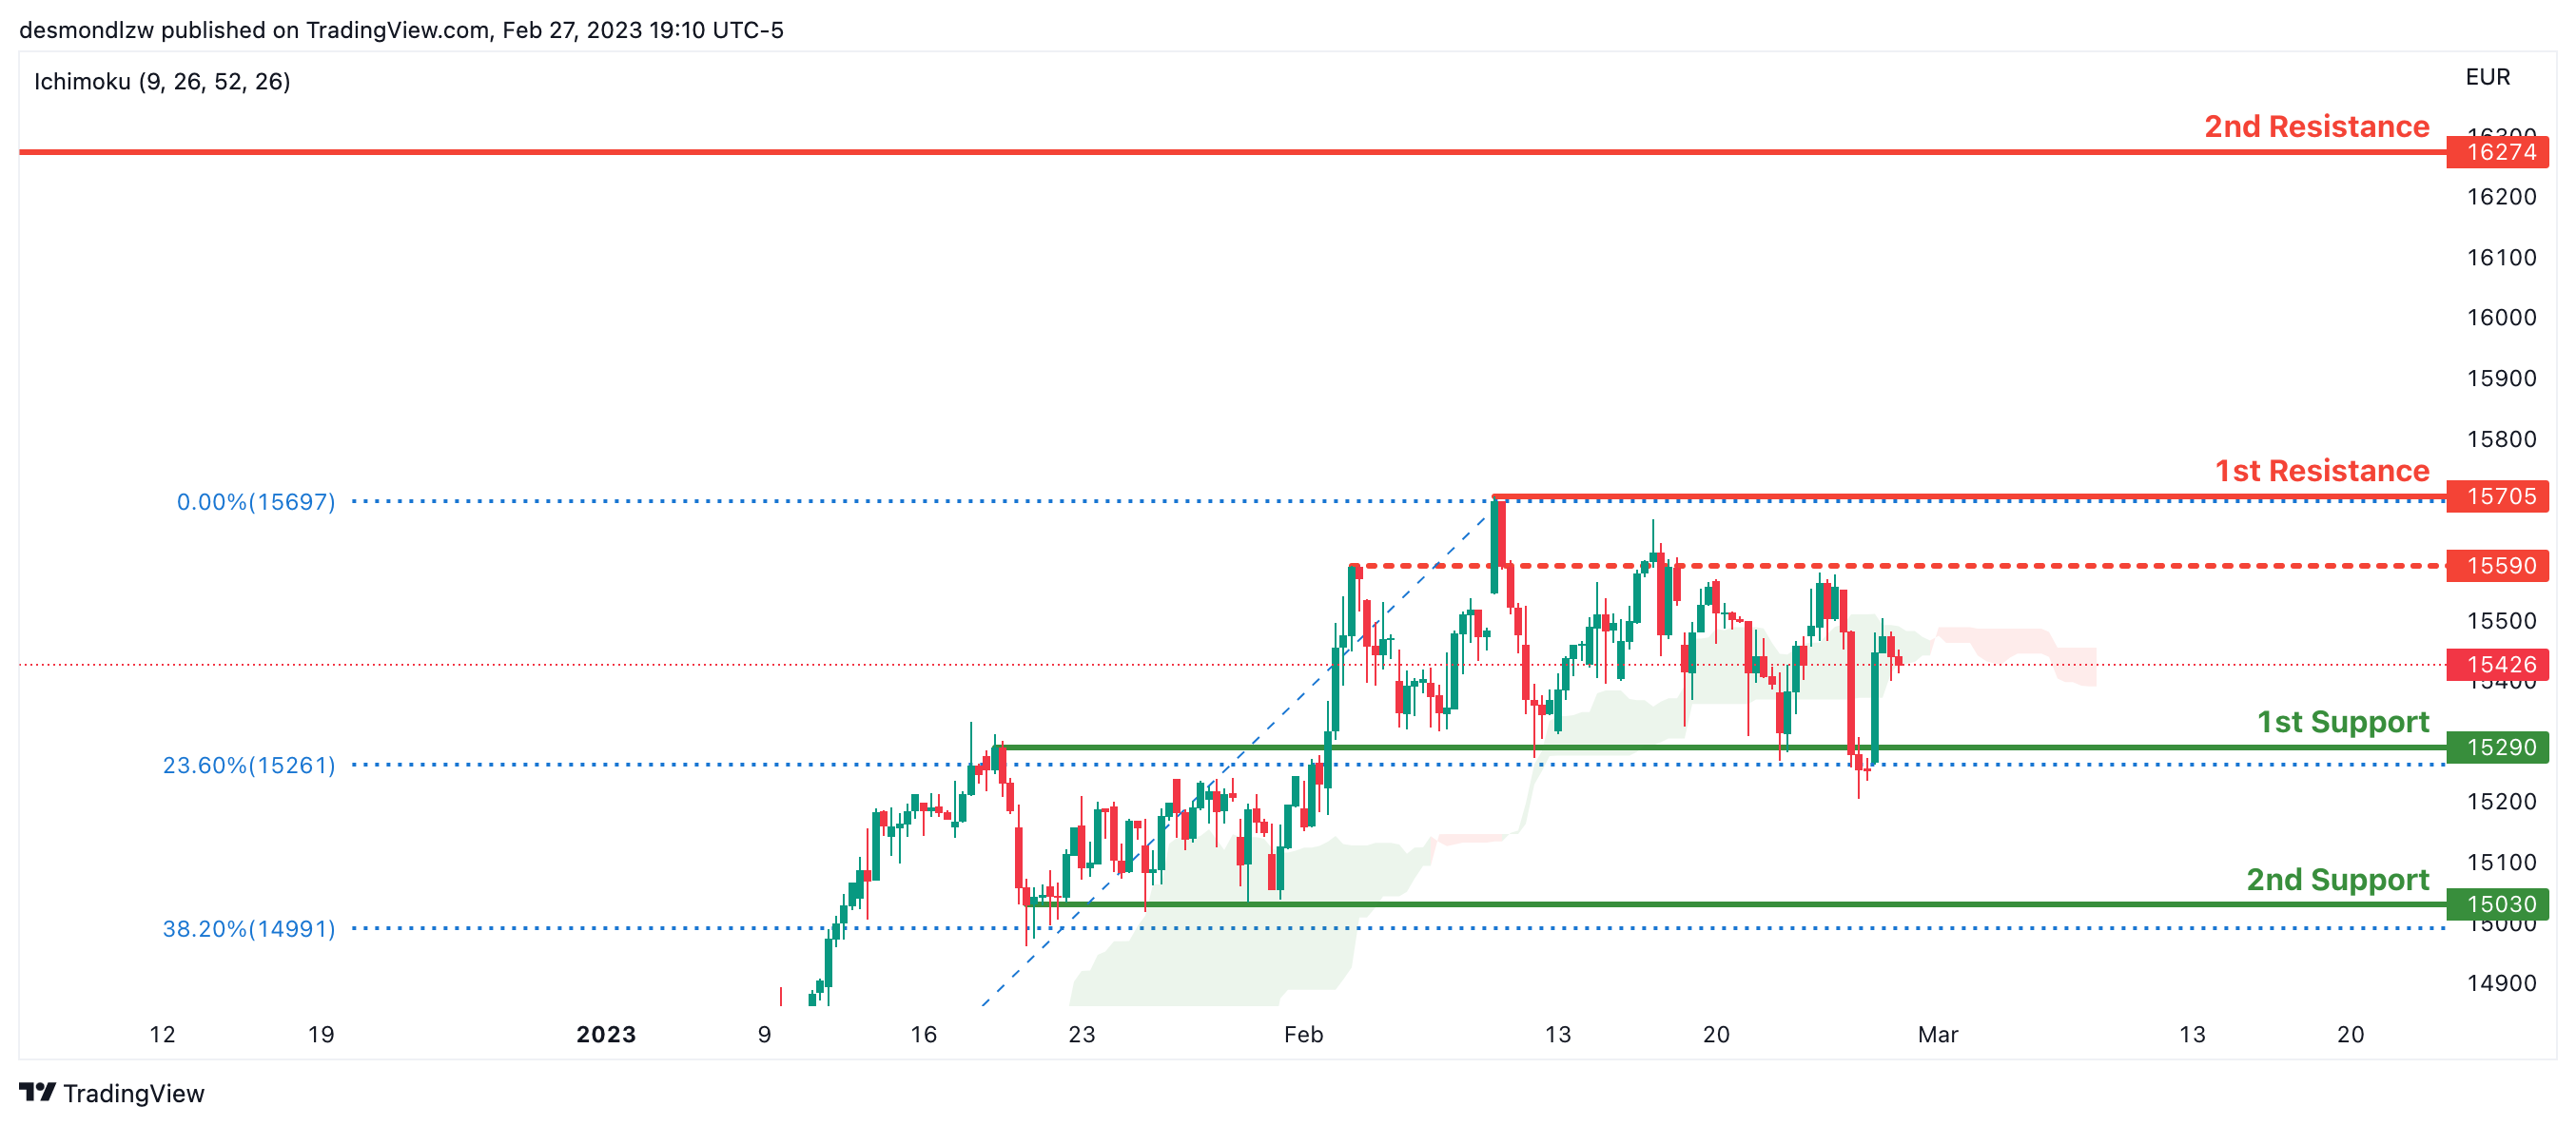
DAX:
Looking at the H4 chart, my overall bias for DAX is bullish. However price has crossed below the Ichimoku cloud which indicates a possible shift to bearish market structure.If this bearish momentum continues, expect the price to possibly head towards the 1st support line at 15290, where the overlap support intersects with the 23.6% Fibonacci line.In an alternative scenario, price could possibly head up to retest the 1st resistance at 15705 where the recent high is.
Areas of consideration:
- H4 time frame, 1st resistance is at 15705
- H4 time frame, 1st support is at 15290
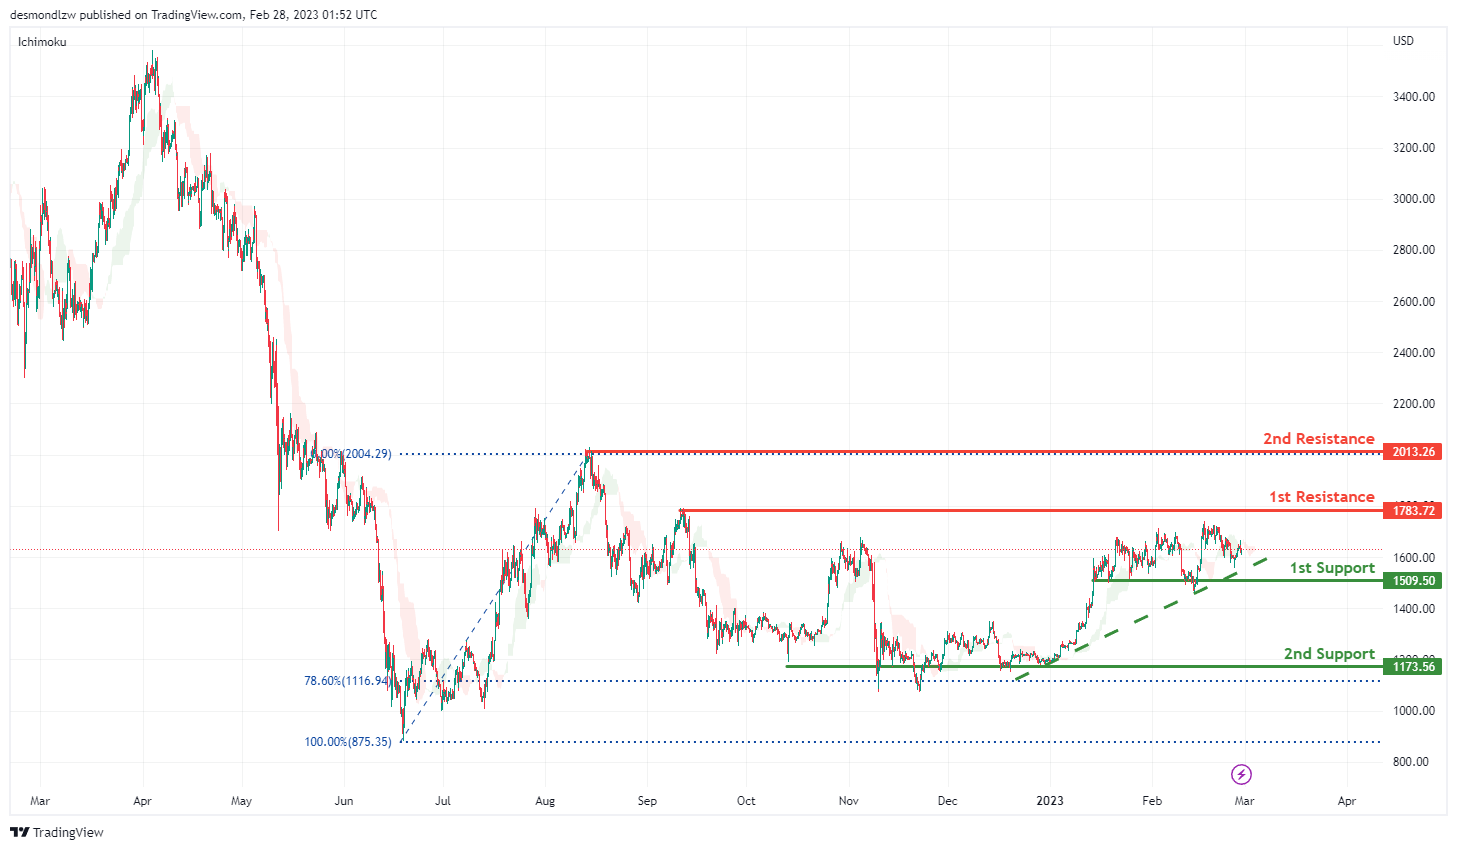
ETHUSD:
Looking at the H4 chart, my overall bias for ETHUSD is slightly bearish, even though there is a strong ascending trend line, the price may head back to retest the 1st support that intersects with the ascending trend line, before it goes up and break the 1st resistance line at 1783.72 before breaking the 2nd resistance line at 2013.26 which is the previous swing high.
In an alternate scenario, the price may retrace back to the 1st support line at 1509.50 which is the recent overlap support before it heads towards the 2nd support at 1173.56 which is in line with 78.6% Fibonacci retracement.
Areas of consideration:
- H4 time frame, 2nd resistance of 2013.26
- H4 time frame, 1st resistance of 1783.72
- H4 time frame, 1st support at 1509.50
- H4 time frame, 2nd support at 1173.56
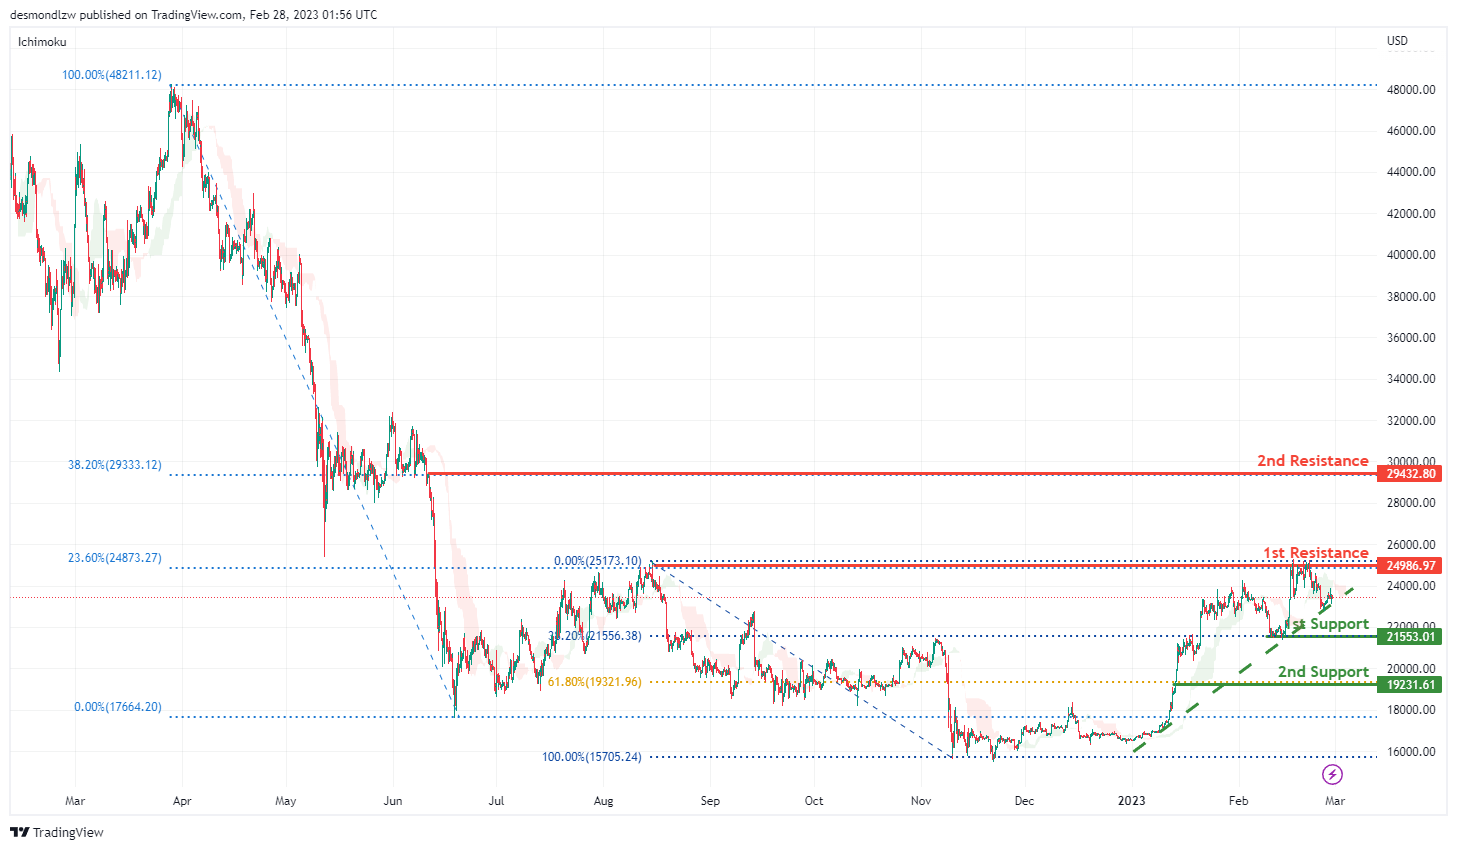
BTCUSD:
Looking at the H4 chart, my overall bias for BTCUSD is bullish. As there is an ascending trend line, expect the price may head back to retest an the ascending trend line, before it goes up and break the 1st resistance at 24986.97 which is the overlap recent swing high, before it head up to the 2nd resistance 29432.80 where the 38.2% Fibonacci retracement is.
In an alternate scenario, The price may go down towards the 1st support line at 21553.01 which is in line with 38.2% Fibonacci retracement, before heading down towards the 2nd support at 19231.61 which is in line with 61.8% Fibonacci retracement.
Areas of consideration:
- H4 time frame, 2nd resistance 29432.80
- H4 time frame, 1st resistance 24986.97
- H4 time frame, 1st support at 21553.01
- H4 time frame, 2nd support at 19231.61
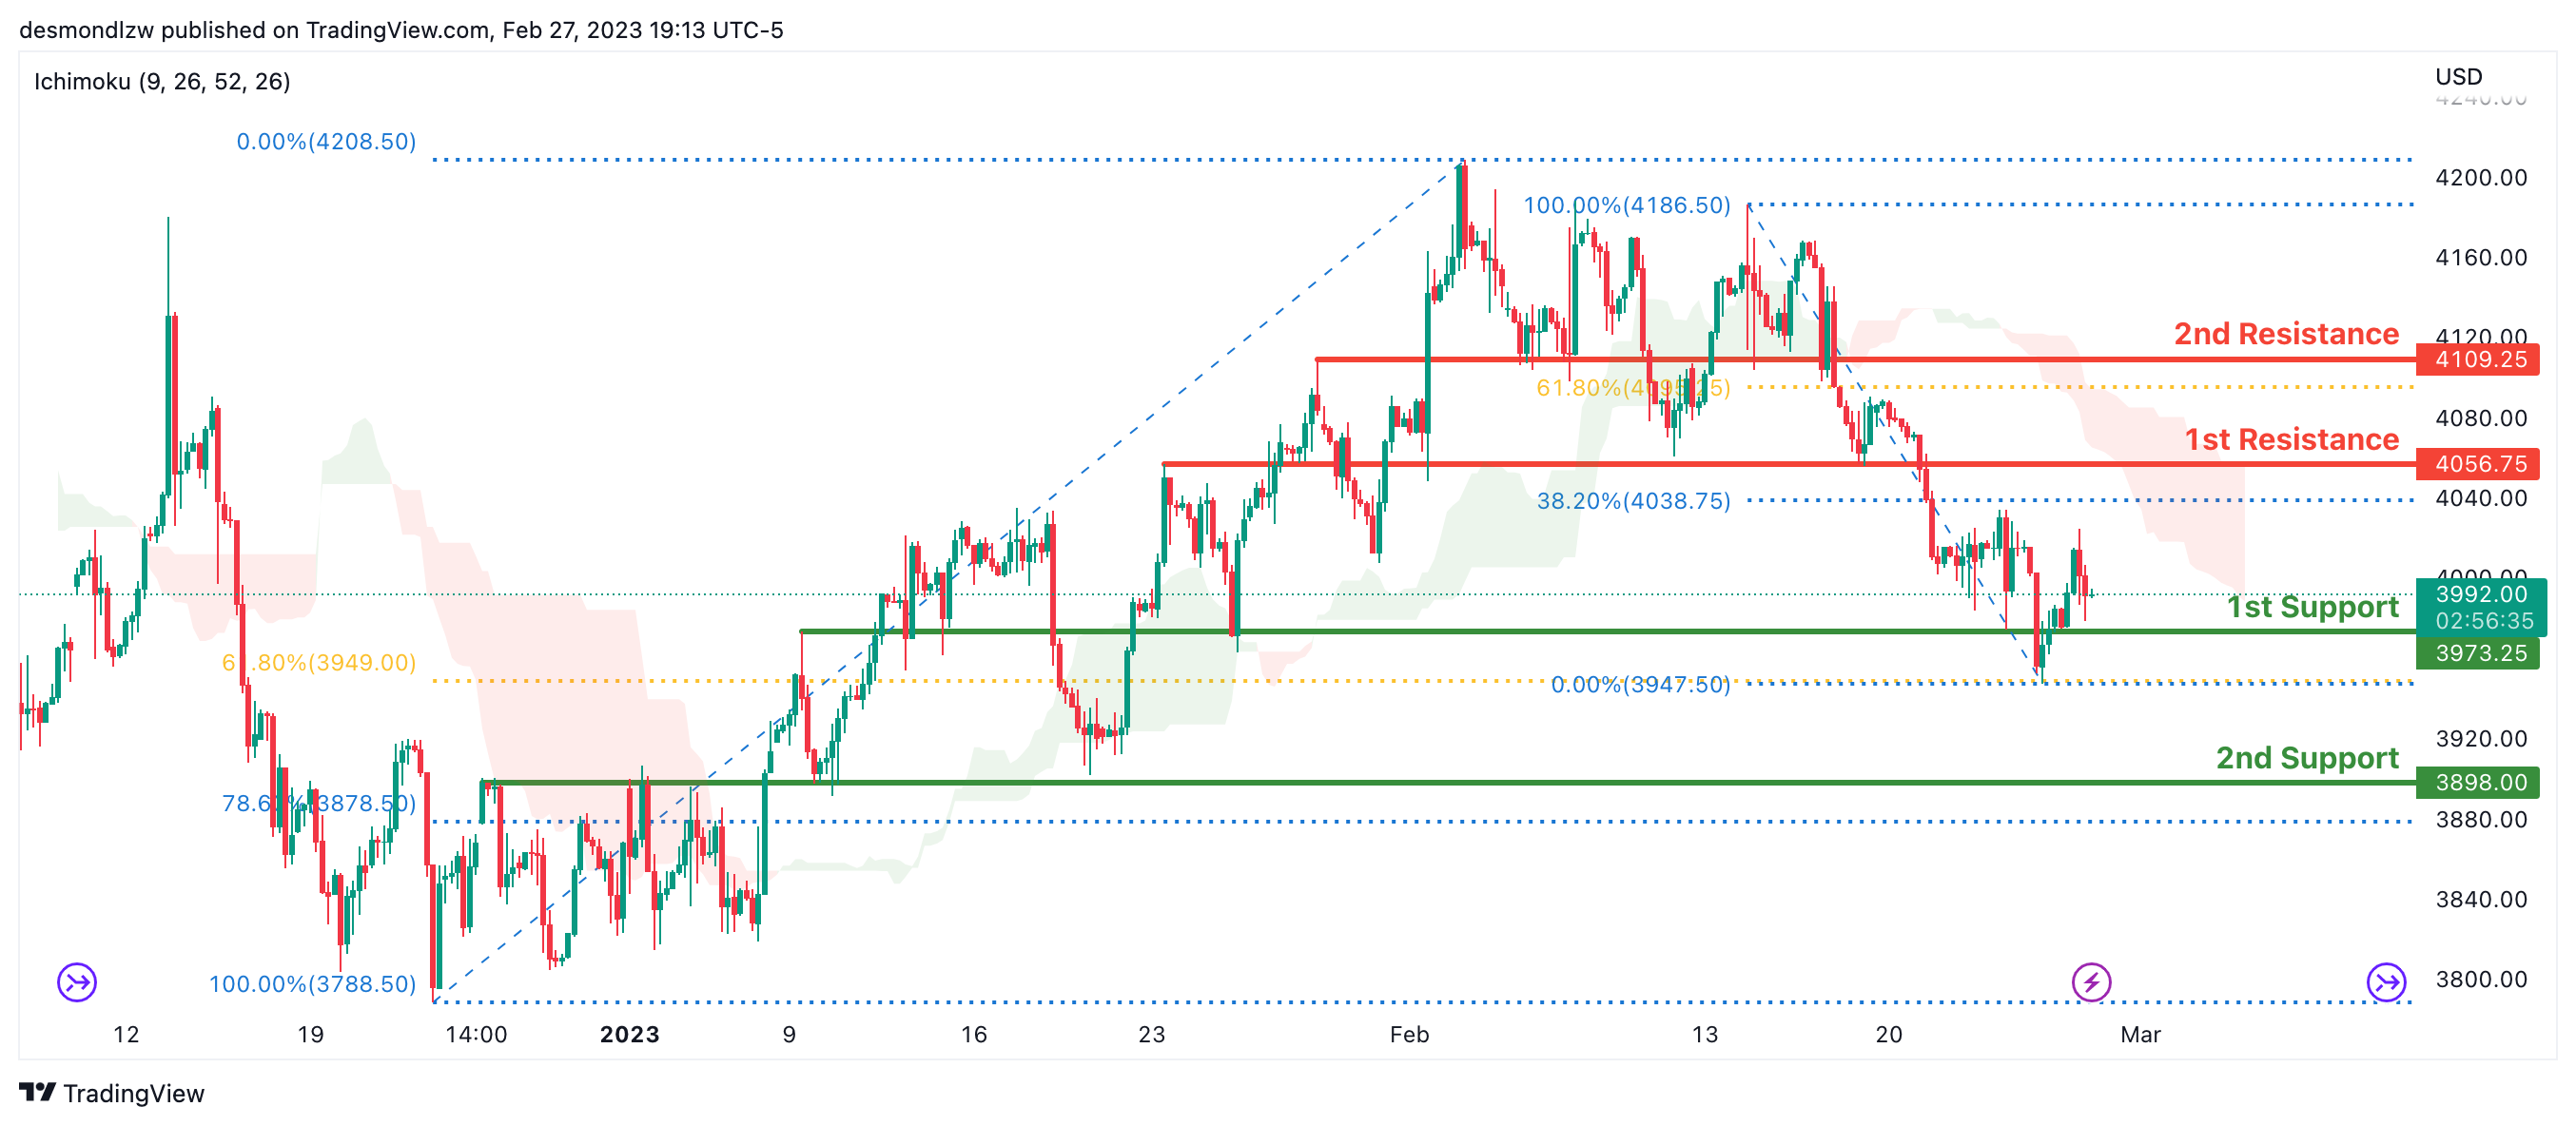
S&P 500:
Looking at the H4 chart, my overall bias for S&P500 is bearish due to the current price being below the Ichimoku cloud, indicating a bearish market.If this bearish momentum continues, expect the price to continue heading towards the 1st support at 3973.25 where the overlap support intersects with the 61.8% Fibonacci line.
In an alternative scenario, price could possibly head back up to retest the 1st resistance at 4056.75 which is the overlap resistance and 38.2% Fibonacci line is.
Areas of consideration:
- H4 time frame, 1st support at 3973.25
- H4 time frame, 1st resistance at 4056.75


