
DXY:
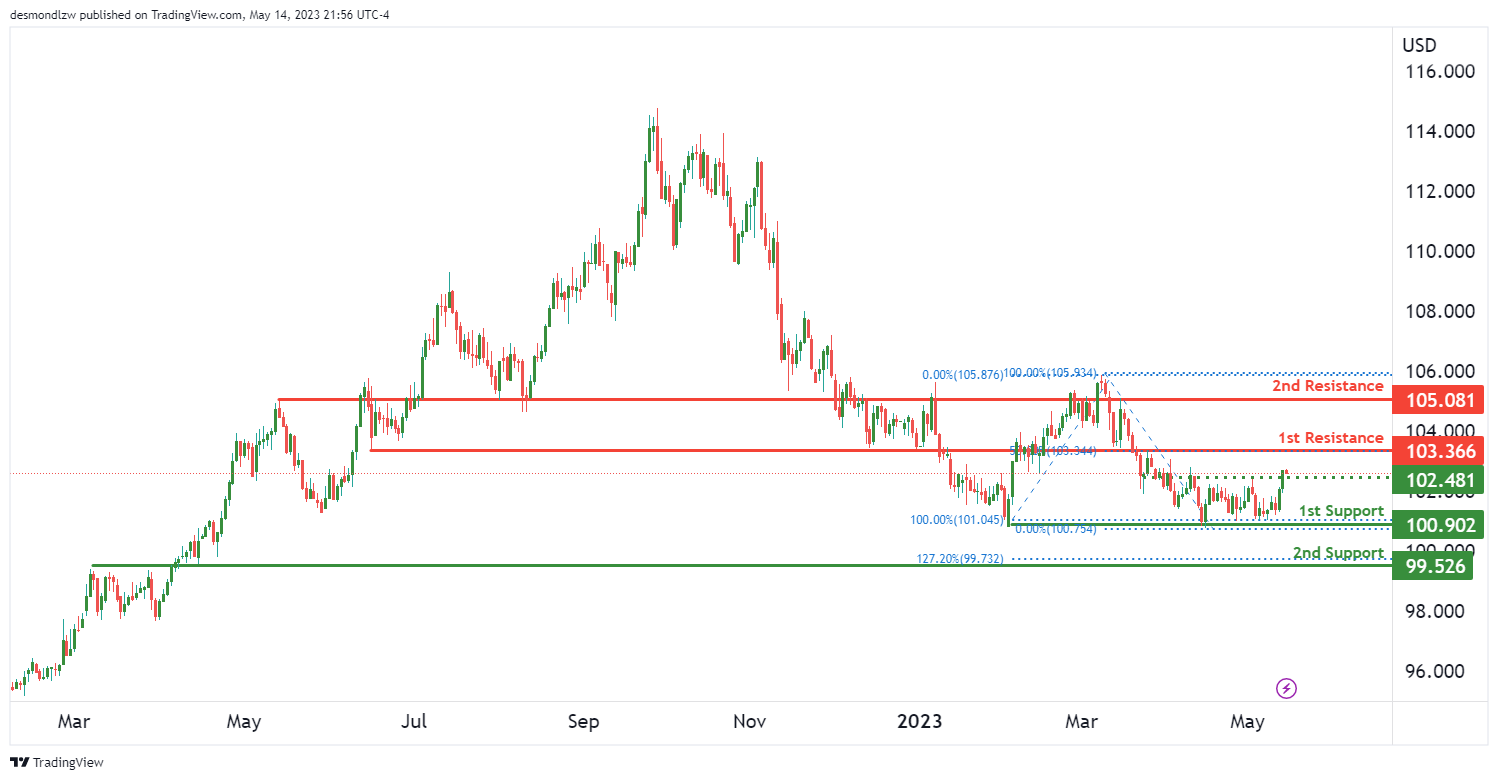
The DXY is currently demonstrating strong bullish momentum, suggesting potential for price continuation towards the first resistance level.
The price is supported at the first support level of 100.90. This level has served as a multi-swing low support, indicating its significance in the price structure of DXY. A bounce from this support could steer the price towards the first resistance level.
The first resistance lies at 103.36. This level is an overlap resistance, which coincides with a 50% Fibonacci retracement level. This combination makes it a strong barrier for the price. If the price successfully negotiates this resistance, it could potentially trigger a stronger bullish momentum.
An intermediate support level has been identified at 102.58. This level, an overlap support, could serve as a stepping stone for the price if it breaks through the first resistance.
However, should the price decline below the first support, it might drop to the second support level at 99.52. This level, which aligns with an overlap support and the 127.20% Fibonacci Extension, has proven to be a reliable base in the past.
On the upside, if the price breaks through the first resistance, it could potentially ascend towards the second resistance level at 105.08, another significant overlap resistance.
EUR/USD:
EUR/USD is currently demonstrating strong bullish momentum, largely supported by its position above a major ascending trend line. This suggests potential for further bullish momentum.
However, in the short term, the price could potentially drop further to the first support level at 1.0789 before bouncing back. This level has proven to be a solid overlap support and aligns with a 50% Fibonacci retracement, enhancing its reliability as a price floor.
Once the price bounces off the first support, it could rise to the first resistance level at 1.1033. This level has functioned as a multi-swing high resistance in the past, suggesting it’s a strong barrier for the price.
In the event of a stronger bearish retracement, the second support level comes in at 1.0516. This level is a significant multi-swing low support and could provide a springboard for the price if it drops below the first support.
On the other hand, should the price break above the first resistance, it could potentially rise towards the second resistance level at 1.1166. This level is an overlap resistance and aligns with the 127.20% Fibonacci Extension, suggesting it could be a major hurdle for bullish continuation.
GBP/USD:
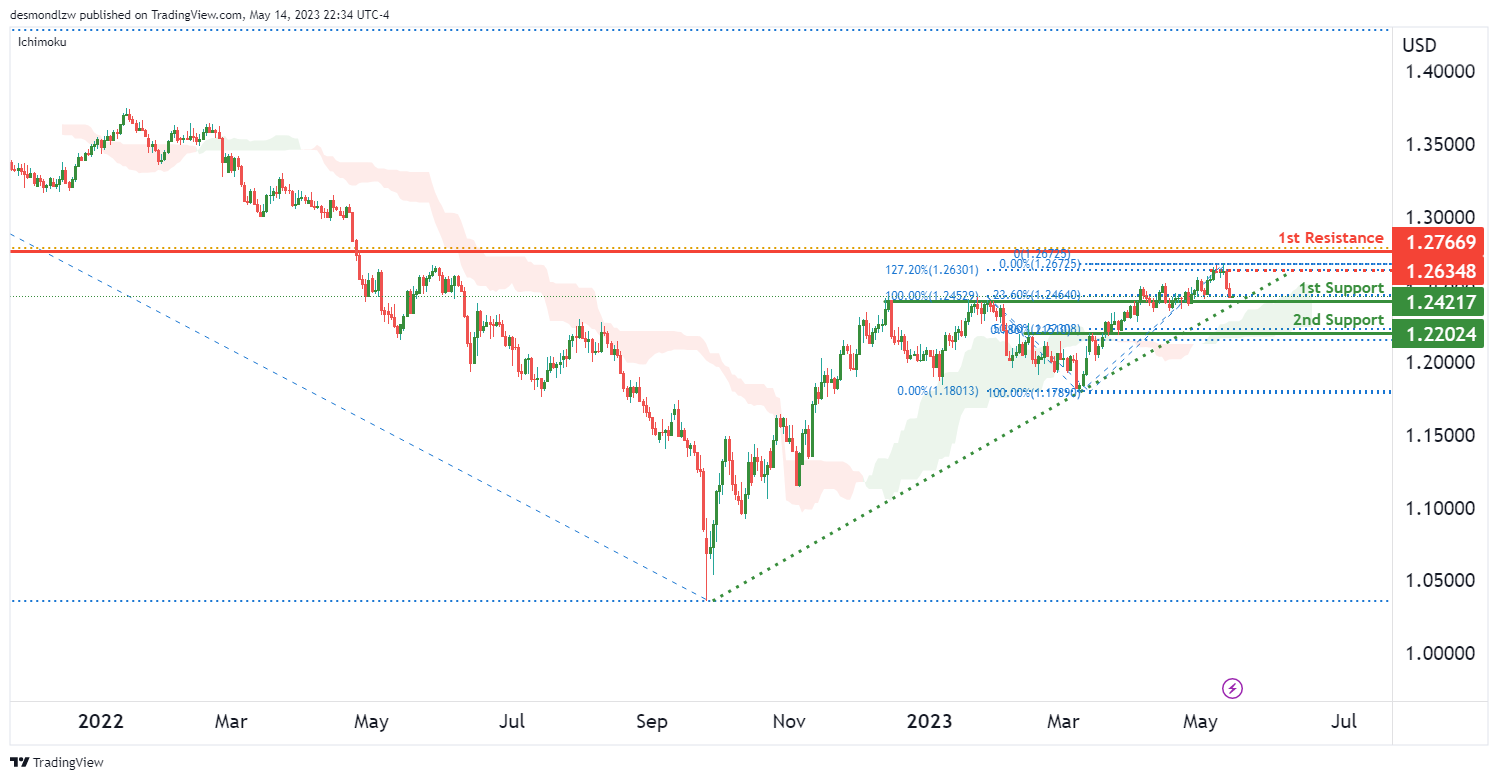
The GBP/USD is currently exhibiting strong bullish momentum, primarily driven by its position above a major ascending trend line and its position above the bullish Ichimoku cloud, both of which suggest potential for further bullish momentum.
In the near term, the price could potentially make a bullish bounce off the first support at 1.2421 and rise towards the first resistance. The 1.2421 level is a strong overlap support, reinforced by the 23.6% Fibonacci retracement, making it a reliable price floor.
If the price manages to bounce off the first support, it could rise towards the first resistance at 1.2766. This level has been a significant pullback resistance in the past, indicating it’s a strong price ceiling.
Between the current price and the first resistance, there lies an intermediate resistance at 1.2634. This level, which is a multi-swing high resistance and coincides with the 127.20% Fibonacci Extension, could pose an additional hurdle for the price on its journey towards the first resistance.
However, if the price drops below the first support, it could potentially slide towards the second support level at 1.2202, which also serves as an overlap support.
USD/CHF:
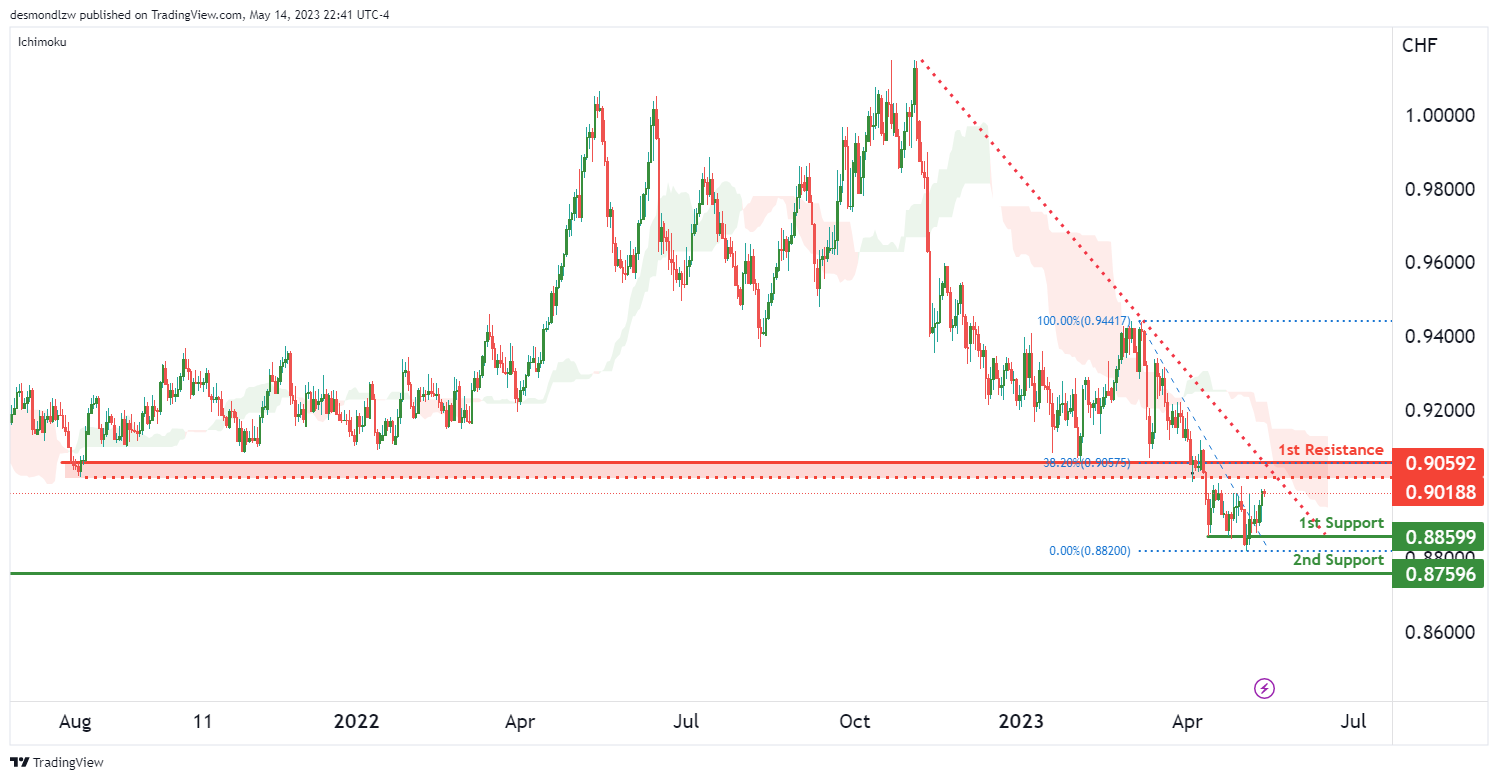
The USD/CHF is currently exhibiting significant bearish momentum, as indicated by its position below a major descending trend line and the bearish Ichimoku cloud. These factors suggest the potential for further bearish momentum.
In the near term, the price could potentially react bearishly off the first resistance at 0.9059 and drop to the first support. This resistance level has been a significant pullback resistance in the past and coincides with the 38.2% Fibonacci retracement, indicating it’s a strong price ceiling.
Should the price reject this resistance, it could drop towards the first support at 0.8859. This level has been a multi-swing low support and is reinforced by the 23.6% Fibonacci retracement, making it a reliable price floor.
Between the current price and the first resistance, there is an intermediate resistance at 0.9018. This level, a pullback resistance, could present an additional hurdle for the price on its journey towards the first resistance.
If the price drops below the first support, it could potentially descend towards the second support level at 0.8759, which is a swing low support.
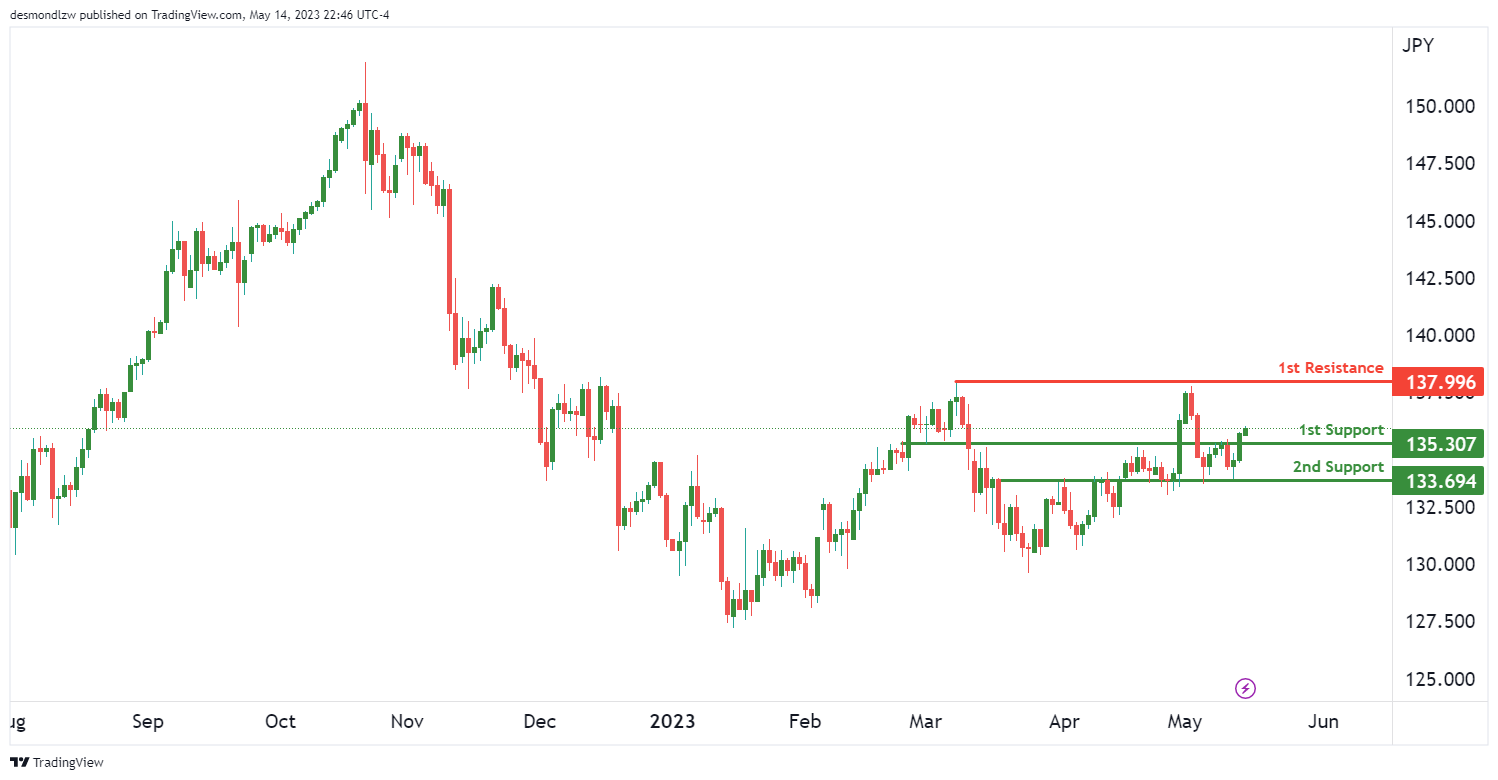
USD/JPY:
The USD/JPY is currently demonstrating a bullish momentum, suggesting potential for further upward movement.
In the near term, we could potentially see a bullish continuation towards the first resistance level at 137.99. This level has served as a swing high resistance in the past, indicating it could pose a significant challenge for the price.
However, before reaching the first resistance, the price might face some downward pressure. If this occurs, the first support level at 135.30 could provide a safety net. This level is an overlap support, suggesting it is a reliable price floor.
If the price drops below the first support, it could potentially move towards the second support level at 133.69, another overlap support, providing a secondary safety net.
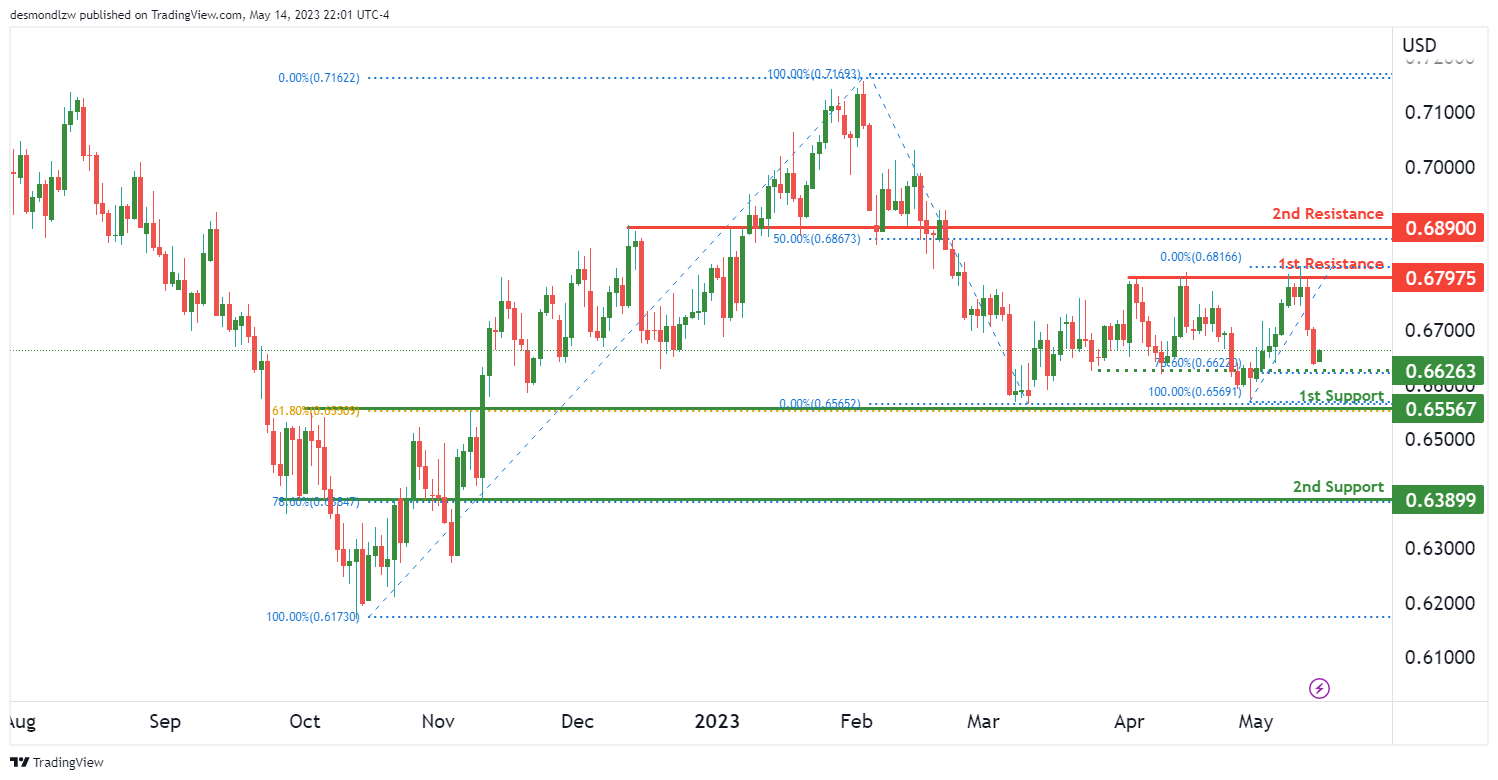
AUD/USD:
The AUD/USD is currently on a bullish trend, suggesting further upward momentum might be on the horizon.
In the near term, we could potentially see a bullish continuation towards the first resistance at 0.6797. This level has served as a multi-swing high resistance in the past, indicating it could pose a significant hurdle for the price.
Before it reaches this resistance, the price might face some downward pressure. If this occurs, the first support level at 0.6556 could provide a safety net. This level is an overlap support and coincides with the 61.8% Fibonacci retracement, suggesting it’s a reliable price floor.
Between the current price and the first resistance, there is an intermediate support at 0.6626. This level, a pullback support, aligns with the 78.6% Fibonacci retracement and could provide a short-term floor for the price.
If the price drops below the first support, it could potentially descend towards the second support level at 0.6389, which is an overlap support and coincides with the 78.6% Fibonacci retracement.
Should the price break through the first resistance, it could potentially rise towards the second resistance level at 0.6890, which has been an overlap resistance in the past.
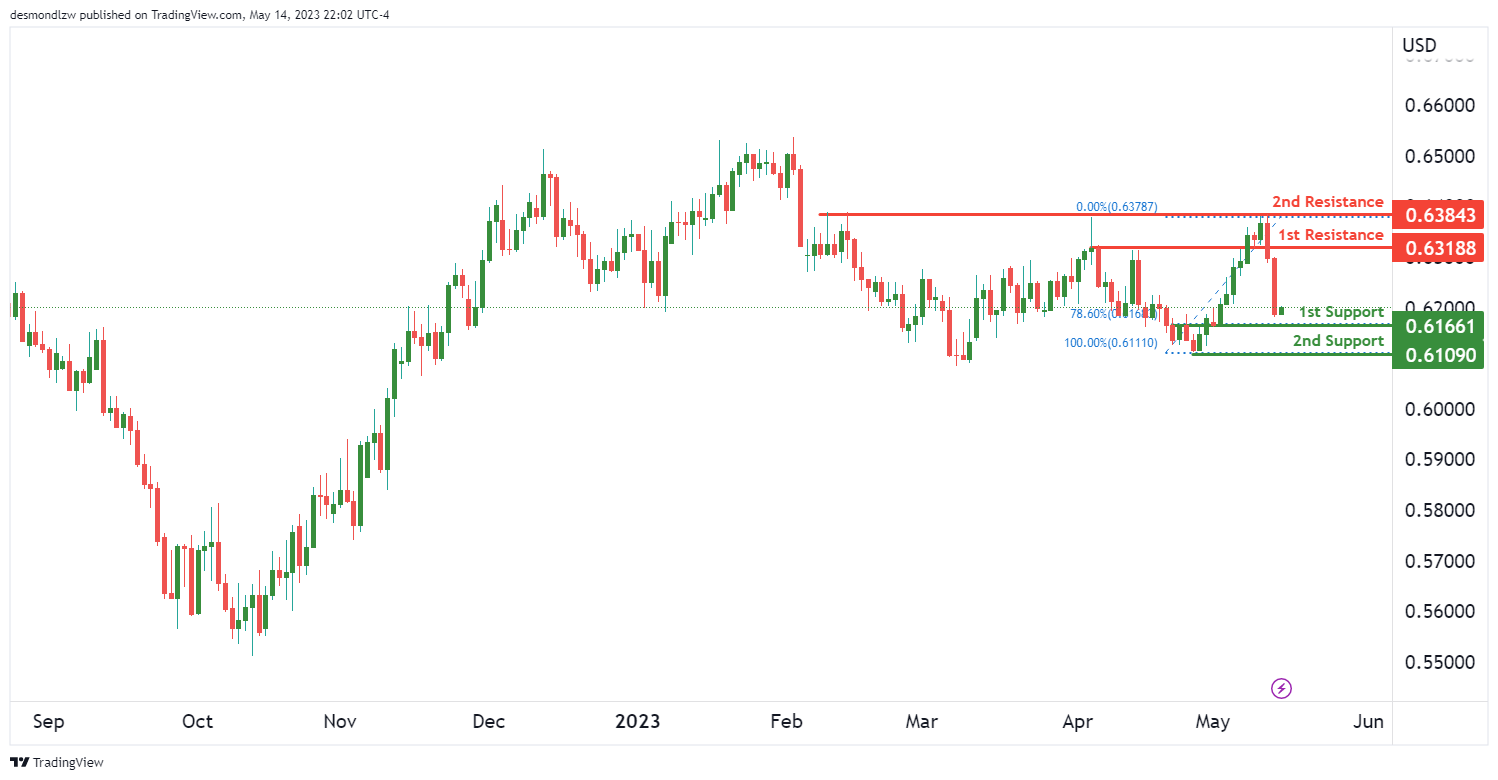
NZD/USD
The NZD/USD is currently exhibiting bullish momentum, suggesting potential for further upward movement.
In the near term, we might witness a bullish continuation towards the first resistance level at 0.6318. This level has served as a pullback resistance in the past, indicating it could pose a significant challenge for the price.
However, before reaching this resistance, the price might face some downward pressure. If this occurs, the first support level at 0.6166 could provide a safety net. This level is an overlap support and coincides with the 78.6% Fibonacci retracement, suggesting it’s a reliable price floor.
If the price drops below the first support, it could potentially move towards the second support level at 0.6109, which has been a swing low support in the past, providing an additional safety net.
Should the price breach the first resistance, it could potentially rise towards the second resistance level at 0.6384. This level has been a multi-swing high resistance in the past, indicating it could be a significant price ceiling.
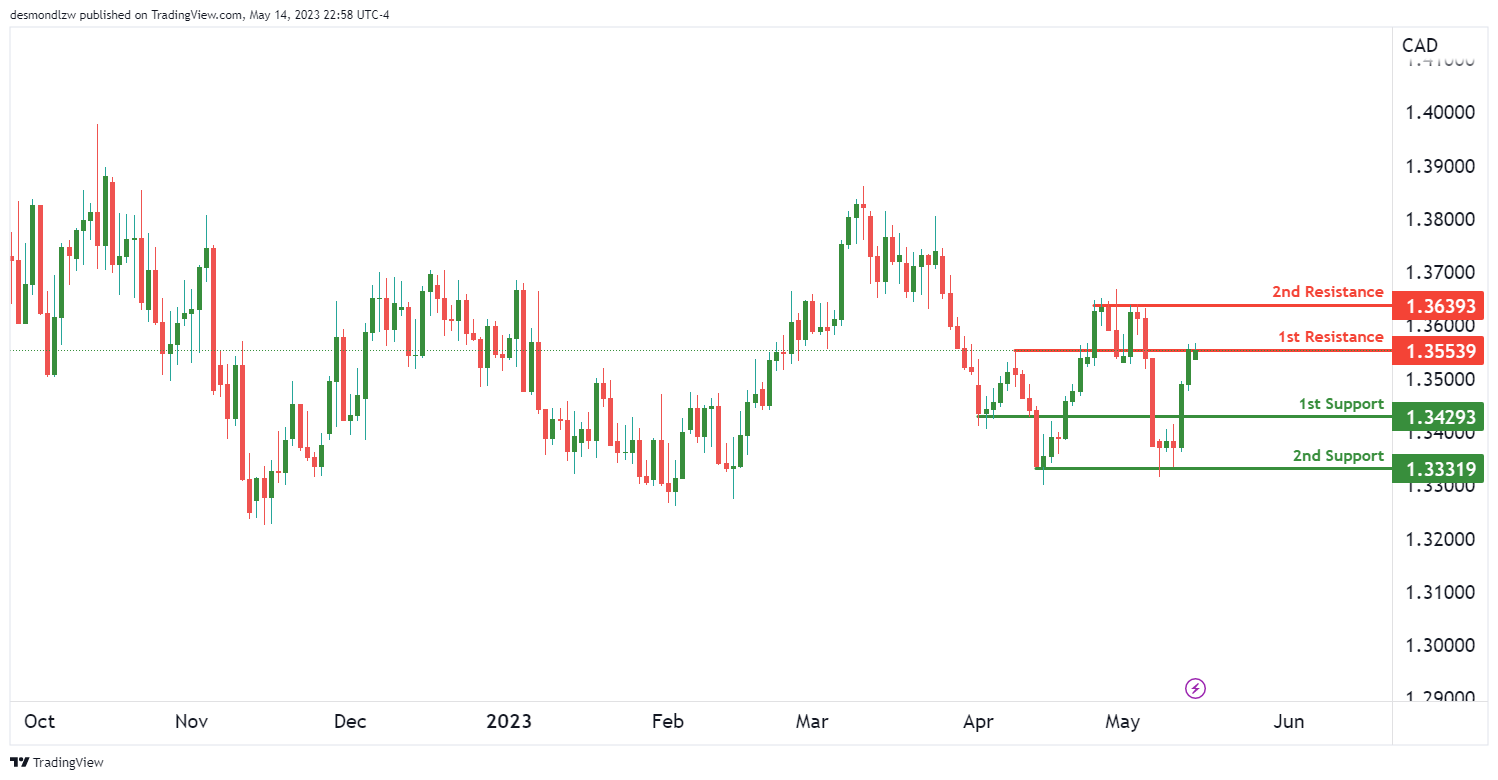
USD/CAD:
The CAD/USD is currently on a bearish trend, suggesting that further downward momentum might be in the offing.
In the near term, we could potentially witness a bearish reaction off the first resistance level at 1.3553, leading to a drop towards the first support level at 1.3429. The resistance level has served as an overlap resistance in the past, indicating it could pose a significant barrier for the price. Meanwhile, the first support level has acted as a pullback support, suggesting it’s a likely stopping point for any price decline.
If the price were to breach the first support, it could potentially descend towards the second support level at 1.3331. This level has been a multi-swing low support in the past, providing an additional safety net for the price.
Conversely, if the price were to break through the first resistance, it could potentially rise towards the second resistance level at 1.3639. This level has been a multi-swing high resistance in the past, indicating it could be a significant price ceiling.
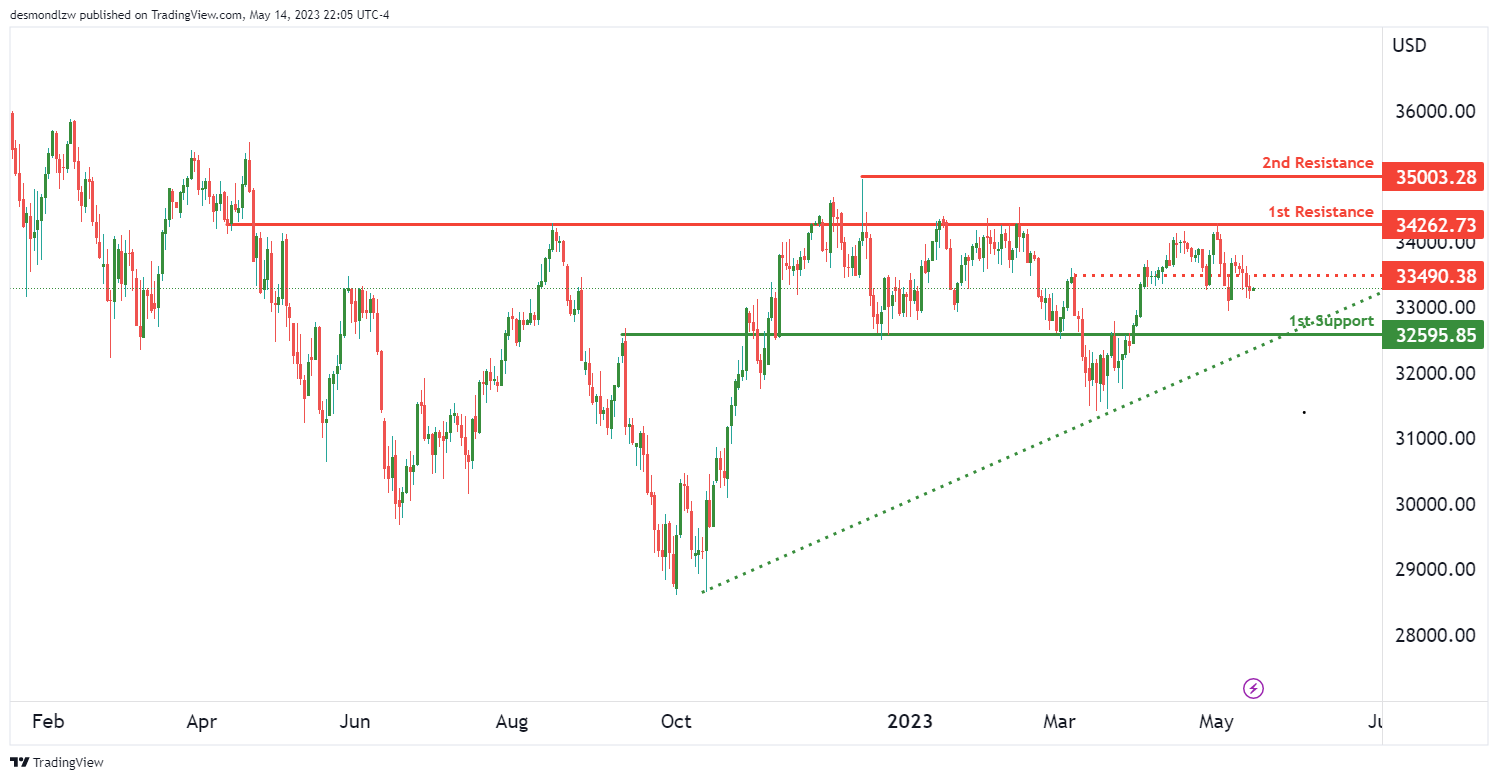
DJ30:
Currently, the DJ30 exhibits a bullish momentum, with the price above a major ascending trend line, suggesting we might see further bullish momentum.
In the short term, the price could potentially drop further to the first support level at 32595.85 before bouncing off this point and rising towards the first resistance level at 34262.73. The first support level has previously acted as a pullback support, which could provide a strong foundation for the price.
The first resistance level at 34262.73 has previously served as an overlap resistance, indicating it could be a significant hurdle for the price. If the price were to break this level, it could trigger a stronger bullish acceleration towards the second resistance level at 35003.28, which has acted as a swing high resistance in the past.
An intermediate resistance at 33490.38 lies between the current price and our first resistance. If the price were to break this intermediate resistance, it could potentially spur a bullish acceleration towards the first resistance.
GER30:
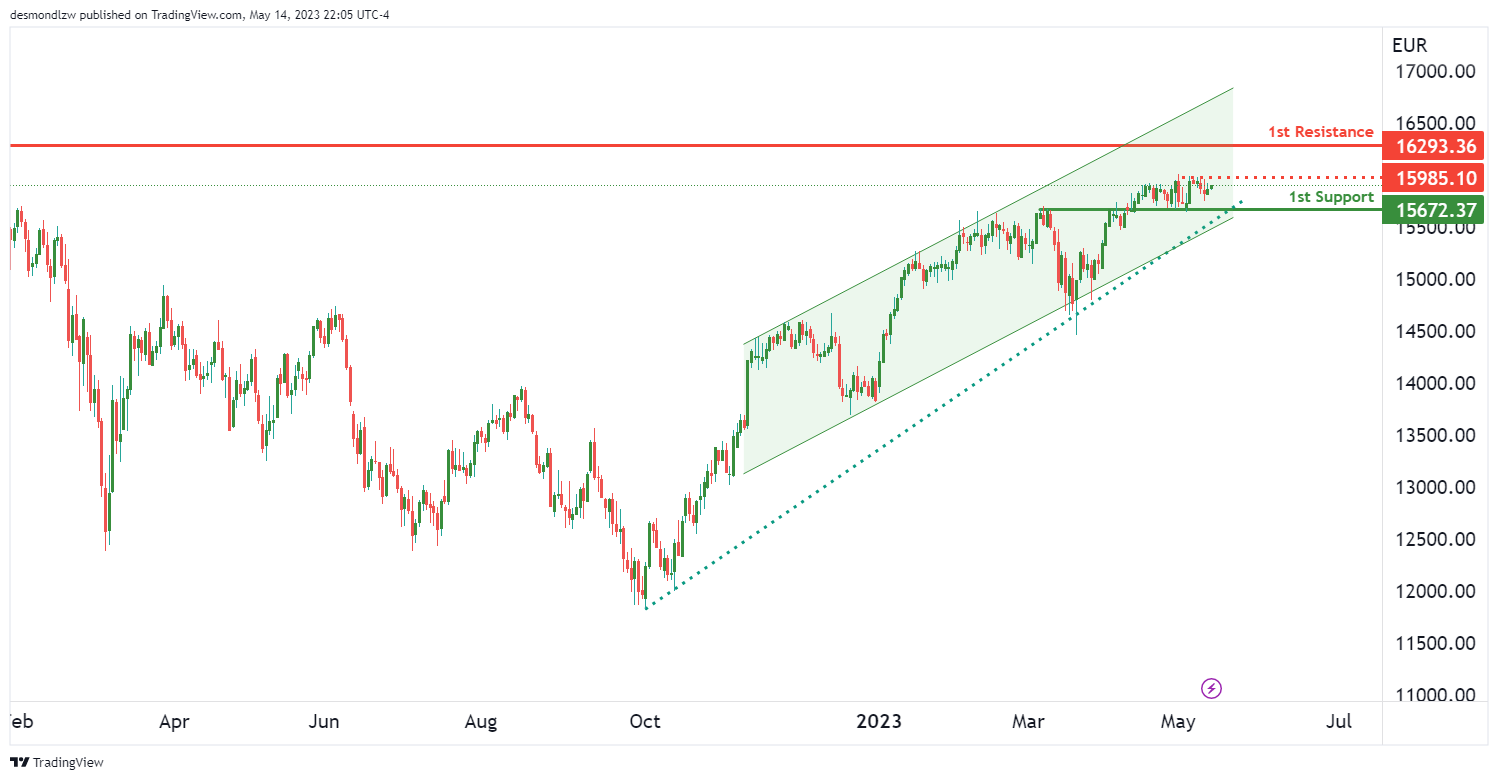
The GER30 currently maintains a bullish momentum, with price situated above a significant ascending trend line, suggesting a further bullish momentum could be on the horizon. Moreover, the price is within a bullish ascending channel, which suggests that the price might continue to rise due to its bullish momentum.
In the short term, we could see the price drop to the first support level at 15672.37 before rebounding from there and rising towards the first resistance level at 16293.36. The first support level is a strong pullback support, which could provide a solid base for the price.
The first resistance level at 16293.36 has previously acted as a swing high resistance, making it a possible challenge for the price. If the price manages to break this level, it could trigger a stronger bullish acceleration.
An intermediate resistance level lies at 15985.10, between the current price and our first resistance. If the price were to surpass this intermediate resistance, it could potentially spur a bullish acceleration towards the first resistance.

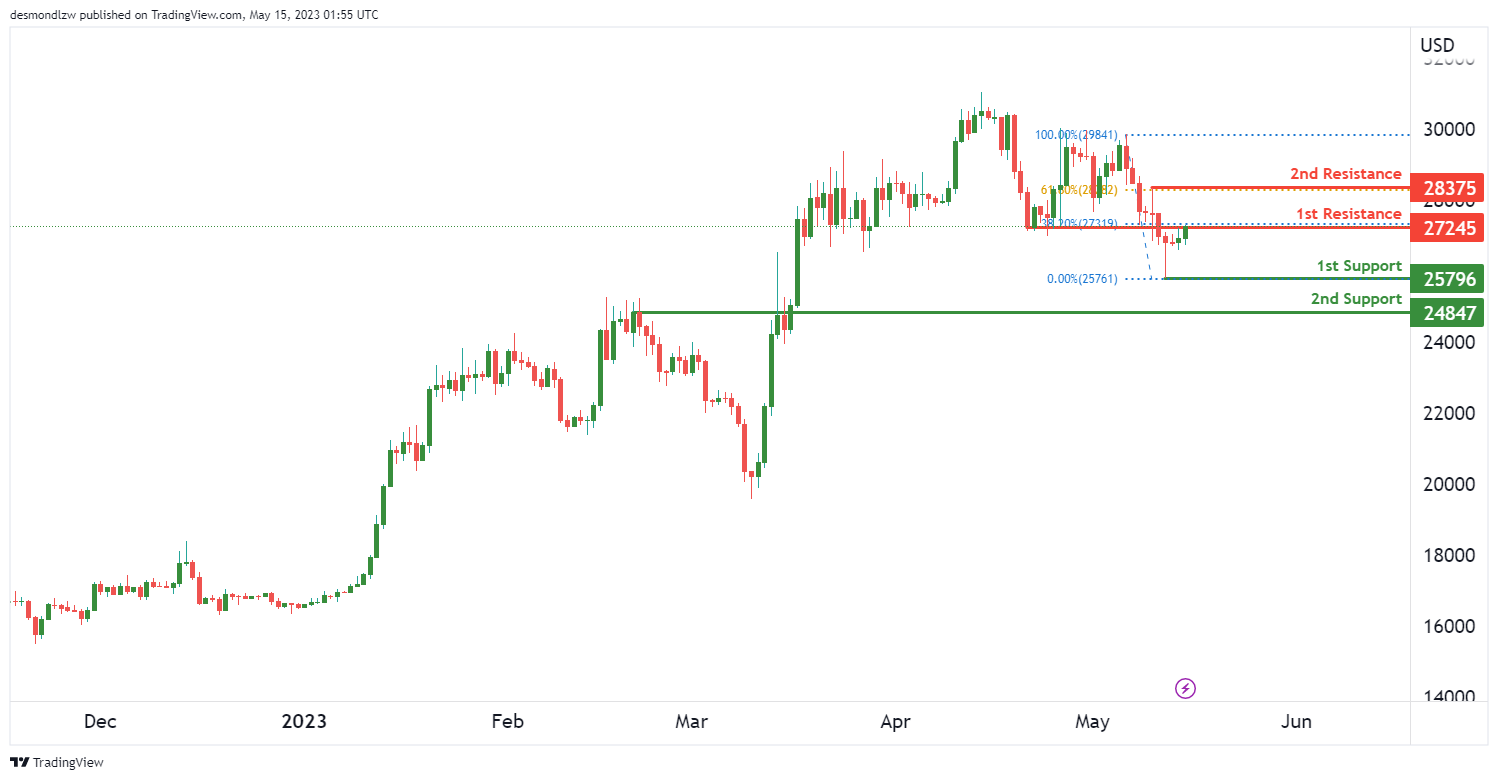
BTC/USD:
The overall momentum for BTC/USD appears to be bearish, with a potential for a bearish reaction off the first resistance and a subsequent drop to the first support.
The first support level is at 25796.00, which has acted as a swing low support in the past. This could potentially provide a good base for the price if it drops from the current levels. If the price breaks this support level, the next potential support to consider is the second support at 24847.00. This level has acted as a pullback support previously, suggesting that it could serve as a strong base for prices.
The first resistance level is at 27245.00, a level that has acted as an overlap resistance in the past. The price is currently testing this level, which also aligns with the 38.2% Fibonacci retracement level, suggesting that it’s a significant level to watch for potential price reactions. If the price were to reverse at this level, it could lead to a continuation of the bearish trend.
The second resistance level is at 28375.00, which coincides with a swing high resistance and a 61.8% Fibonacci retracement level. If the price were to break the first resistance, this level could be the next target for the bullish scenario.
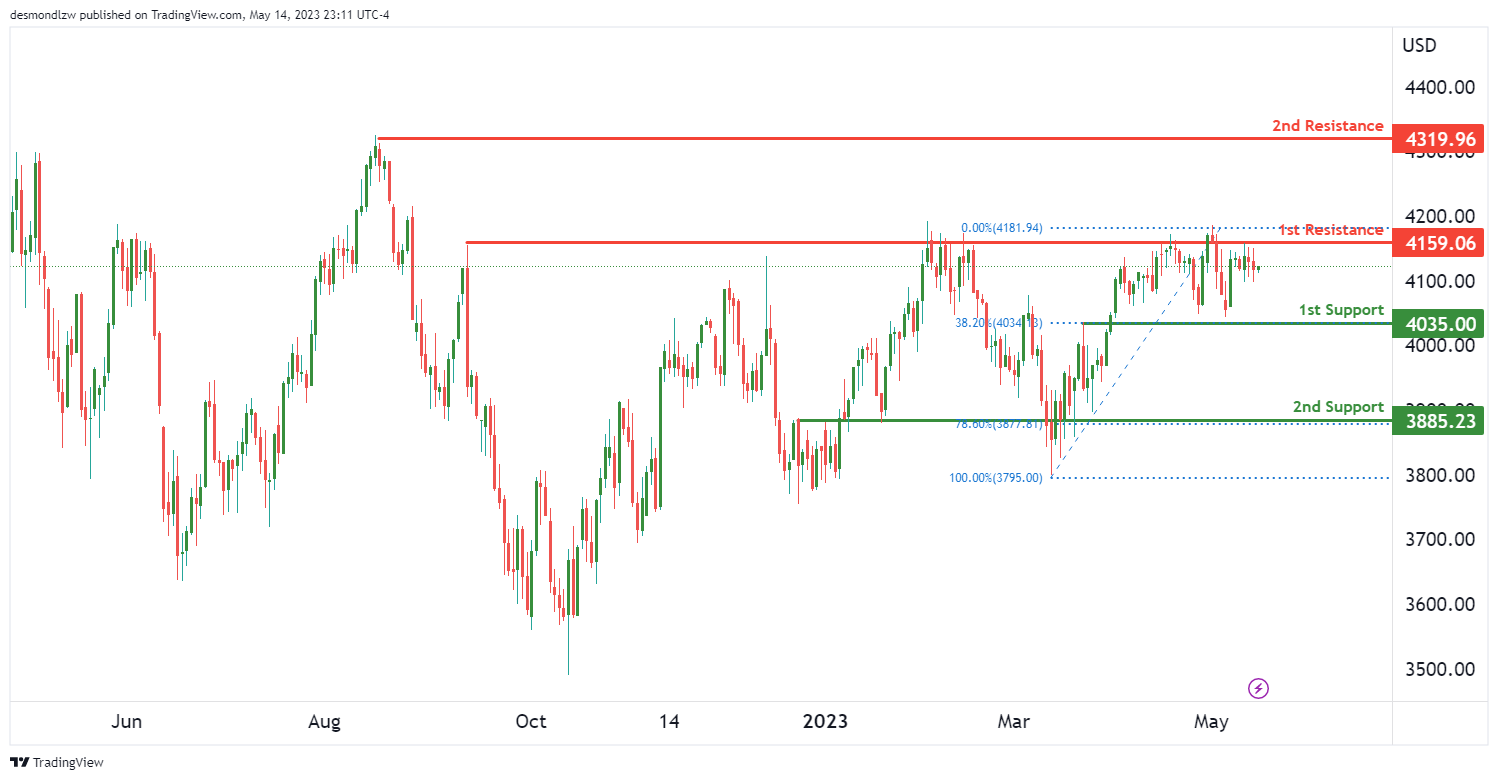
US500
The current momentum for US500 is exhibiting a bearish trend, with the potential for a bearish reaction off the first resistance and a subsequent drop to the first support.
The first support level is located at 4035.00. This is an important level as it coincides with an overlap support and the 38.2% Fibonacci retracement, suggesting a possible area where the price could find some ground if it continues to decline. If the price breaches this support, we could see it descend further to the second support level at 3885.23. This level has also acted as an overlap support and aligns with the 78.6% Fibonacci retracement, potentially offering a robust base for prices.
On the upside, the first resistance level is at 4159.06. This level has previously acted as a multi-swing high resistance, implying that it could serve as a significant hurdle for any bullish price action. If the price can break through this resistance, the next target on the upside could be the second resistance level at 4319.96, which is a previous swing high resistance.
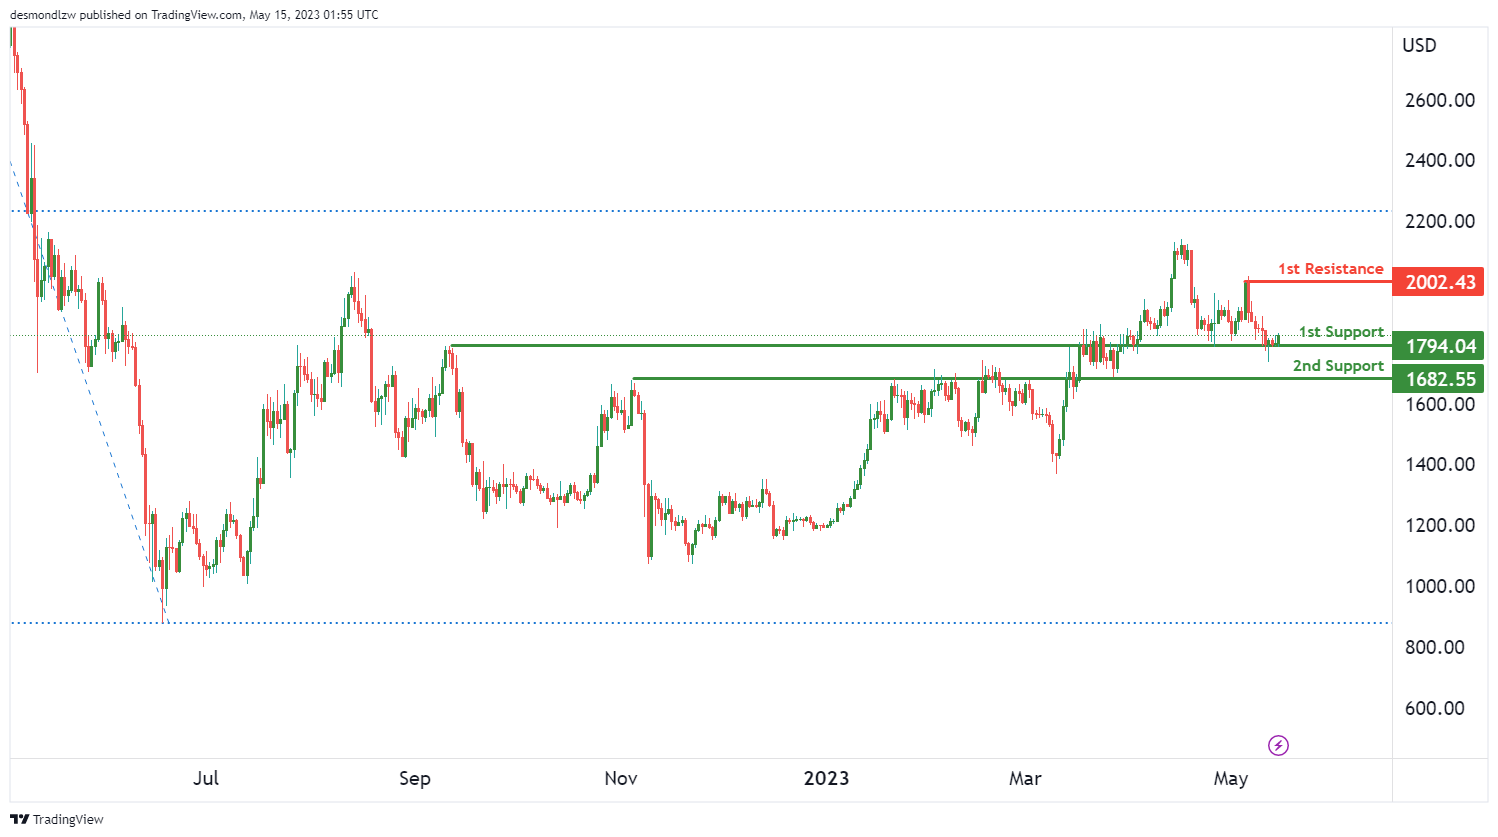
ETH/USD:
Ethereum’s (ETH/USD) chart shows an overall bullish momentum, suggesting potential for a bullish bounce off the first support, leading towards the first resistance.
The first support is found at $1794.04. This level is identified as an overlap support, indicating it has been tested multiple times and has proven to be a reliable point where the price has previously found buying interest. If the price were to drop, this could be a pivotal zone where buyers might step in again.
Further down, the second support stands at $1682.55. This level, similar to the first, has acted as an overlap support, reinforcing the strength of this price point as a potential floor for Ethereum.
On the upside, the first resistance is at $2022.43. This level has previously served as a multi-swing high resistance, suggesting that it could pose a significant barrier for the price. Overcoming this level could result in further bullish momentum.
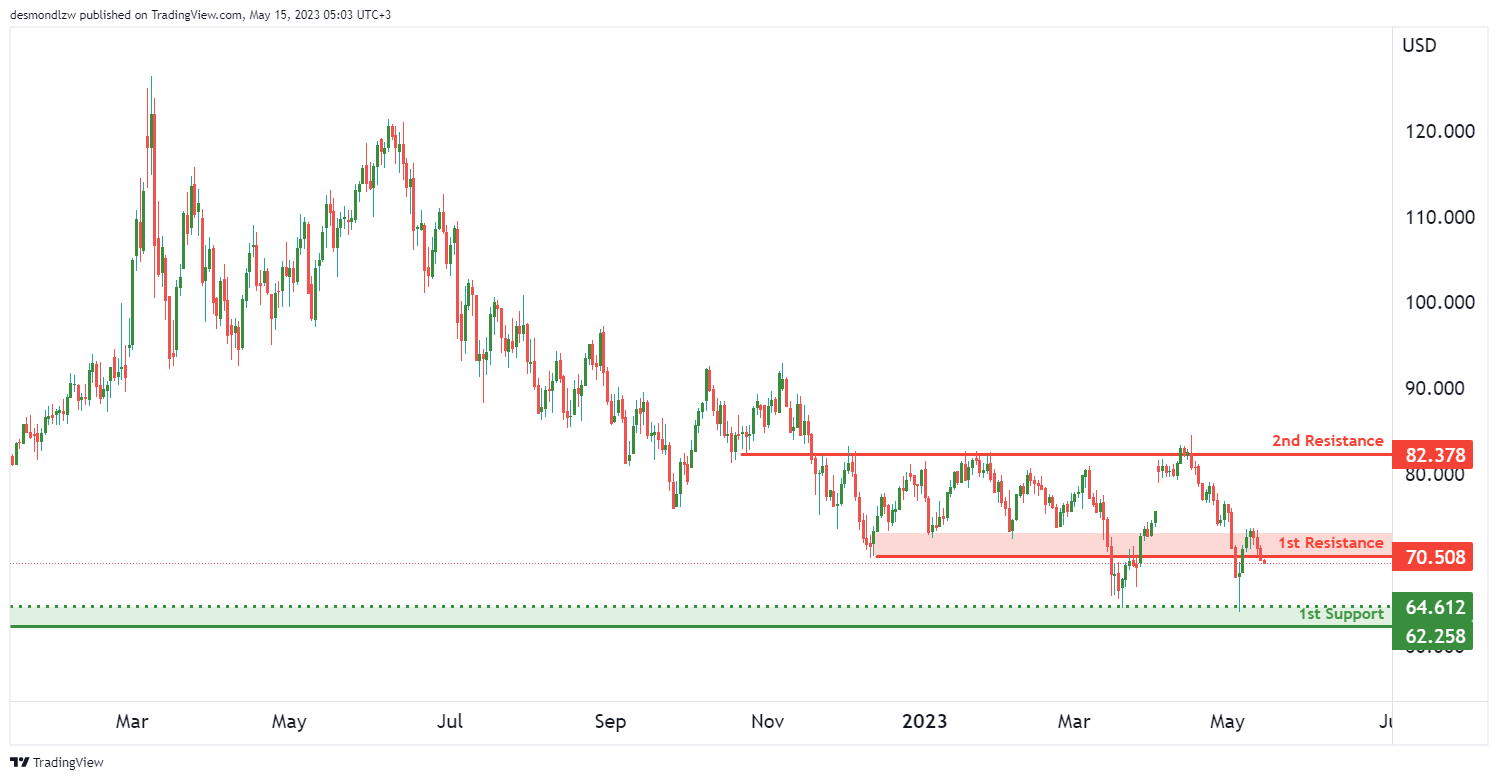
WTI/USD:
The West Texas Intermediate (WTI) chart currently presents an overall bearish momentum, hinting at a possible continuation towards the first support level.
The first support is identified at $62.25. This level has acted as a swing low support, meaning it’s a low point in the price that interrupts upward price movement. It is often considered a reliable floor, as it has withstood selling pressure in the past.
In addition, there’s an intermediate support at $64.61. This level has served as a multi-swing low support, indicating it has repeatedly held up against selling pressure, reinforcing its strength.
On the flip side, the first resistance is situated at $70.50. This has been a multi-swing high resistance, suggesting it could be a significant barrier for the price. This level has proven to hinder upward movement in the past, and it could pose a challenge for buyers again.
Beyond that, the second resistance is found at $82.37. This level is identified as an overlap resistance, indicating it has been tested multiple times as a ceiling, hence it could be a challenging point for bullish traders.
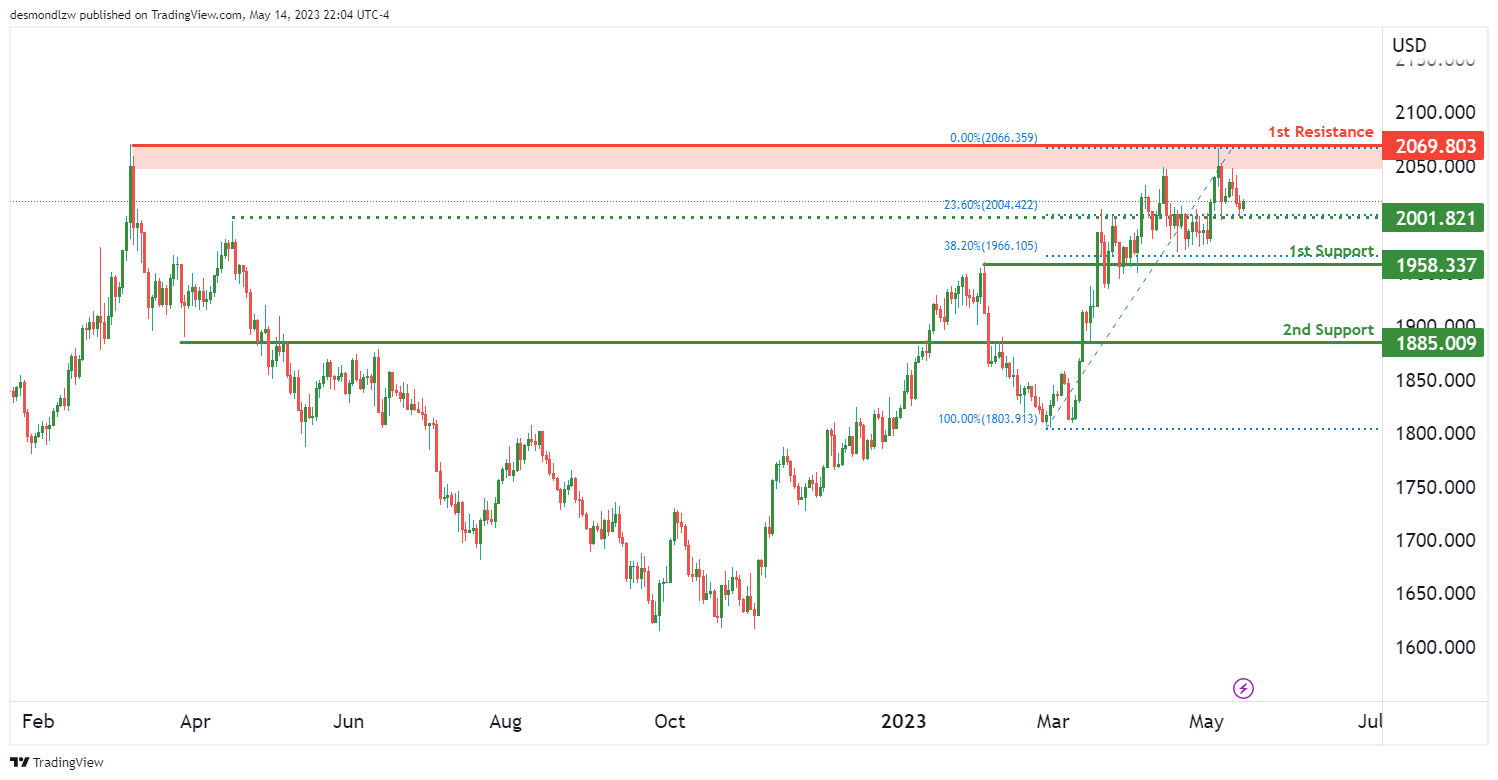
XAU/USD (GOLD):
The overall momentum of the XAU/USD (Gold) chart is bullish, suggesting a potential bullish continuation towards the first resistance level.
The first support is seen at $1958.33. This level is acting as an overlap support, suggesting it has acted as both a resistance and a support level in the past. Furthermore, it coincides with the 38.20% Fibonacci retracement, strengthening its significance.
The second support is found at $1885.00. This level is also identified as an overlap support, indicating it has held against selling pressure on multiple occasions before, thus reinforcing its strength.
On the upside, the first resistance is placed at $2069.80. This has been a multi-swing high resistance level, meaning it’s a high point that interrupts downward price movement. Given its historical significance, it may pose a challenge for buyers.
Additionally, an intermediate support is identified at $2001.82. This level serves as an overlap support, and it aligns with the 23.60% Fibonacci retracement, further validating its reliability.


