
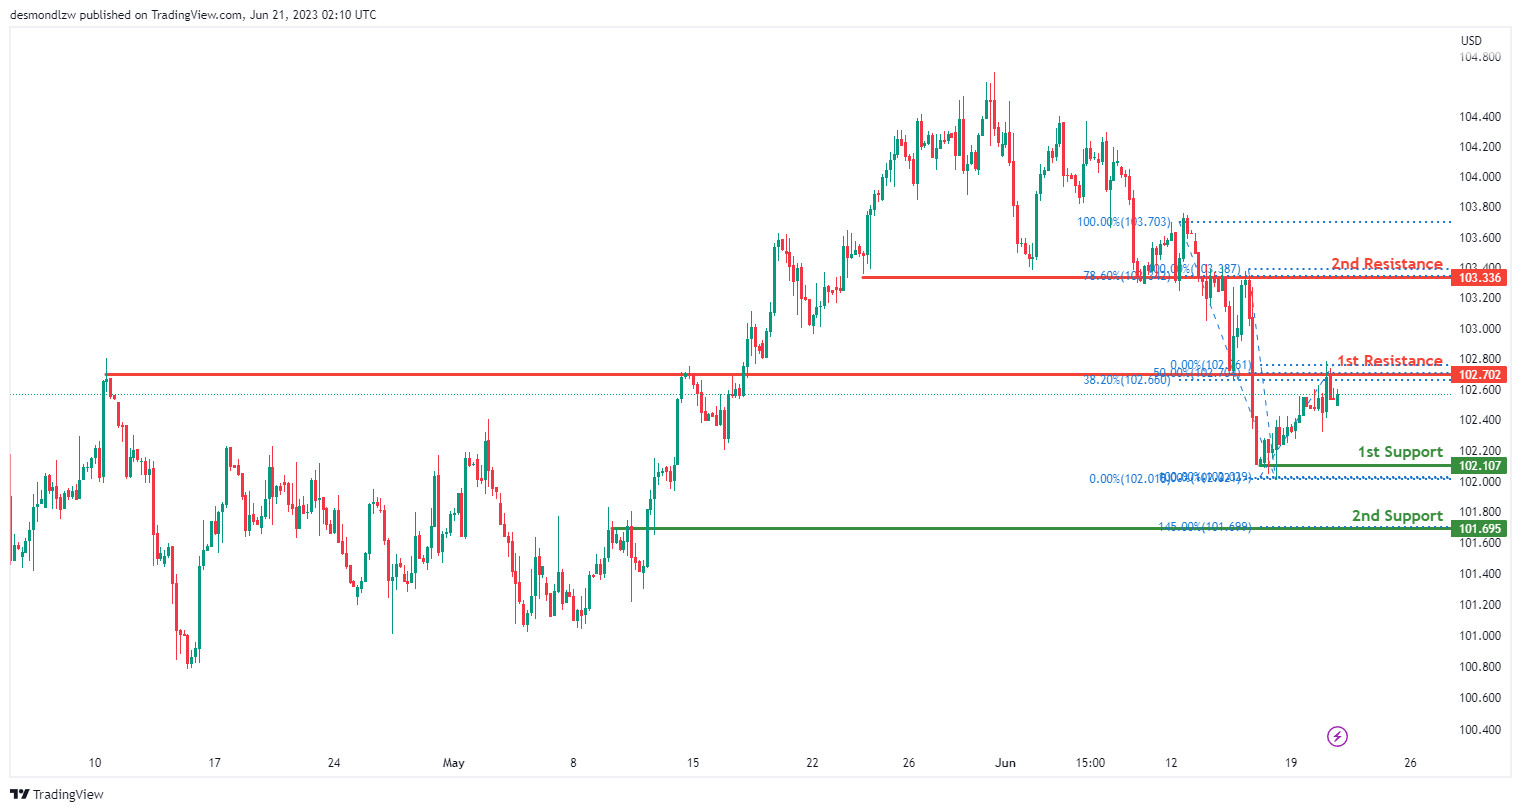
DXY:
The DXY chart indicates a bearish momentum with the potential for a bearish continuation towards the first support at 102.10, which is a multi-swing low support, and the second support at 101.69, serving as an overlap support and aligning with the 145.00% Fibonacci Extension.
On the upside, the first resistance at 102.70 represents an overlap resistance, coinciding with the 38.20% and 50% Fibonacci Retracement levels, while the second resistance at 1980.08 is also an overlap resistance, aligning with the 78.60% Fibonacci Retracement.
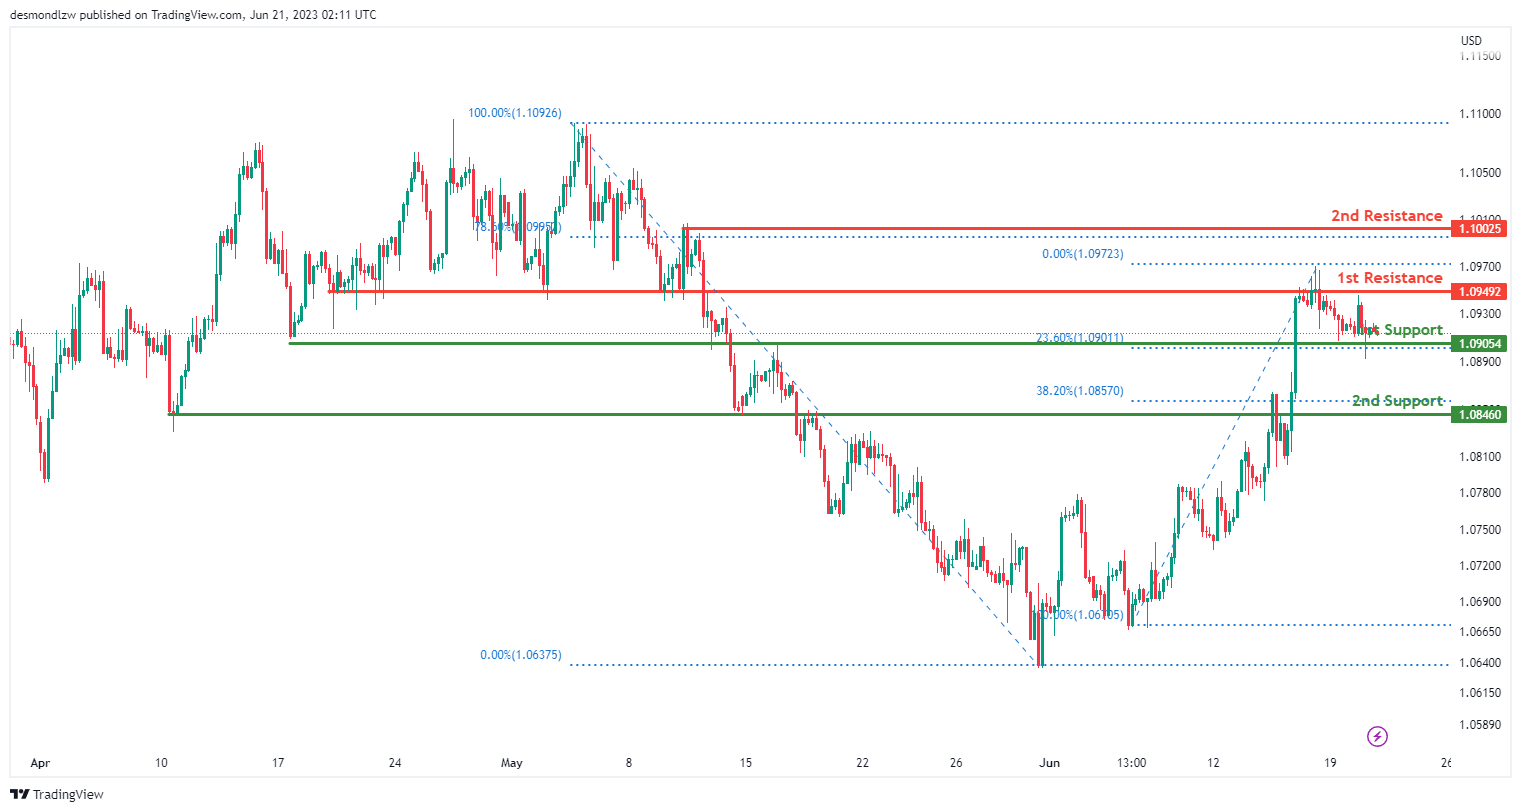
EUR/USD:
The EUR/USD chart currently exhibits a neutral momentum, suggesting a lack of clear directional bias in the market.
There is a potential for price to fluctuate between the first support level at 1.0905, which is an overlap support and coincides with the 23.60% Fibonacci Retracement, and the second support level at 1.0846, serving as a pullback support and aligning with the 38.20% Fibonacci Retracement.
On the upside, the first resistance at 1.0949 represents an overlap resistance, while the second resistance at 1.1000 acts as a swing high resistance, aligning with the 78.60% Fibonacci Retracement.
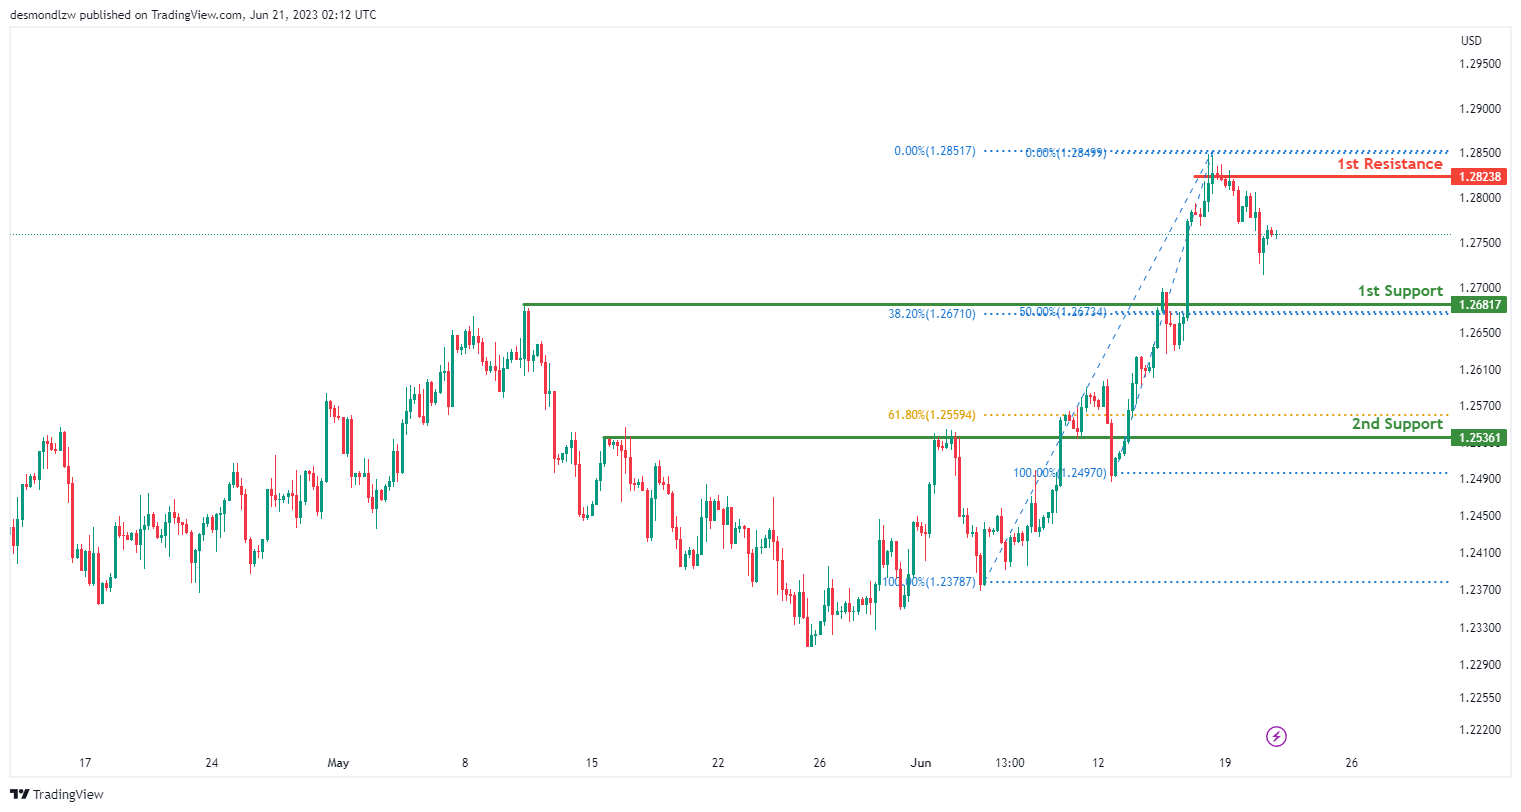
GBP/USD:
The GBP/USD chart currently demonstrates a bearish momentum, indicating a downward trend in the market.
There is a potential for a bearish continuation towards the first support level at 1.2681, which serves as a pullback support and aligns with both the 38.20% and 50% Fibonacci Retracement levels.
Additionally, the second support level at 1.2536 acts as a pullback support and aligns with the 61.80% Fibonacci Retracement.
On the upside, the first resistance at 1.2823 represents a swing high resistance.
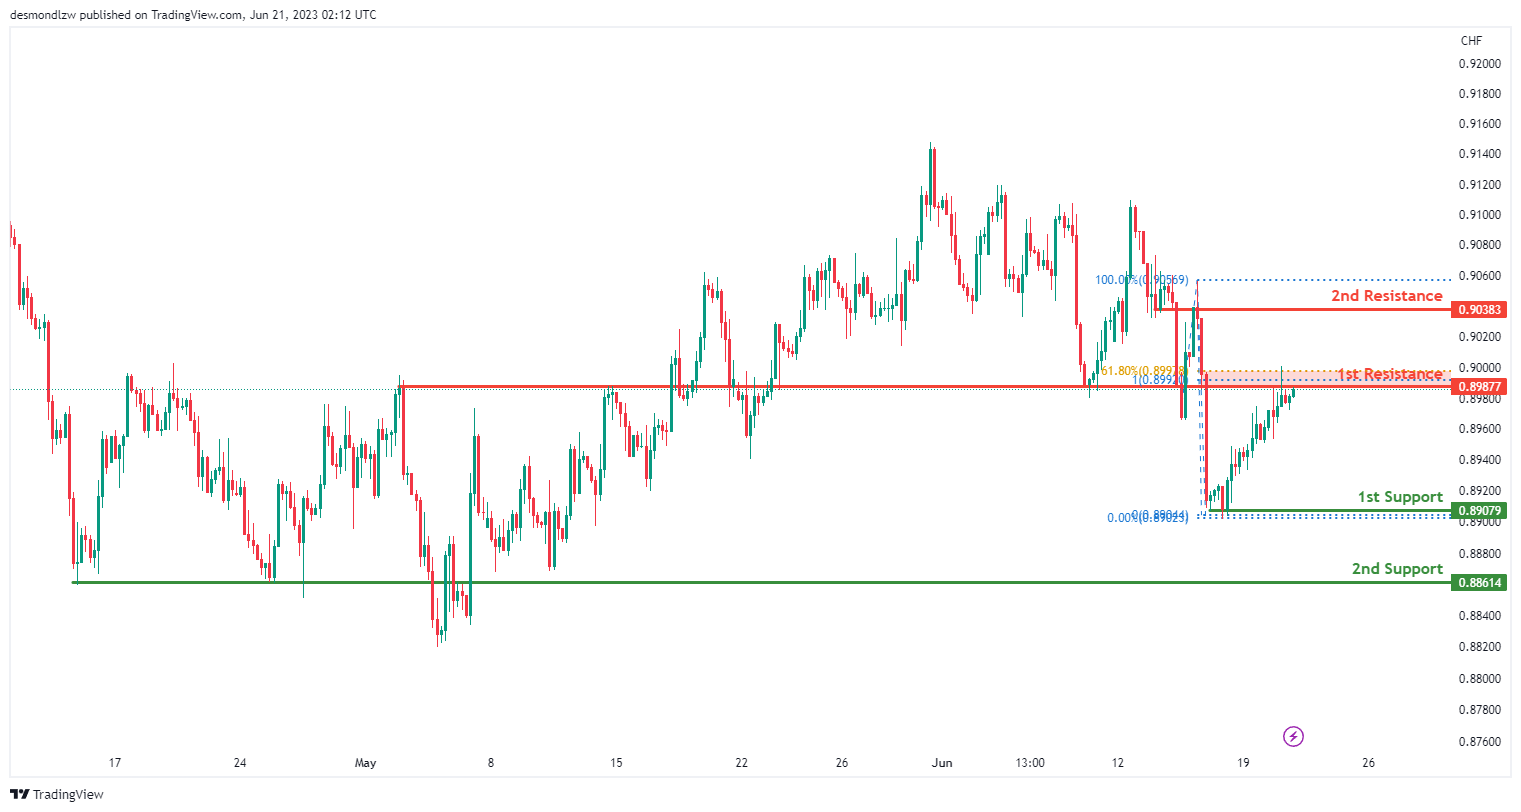
USD/CHF:
The USD/CHF chart currently exhibits a bearish momentum, indicating a downward trend in the market.
There is a potential for a bearish reaction off the first resistance level at 0.8987, which is an overlap resistance and aligns with both the 61.80% Fibonacci Retracement and 100% Fibonacci Projection.
On the downside, the first support level at 0.8907 represents a swing low support, while the second support level at 0.8861 acts as a pullback support.
Additionally, the second resistance level at 0.9038 functions as a pullback resistance.
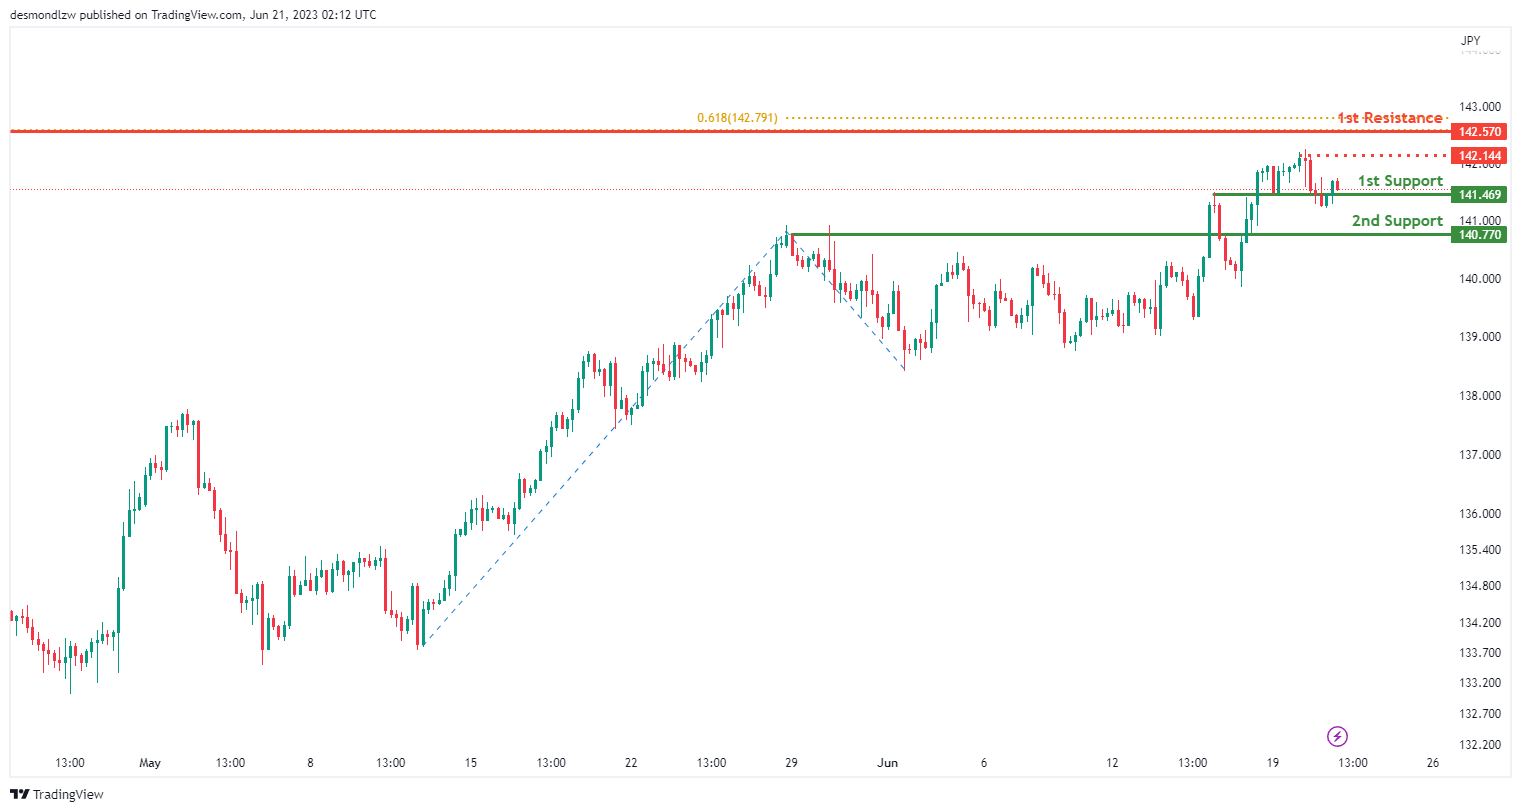
USD/JPY:
The USD/JPY chart demonstrates a bearish momentum, indicating a downward trend in the market.
There is a possibility of a short-term rise towards the first resistance level at 142.57, followed by a reversal and a drop towards the first support level at 141.46.
The first support at 141.46 is considered significant as it represents an overlap support, while the second support at 140.77 acts as a pullback support.
On the upside, the first resistance level at 142.57 is notable, coinciding with the 61.80% Fibonacci Retracement level. Additionally, the intermediate resistance at 142.20 functions as a swing high resistance.
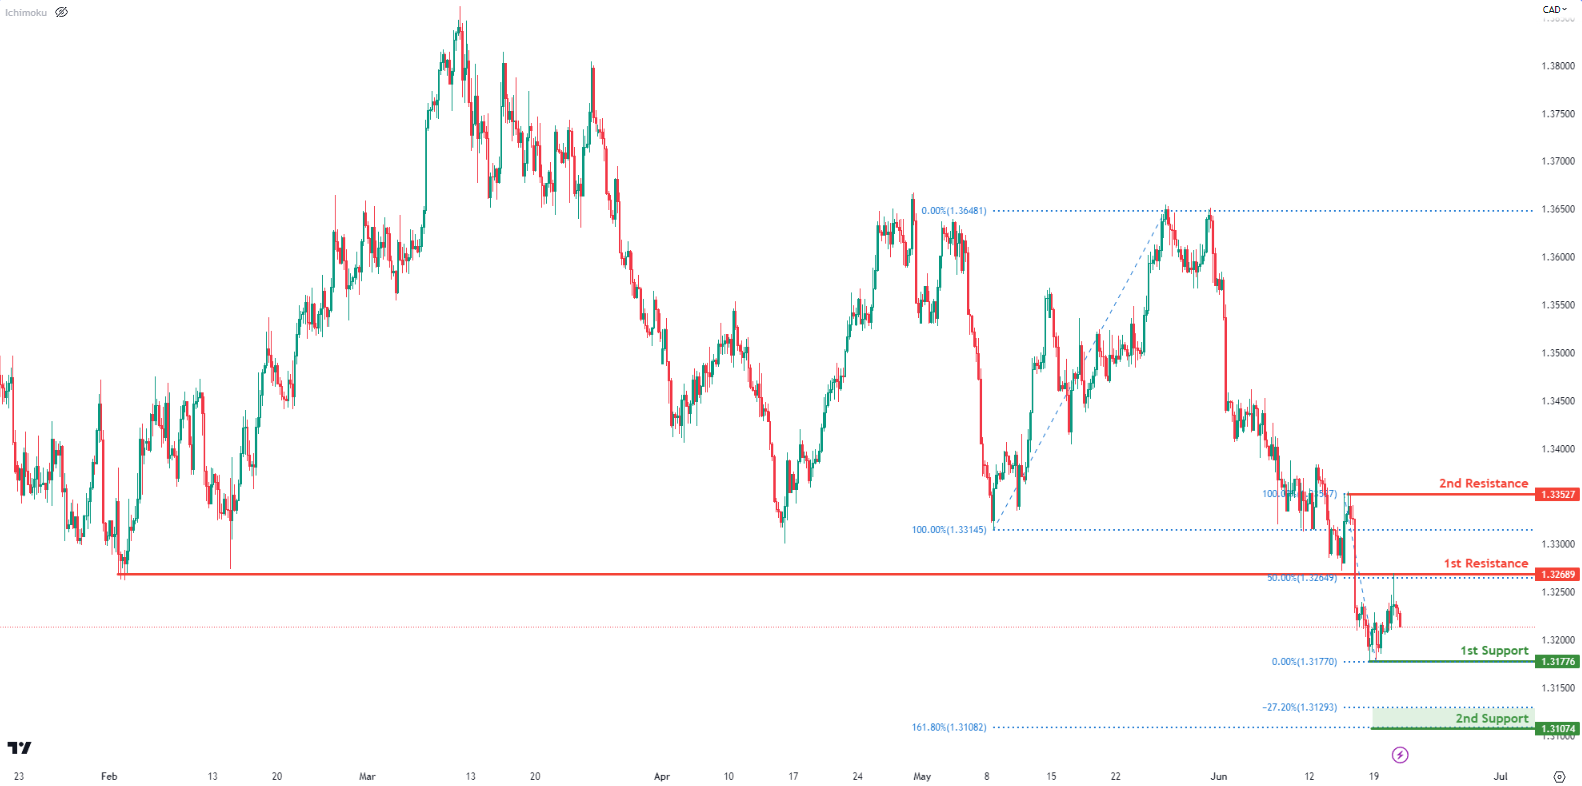
USD/CAD:
Price has reversed strongly from our 1st resistance at 1.3268 which is a major pullback resistance and also a short term 50% Fibonacci retracement. A reversal from this level could see prices drop down to test the 1st support level at 1.3177 which is a recent swing low support.
Breaking the 1st support level could see prices drop to the 2nd support level at 1.3107 which is a -27.2% Fibonacci expansion and a larger 161.8% Fibonacci extension.
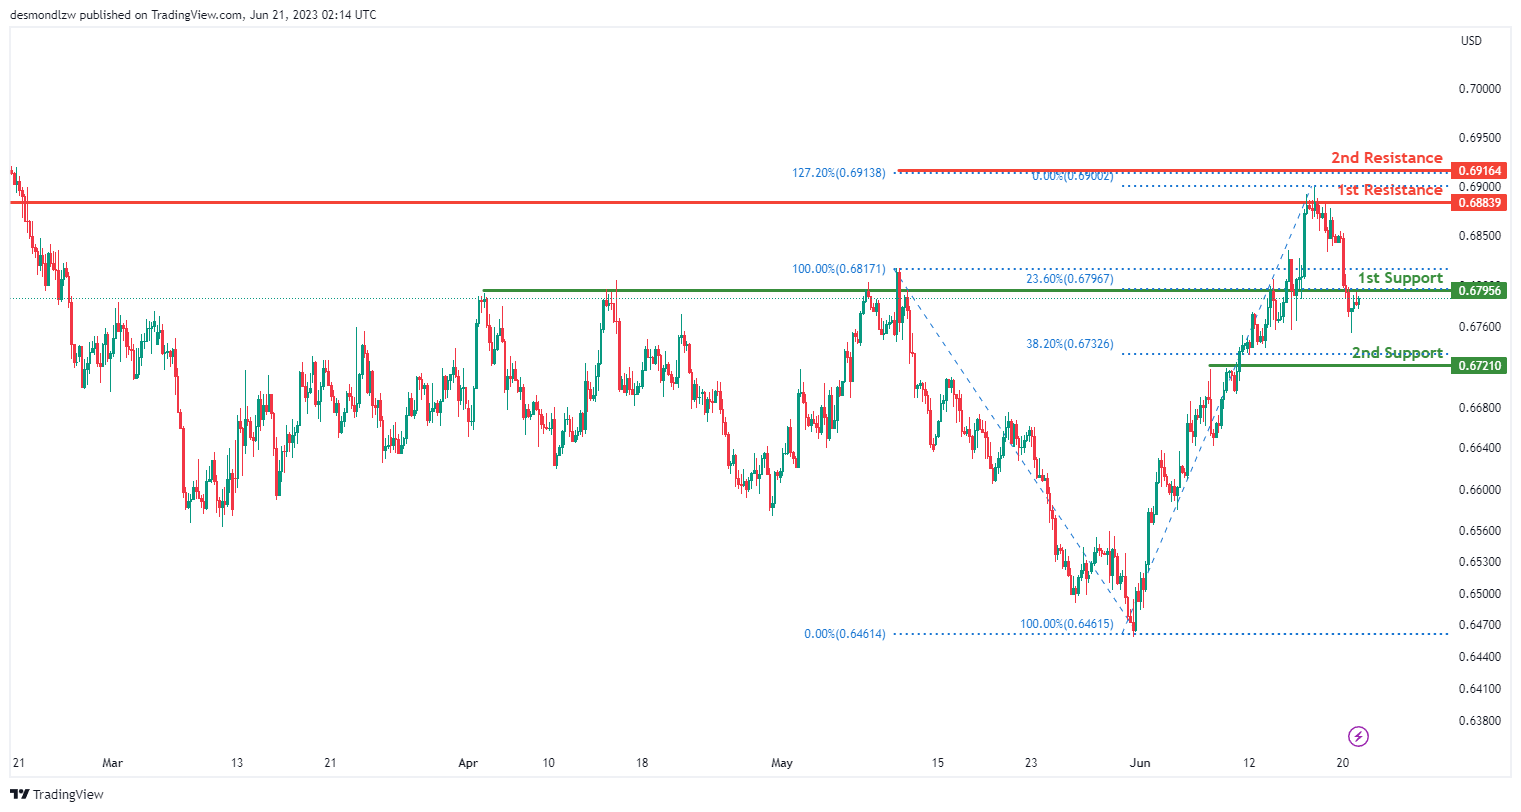
AUD/USD:
The AUD/USD chart demonstrates a bearish momentum, indicating a downward trend in the market.
There is a potential for a bearish break off the first support level at 0.6795, which is identified as a pullback support and aligns with the 23.60% Fibonacci Retracement. This could lead to a drop towards the second support level at 0.6721, which serves as another pullback support and coincides with the 38.20% Fibonacci Retracement.
On the upside, the first resistance level at 0.6883 represents a significant swing high resistance. Additionally, the second resistance level at 0.6916 is identified as a Fibonacci Extension level, further contributing to its significance.
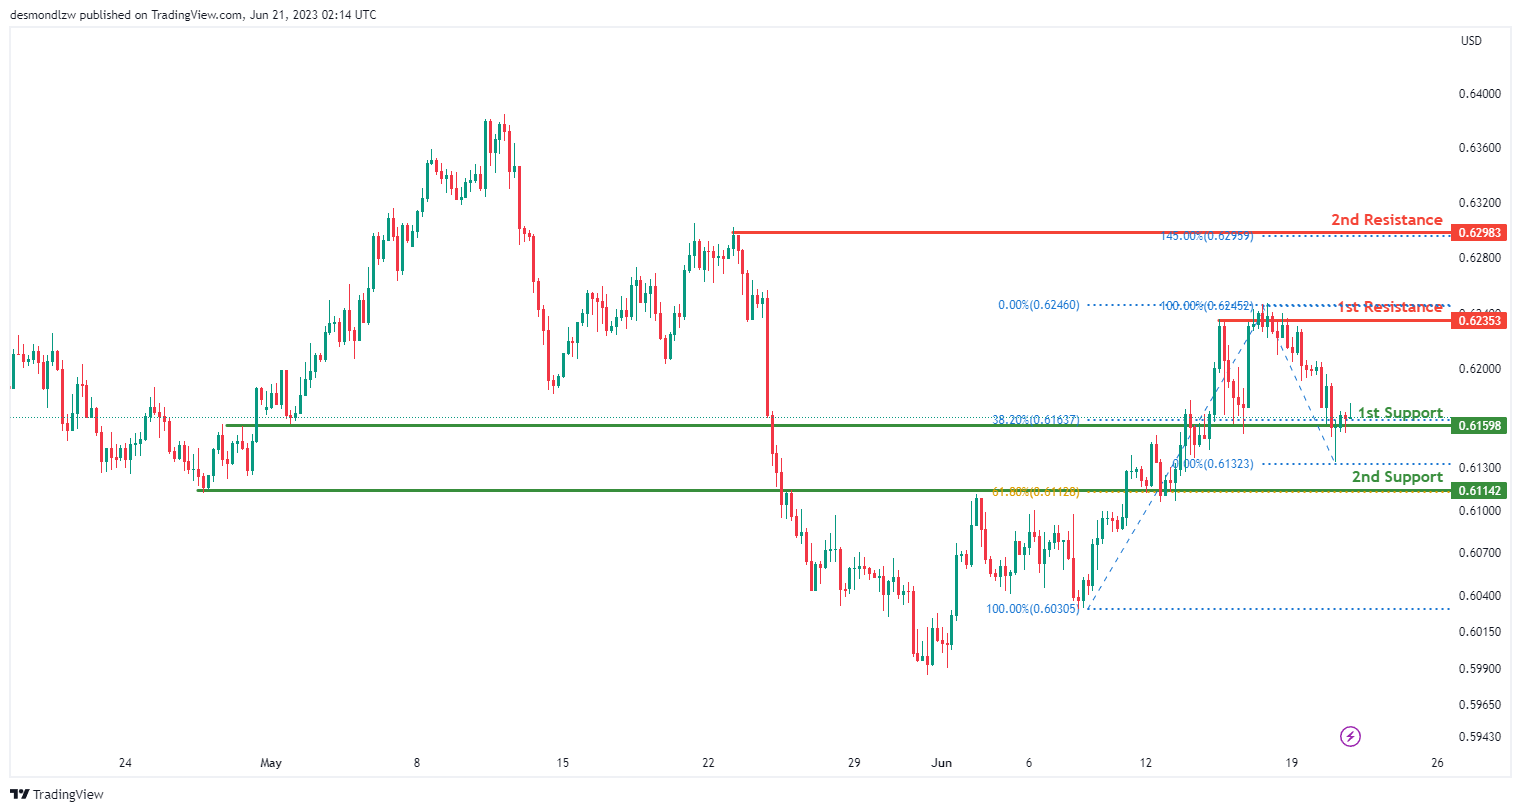
NZD/USD
The NZD/USD chart indicates a weak bullish momentum, suggesting a bullish bounce off the first support level and move towards the first resistance level.
The 1st support sits at 0.6160 which is an overlap support and aligns with the 38.2% Fibonacci retracement level while the 2nd support lies at 0.6114 which is an overlap support taht aligns witht he 61.8% Fibonacci retracement level.
On the upside, the first resistance level at 0.6235 represents a multi-swing high resistance, while the second resistance level at 0.6306 acts as a swing high resistance.
Furthermore, the 2nd resistance sits at 0.6298 which is an overlap resistance that aligns wit the 145.00 Fibonacci extension level.
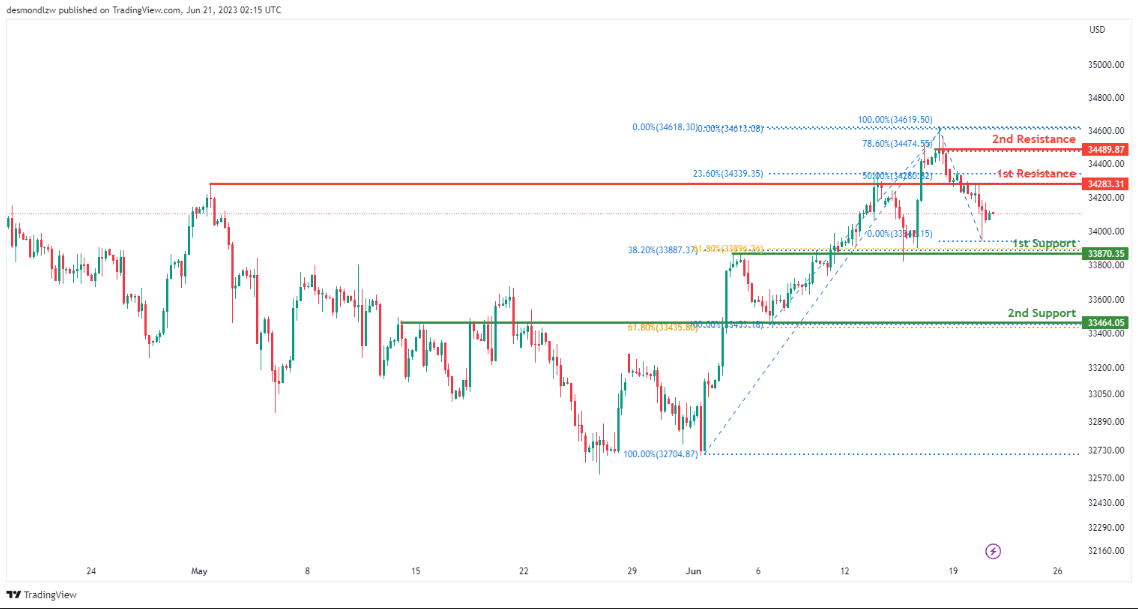
DJ30:
Price is currently approaching a major support at 33870 which is a 38.2% Fibonacci retracement and also an overlap support. It is worth noting that price is seeing higher lows suggesting that we’re still in a bullish trend.
A bounce from here could see prices rise up to test the 34783 level which is a big overlap resistance.
Breaking the 1st support could trigger another move down to the 2nd support at 33464 which is a 61.8% Fibonacci retracement.
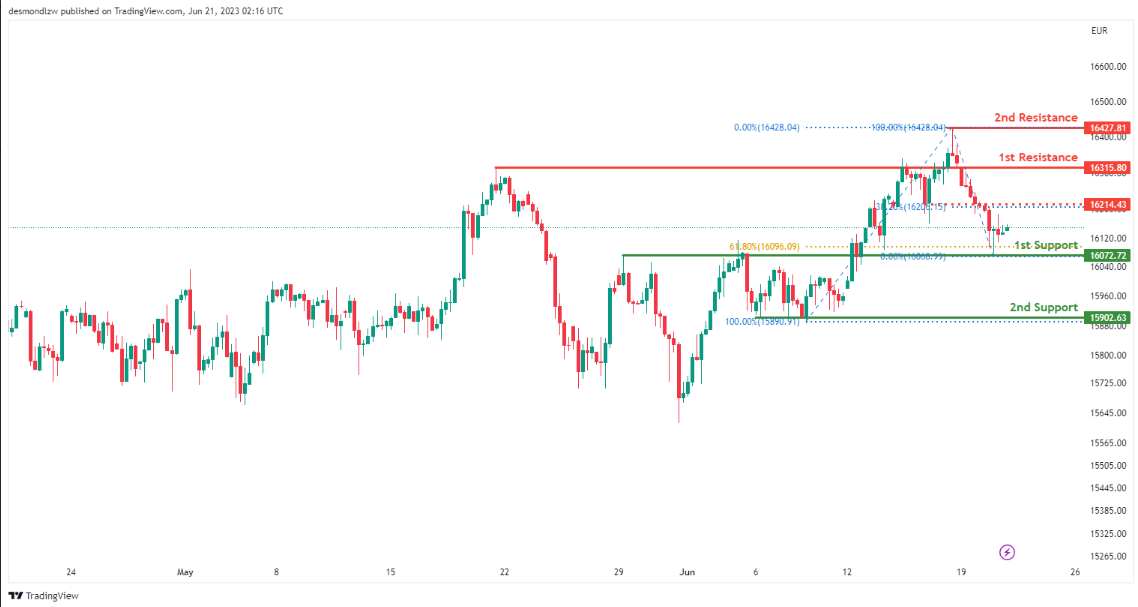
GER30:
Price is currently testing a key overlap support at 16072 which also happens to be a short term 61.8% Fibonacci retracement. If price were to bounce from here, we could see it first test the intermediate resistance at 16234 which is a short-term pullback resistance. Breaking that level could accelerate it up towards 1st resistance at 16315 which is an overlap resistance.
The 2nd support level is down at 15902 which is a recent significant swing low support – this would be the level to watch out for if price were to break the 1st support level.
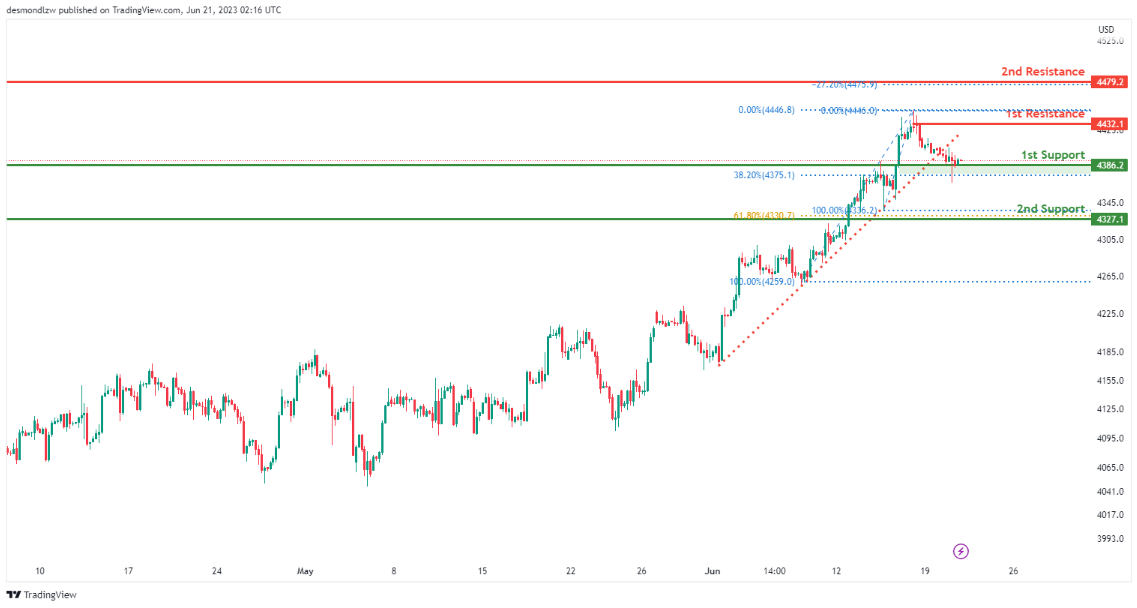
US500
Price is currently testing the 1st support level at 4386 which is a major pullback support level. It is worth noting that price has already broken a short term ascending trend line which suggest we might be seeing a bearish breakout towards the 2nd support level. However, the key level to watch out for to trigger that move would be the 1st support level – which also coincides with the 38.2% Fibonacci retracement.
The 2nd support is down at 4327 which is a 61.8% Fibonacci retracement while the 1st resistance we’re looking at is the recent swing high resistance at 4432.
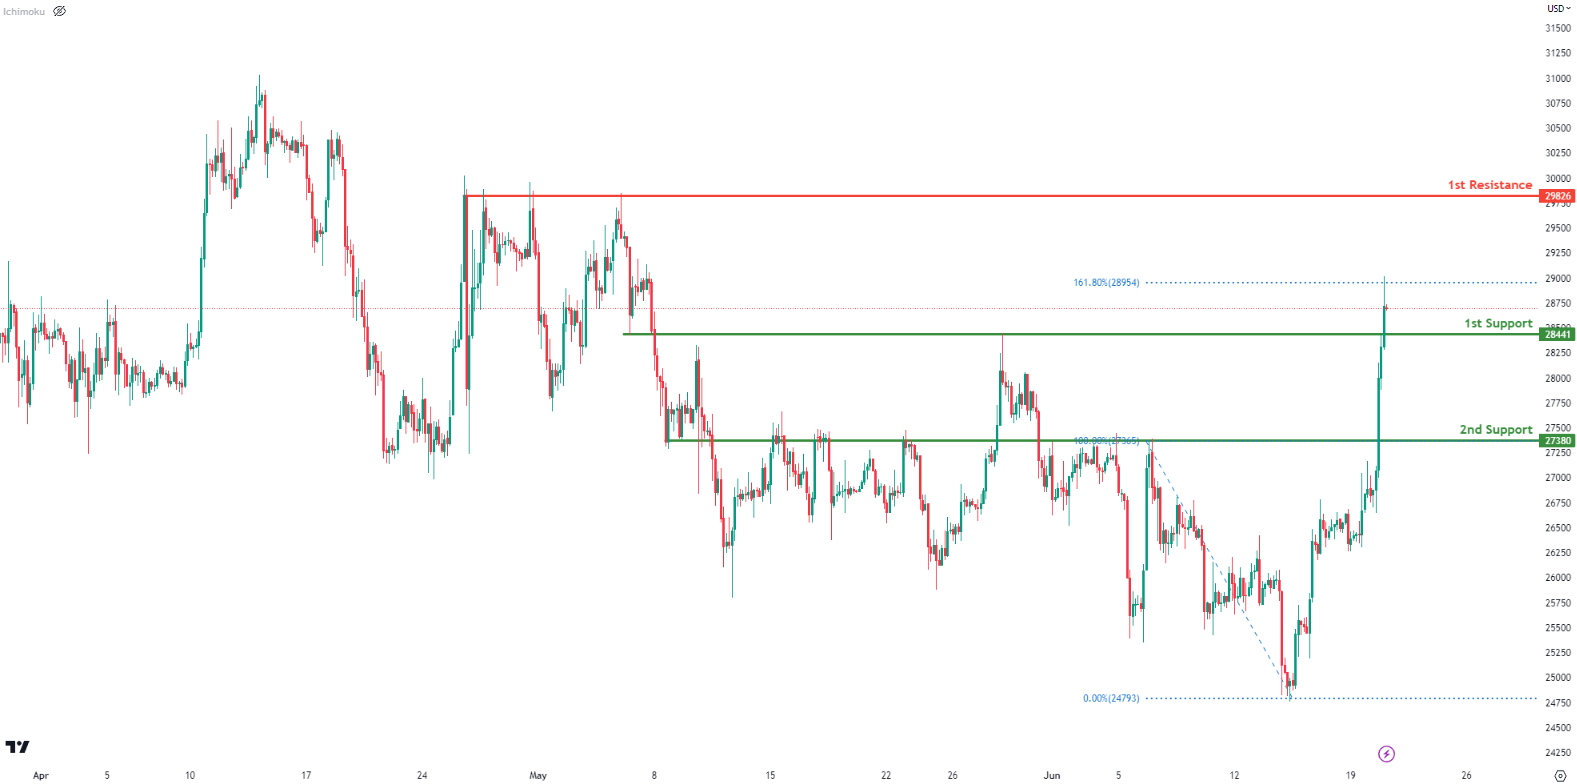
BTC/USD:
Price has broken a key resistance-turned-support at 28441 which is now a pullback support. We could potentially see prices accelerate up towards the 1st resistance at 29826 which is a multi-swing high resistance level.
It’s worth noting that price is currently testing the 161.8% fibonacci extension which is at 28954 – this could see prices reverse towards the 28441 level first before a potential bounce.
If price were to break the 1st support, we could see a bigger drop towards the 27380 level which is a key overlap support level.
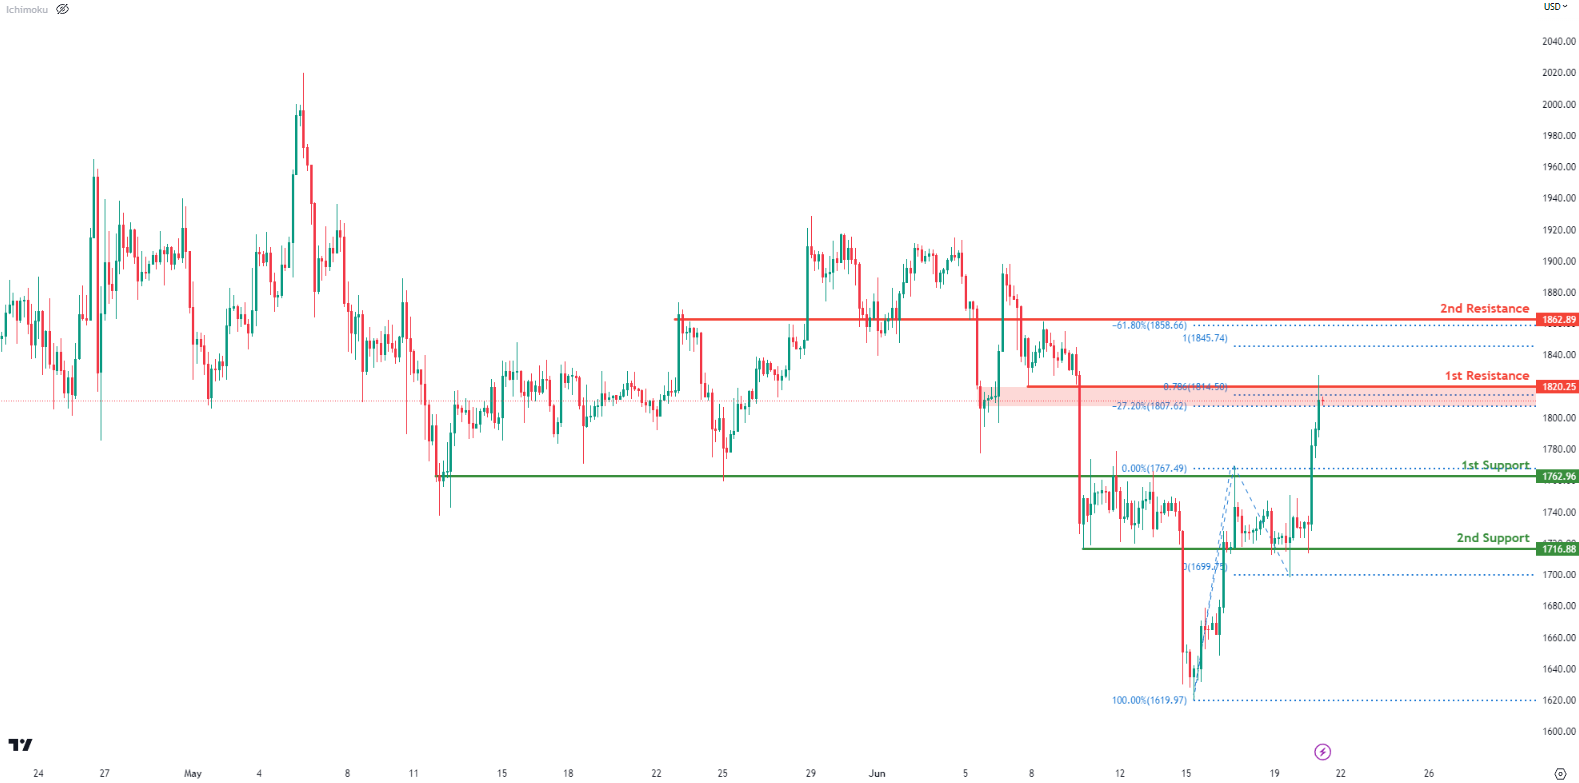
ETH/USD:
Price is currently testing a major resistance level at 1820 which is a -27% Fibonacci expansion and 78.6% Fibonacci projection. It also happens to be a pullback resistance. We could see a reversal from here to take prices back down to 1st support at 1762 which is an overlap support level.
If price were to break the 1st resistance, the next resistance we are looking at is up at 1862 which is an overlap resistance and a -61.8% Fibonacci expansion.
However, if prices were to reverse and break the 1st support, the next key support level to watch out for is 2nd support down at 1716 which is also an overlap support level.
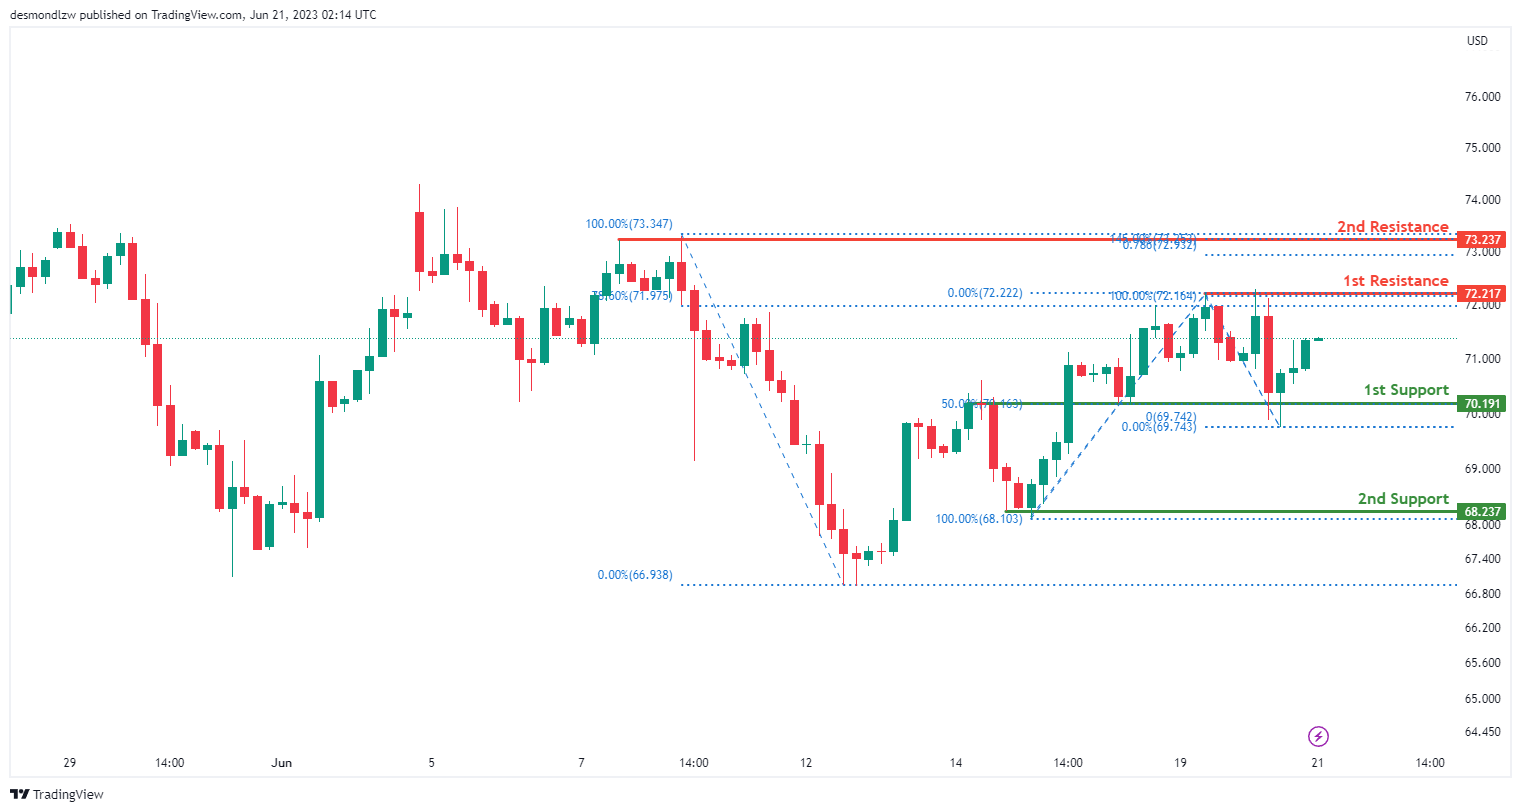
WTI/USD:
The WTI chart currently indicates a bullish momentum, suggesting an upward trend in the market.
There is a potential for price to continue its bullish movement towards the 1st resistance level at 72.22 which is an overlap resistance level and coincides with the 78.6% Fibonacci retracement. The 2nd resistance level sits at 73.24 which is an overlap resistance.
On the support side, the 1st support level sits at 70.19 which is verlap support level and coincides with the 50% Fibonacci retracement. Additional support can be found at the second support level of 68.24, which acts as a swing-low support.
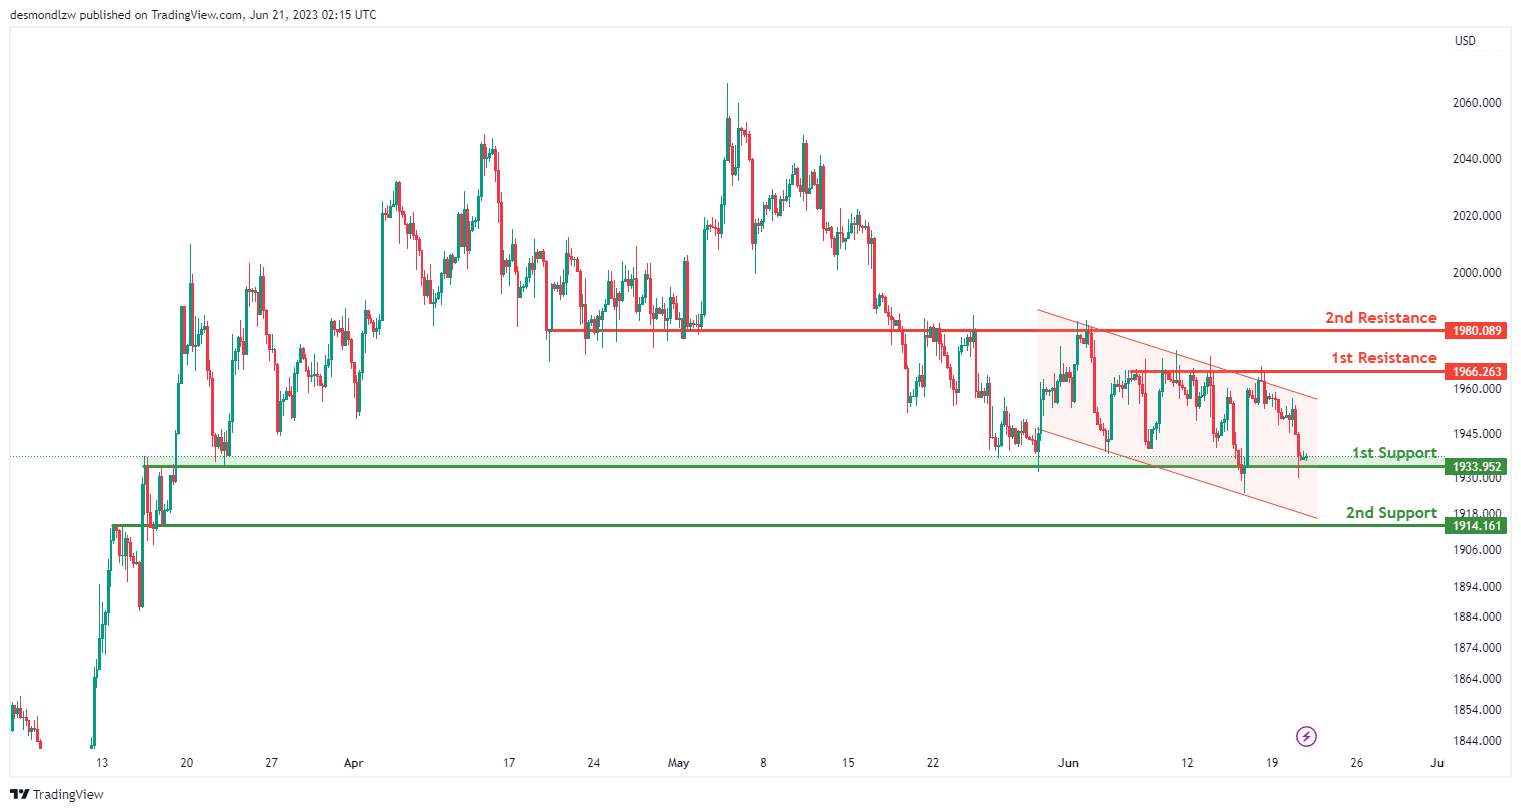
XAU/USD (GOLD):
The XAU/USD chart currently exhibits a bearish momentum, indicating a downward trend in the market. This is supported by the price being in a bearish descending channel.
There is a possibility of a bearish continuation towards the first support level at 1933.95, which is identified as an overlap support. Additionally, the second support level at 1914.16 acts as another overlap support.
On the upside, the first resistance level at 1966.26 represents a multi-swing high resistance. Furthermore, the second resistance level at 1980.08 is identified as an overlap resistance.


