
DXY:
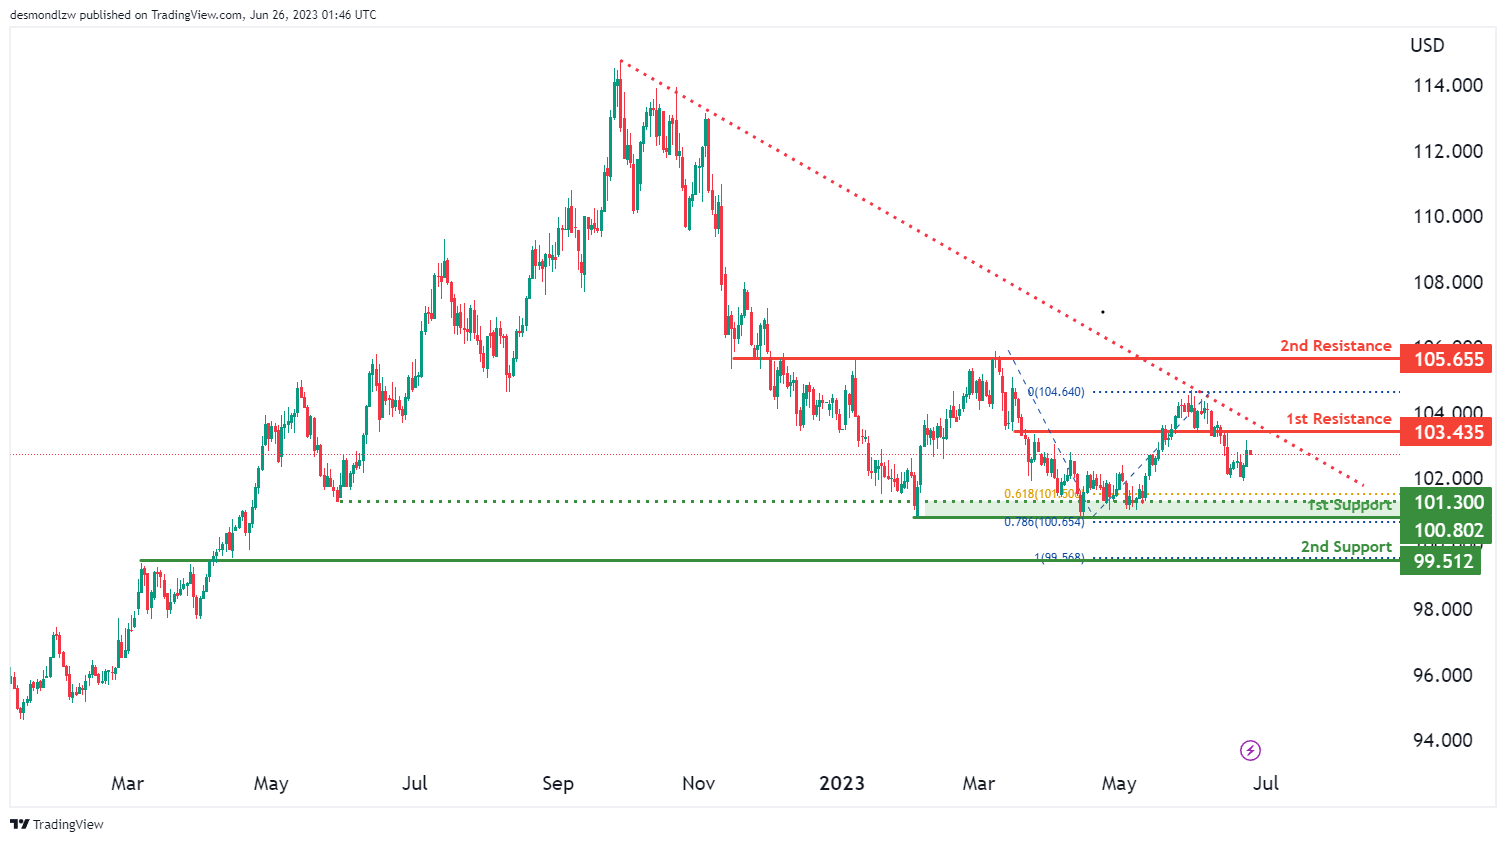
The DXY (US Dollar Index) chart demonstrates a bearish momentum, indicated by the price being below a major descending trend line, suggesting the potential for continued downward movement.
The price has the potential to experience a bearish reaction off the 1st resistance level at 103.43, which is an overlap resistance. This level may trigger a bearish response, leading to a drop towards the 1st support level at 100.80.
The 1st support at 100.80 is significant as it represents a multi-swing low support and is reinforced by the 78.60% Fibonacci Projection. Additionally, the 2nd support at 99.51 acts as an overlap support, further strengthening the support zone.
Conversely, the 1st resistance at 103.43 is an overlap resistance that could hinder upward movement. Similarly, the 2nd resistance at 105.65 serves as another overlap resistance, further emphasizing its importance in restricting further upward price movement.
Additionally, there is an intermediate support level at 101.30, which adds to the potential support for the price.
EUR/USD:
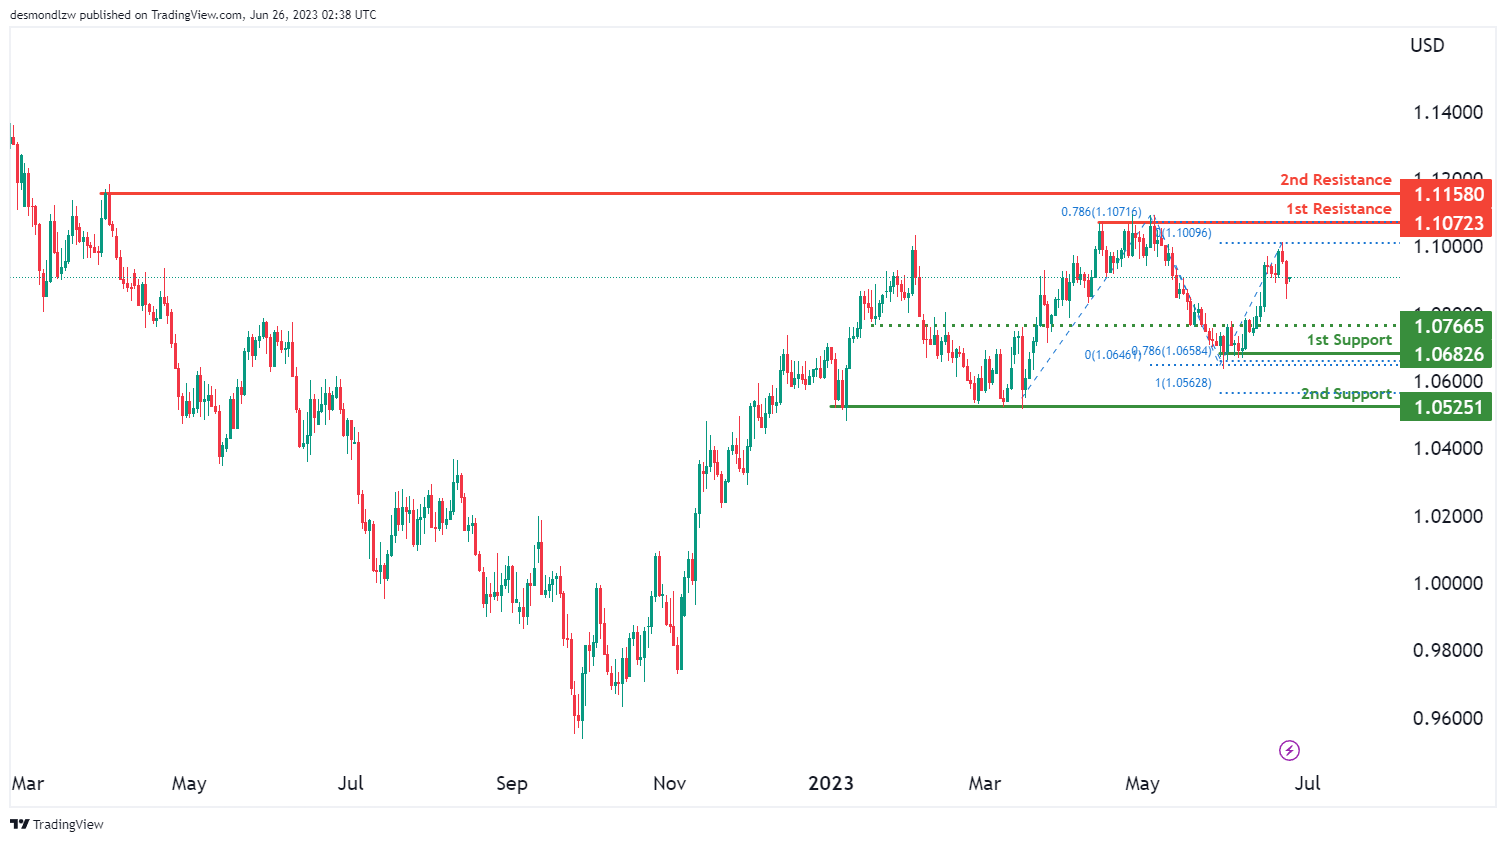
The overall momentum of the EUR/USD chart is currently neutral, indicating a lack of clear direction in the market.
There is a potential for price to fluctuate between the 1st support level at 1.0682, which is characterized as a multi-swing low support and reinforced by the presence of the 78.60% Fibonacci Projection, and the 1st resistance level at 1.1072, representing a multi-swing high resistance and coinciding with the 78.60% Fibonacci Retracement.
Additionally, the 2nd support level at 1.0525 acts as another multi-swing low support, providing further significance to the support zone. On the upside, the 2nd resistance level at 1.1158 acts as a swing high resistance, potentially impeding upward price movement.
Furthermore, an intermediate support level at 1.0766 is recognized as a pullback support, contributing to the overall support structure.
GBP/USD:
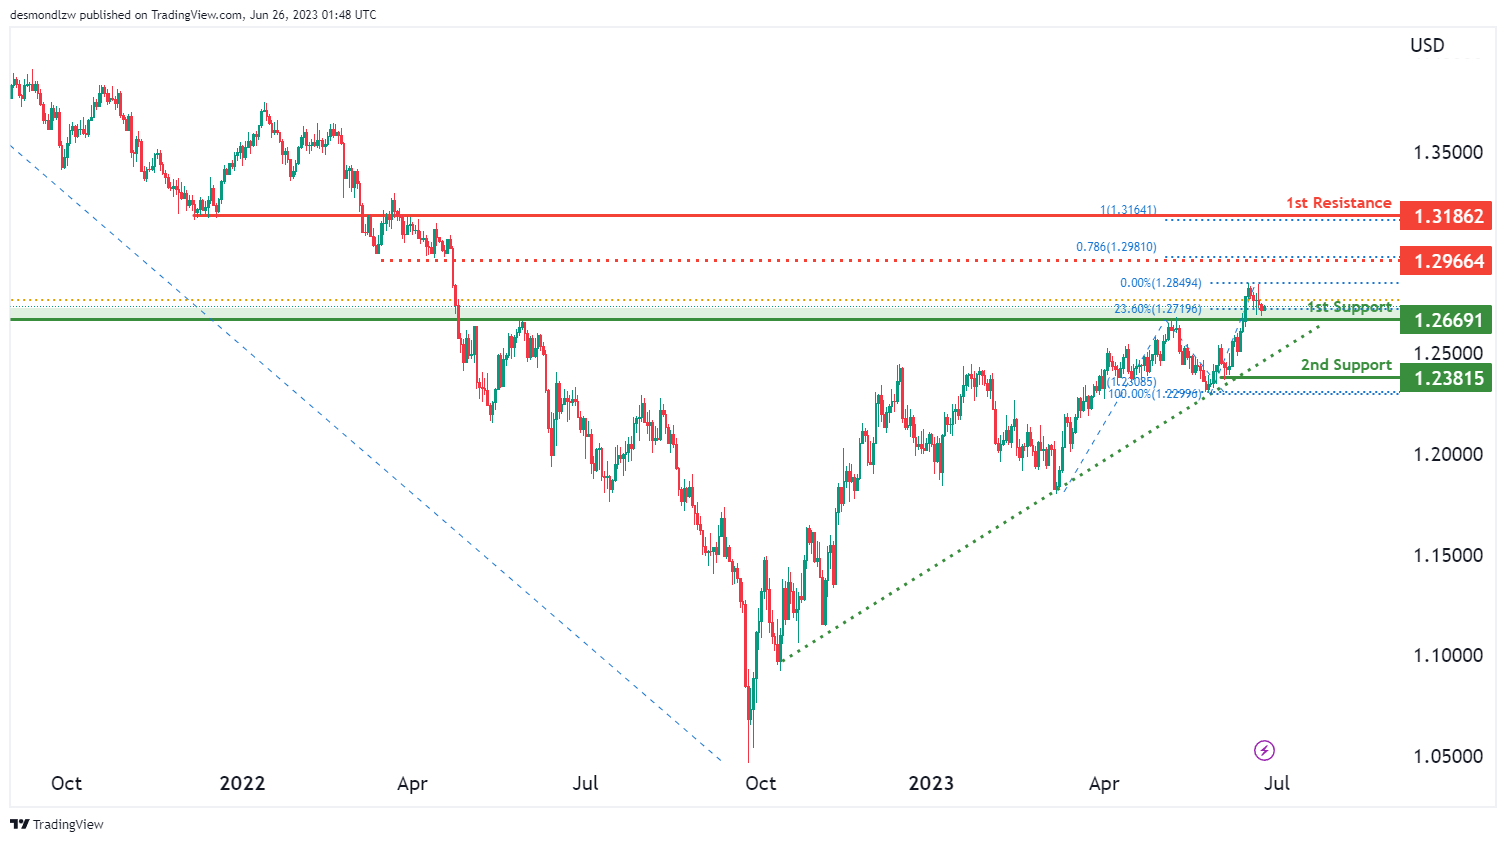
The GBP/USD chart exhibits a bullish momentum, supported by the fact that the price is positioned above a major ascending trend line, indicating potential for further upward movement.
There is a possibility of a bullish bounce off the 1st support level at 1.2669, which is considered a pullback support and further reinforced by the presence of the 23.60% Fibonacci Retracement. Another support level, the 2nd support at 1.2381, acts as a swing low support, providing additional strength to the support zone.
On the upside, the 1st resistance level at 1.3186 represents an overlap resistance, potentially impeding further upward price advancement. Additionally, there is an intermediate resistance level at 1.2966, acting as a pullback resistance and coinciding with the 78.60% Fibonacci Projection.
USD/CHF:
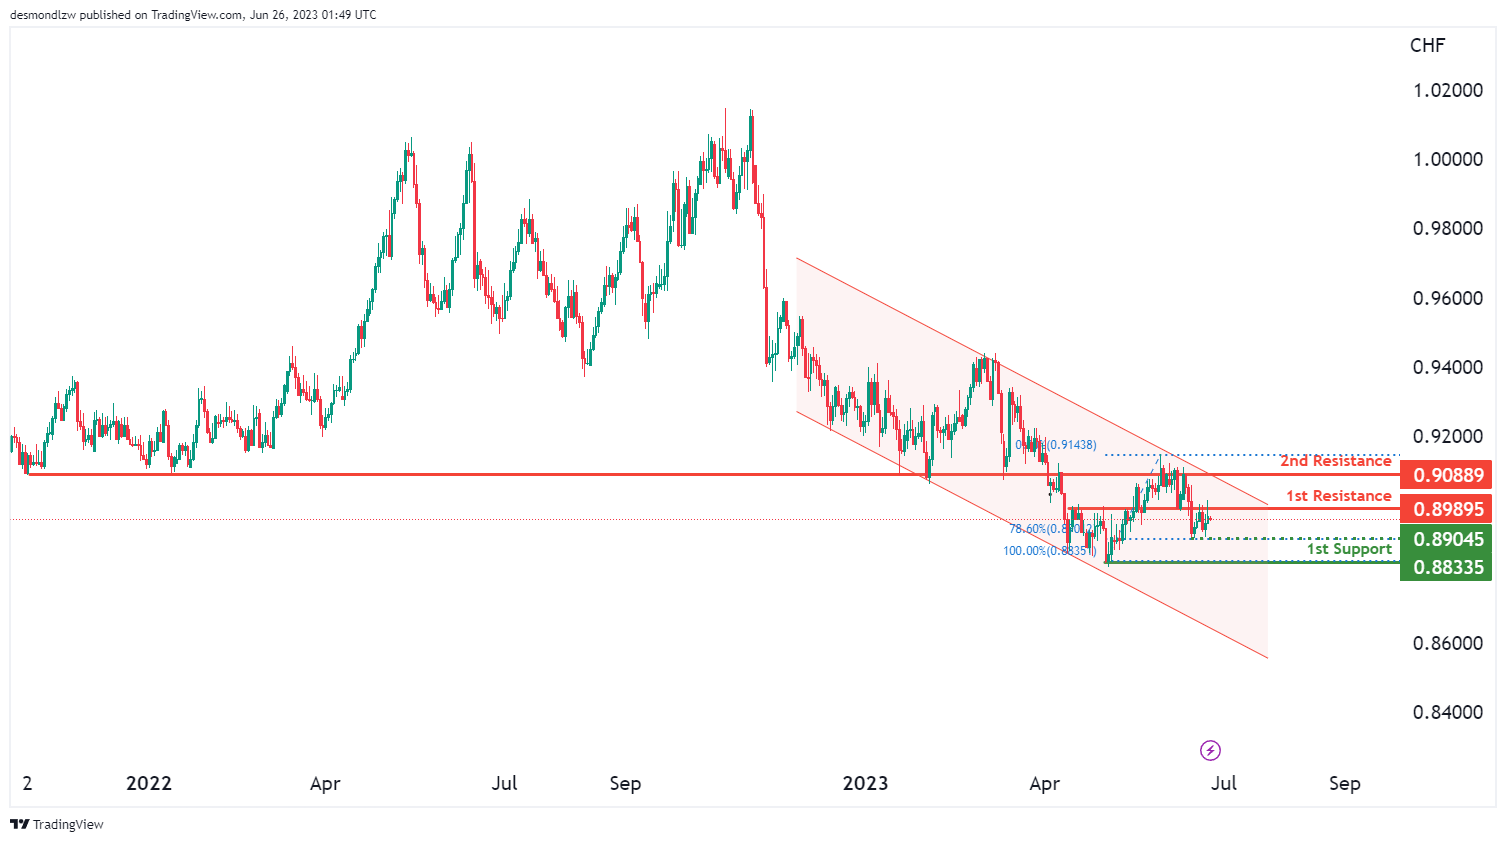
The USD/CHF chart demonstrates a bearish momentum, supported by the fact that the price is within a bearish descending channel, suggesting a potential for further downward movement.
There is a possibility of a bearish continuation towards the 1st support level at 0.8833, which acts as a swing low support. Additionally, there is an intermediate support level at 0.8904, reinforcing the support zone and coinciding with the 78.60% Fibonacci Retracement.
On the upside, the 1st resistance level at 0.8989 represents an overlap resistance, potentially impeding upward price movement. Another resistance level, the 2nd resistance at 0.9088, also acts as an overlap resistance, further strengthening its significance.
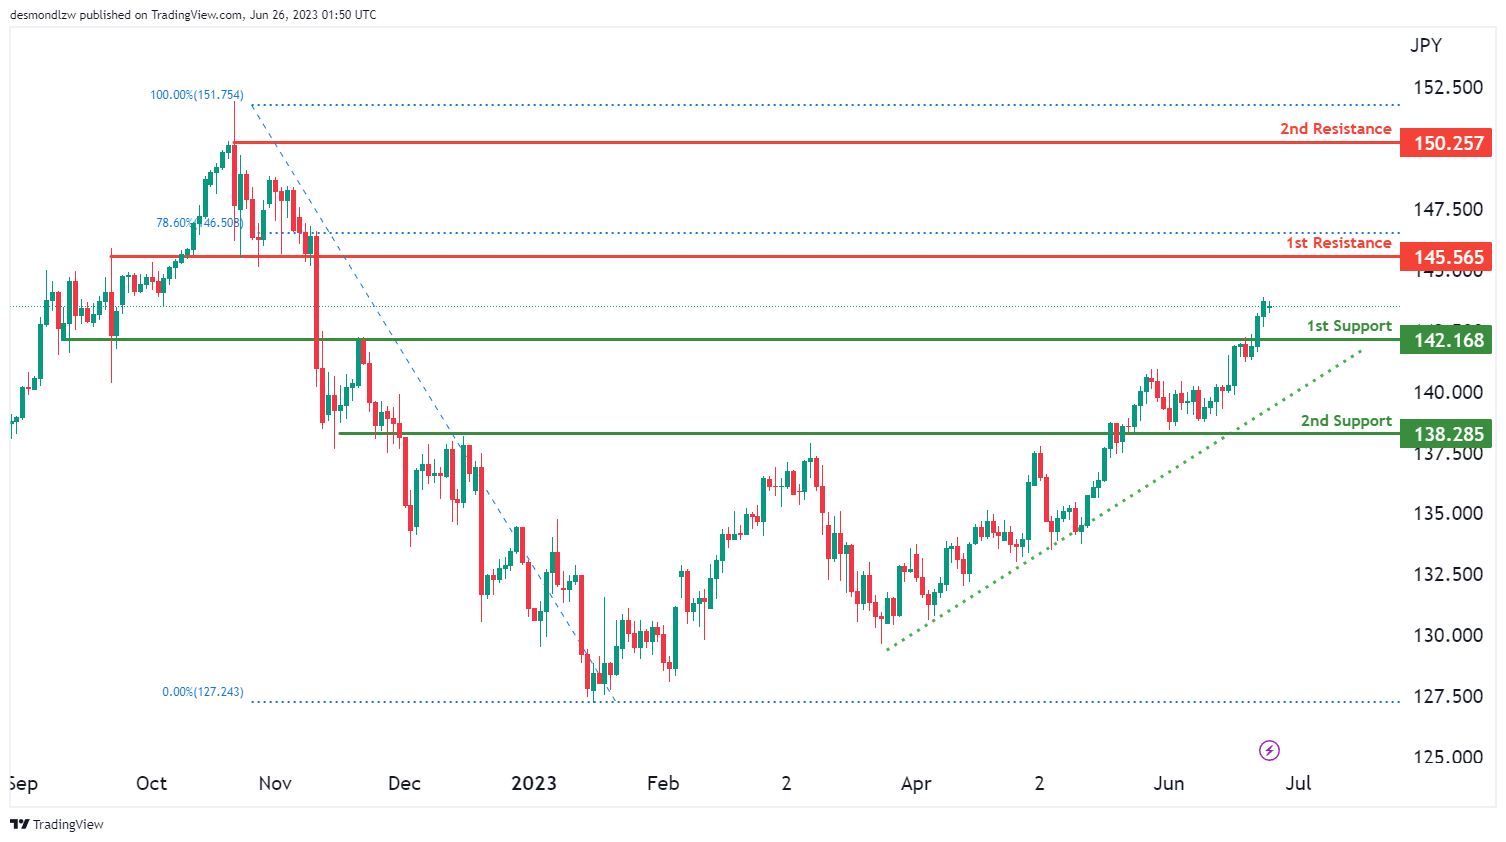
USD/JPY:
The USD/JPY chart exhibits a bullish momentum, supported by the fact that the price is above a major ascending trend line, indicating a potential for further upward movement.
There is a possibility of a bullish continuation towards the 1st resistance level at 145.56, which serves as a pullback resistance. Additionally, the 2nd support level at 150.25 acts as a swing high resistance, further reinforcing its significance.
On the downside, the 1st support level at 142.16 represents a pullback support, providing potential strength to the support zone. Another support level, the 2nd support at 138.28, acts as an overlap support, further confirming its importance.
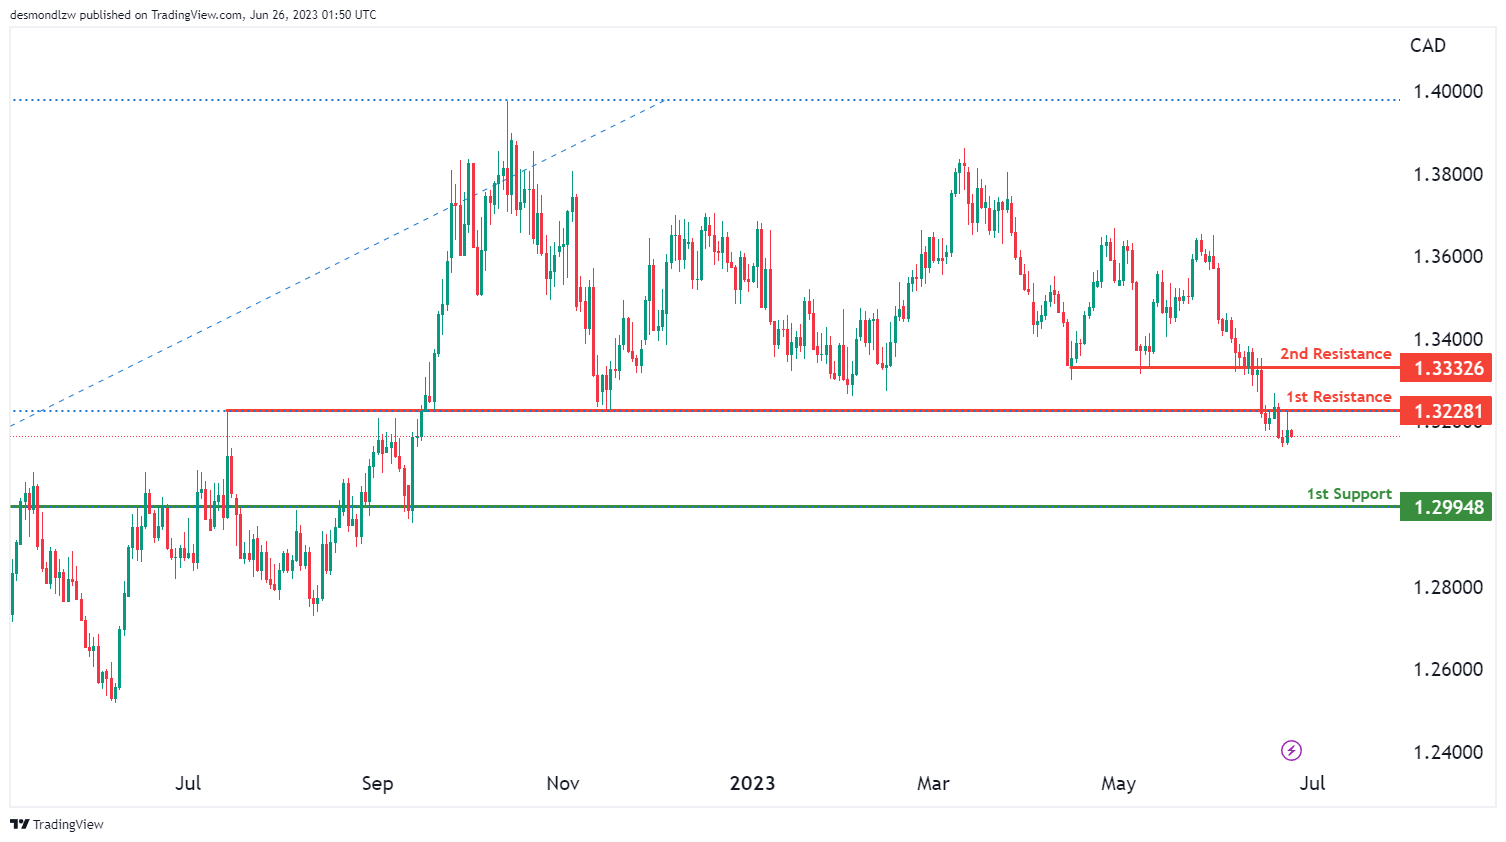
USD/CAD:
The USD/CAD chart exhibits a bearish momentum, indicating a potential for continued downward movement in the market.
There is a likelihood of a bearish continuation towards the 1st support level at 1.2994, which is considered an overlap support.
Conversely, the 1st resistance level at 1.3228 represents an overlap resistance that could potentially hinder upward movement. Similarly, the 2nd resistance level at 1.3332 acts as another overlap resistance.
These factors contribute to the prevailing bearish momentum observed in the chart, suggesting a scenario where the price may continue its downward trajectory towards the 1st support level.
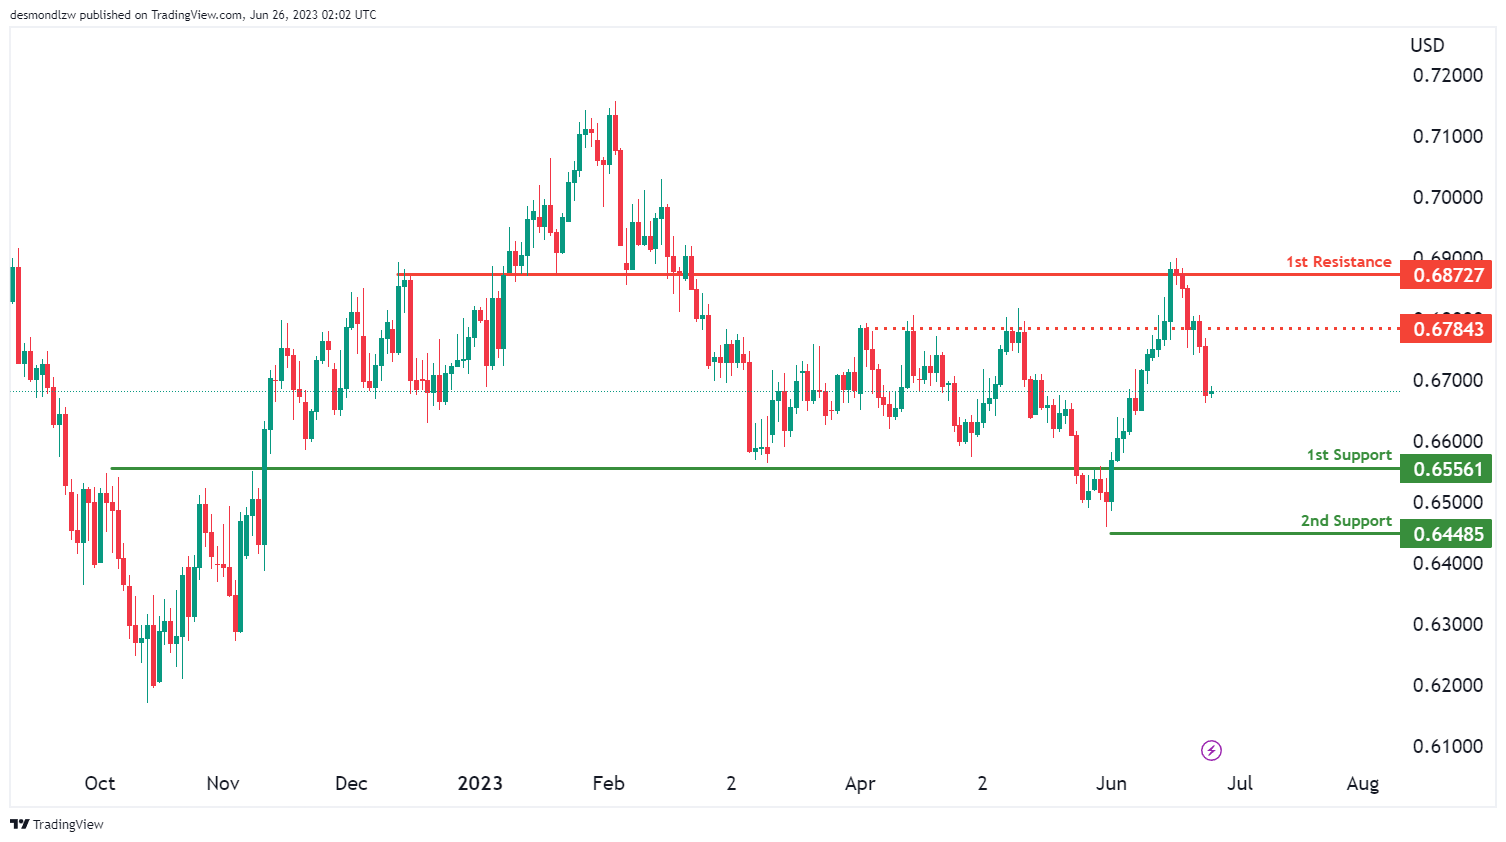
AUD/USD:
The AUD/USD chart indicates a bearish momentum, suggesting a potential for continued downward movement in the market.
There is a possibility of a bearish continuation towards the 1st support level at 0.6556, which is identified as a pullback support. Additionally, the 2nd support level at 0.6448 acts as a swing low support, providing further strength to the support zone.
On the upside, the 1st resistance level at 0.6872 represents an overlap resistance that could impede upward movement. Furthermore, an intermediate resistance at 0.6784 acts as a pullback resistance, adding to the potential barriers for upward price advancement.
NZD/USD
The NZD/USD chart exhibits a bearish momentum, indicating a potential for continued downward movement in the market. The price is currently within a bearish descending channel, reinforcing the bearish sentiment.
There is a possibility of a bearish continuation towards the 1st support level at 0.6089, which is considered a pullback support. Additionally, the 2nd support level at 0.6013 acts as a swing low support, providing additional strength to the support zone.
On the upside, the 1st resistance level at 0.6309 represents an overlap resistance that may impede upward movement. Furthermore, the 2nd resistance level at 0.6393 acts as a pullback resistance, potentially adding further resistance to the price’s upward advancement.

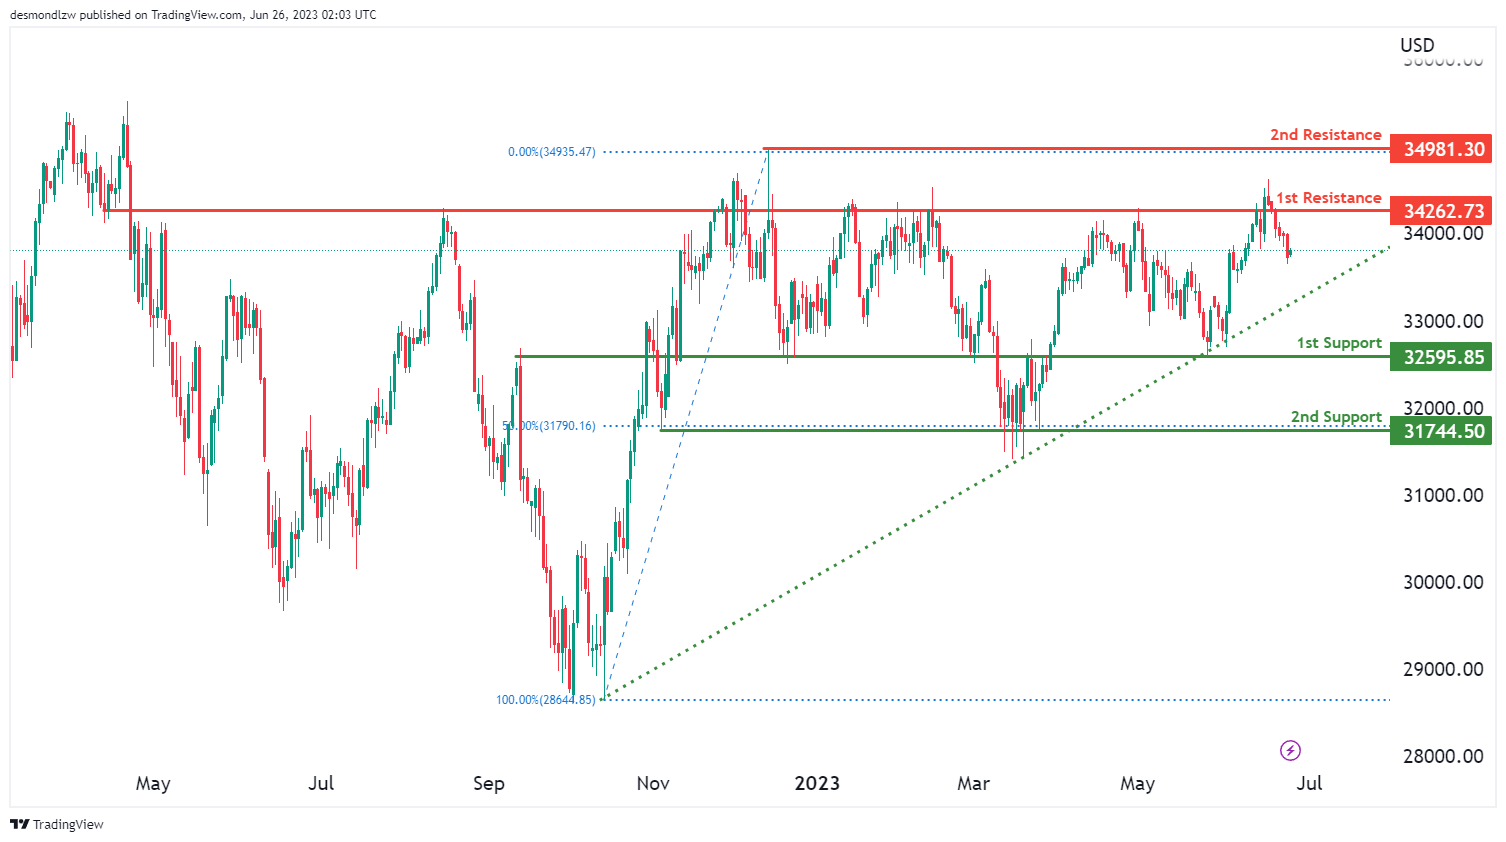
DJ30:
The DJ30 (Dow Jones Industrial Average) chart demonstrates a bullish momentum, indicating a potential for further upward movement in the market. The price is currently above a major ascending trend line, which serves as a support level and reinforces the bullish sentiment.
In the short term, there is a possibility of a drop towards the 1st support level at 32595.85 before bouncing back from there and rising towards the 1st resistance level at 34262.73.
The 1st support level at 32595.85 is considered an overlap support, providing a potential area of price consolidation or a bounce. Additionally, the 2nd support level at 31744.50 acts as a multi-swing low support, further reinforcing its significance as a potential support zone.
On the upside, the 1st resistance level at 34262.73 represents an overlap resistance, which may impede further upward movement. Furthermore, the 2nd resistance level at 34981.30 acts as a swing high resistance, potentially adding resistance to the price’s upward advancement.
GER30:
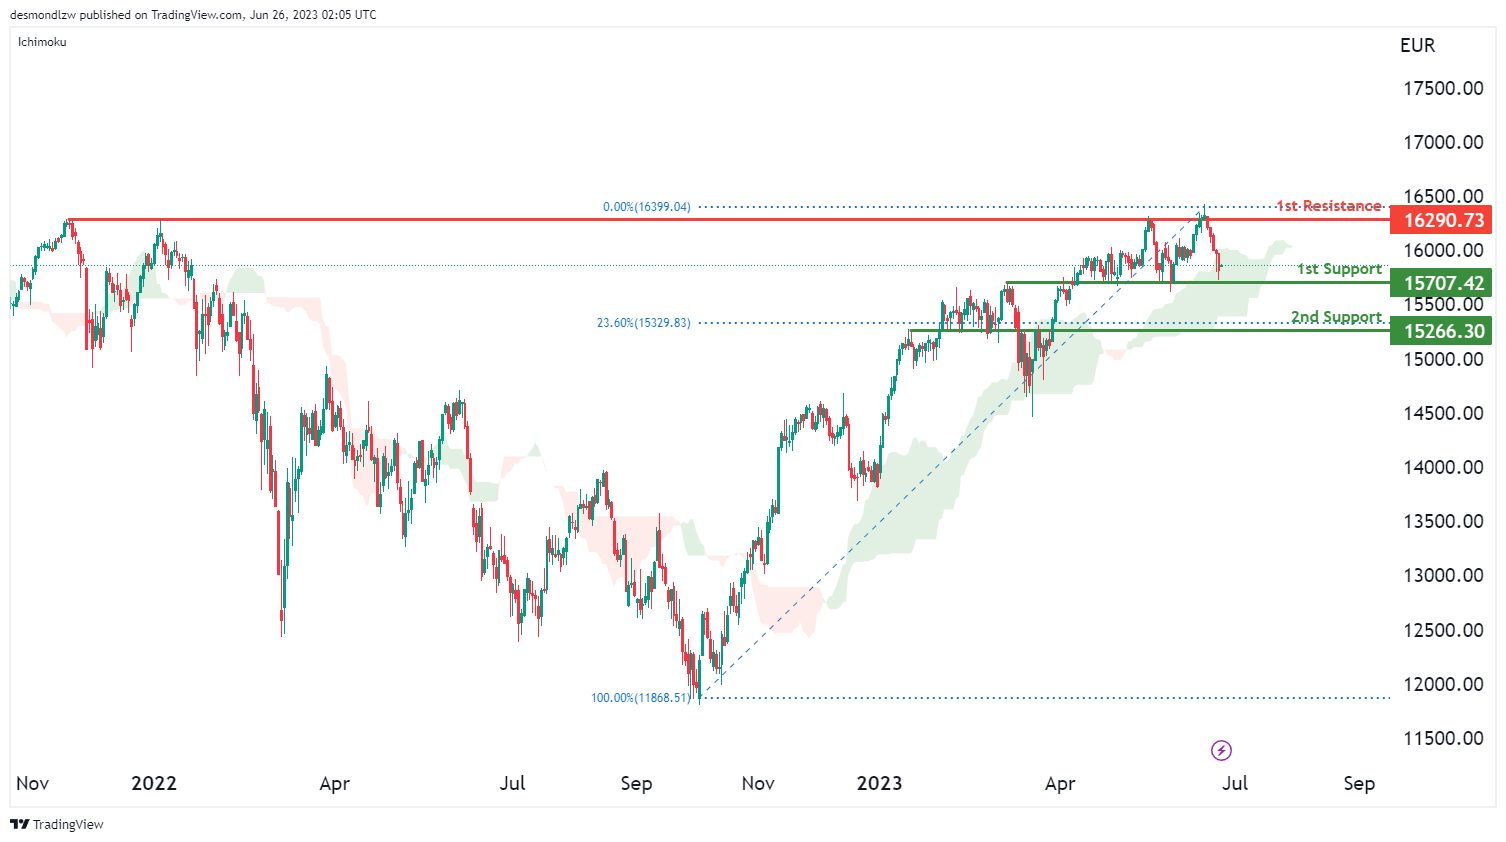
The GER30 chart shows a bullish momentum, supported by the price being above the bullish Ichimoku cloud, indicating a positive sentiment in the market.
There is a potential for a bullish bounce off the 1st support level at 15707.42, followed by a move towards the 1st resistance level at 16290.73.
The 1st support level at 15707.42 is considered an overlap support, providing a significant level where buyers may enter the market. Additionally, the 2nd support level at 15266.30 acts as a pullback support, further strengthening the support zone with the presence of the 23.60% Fibonacci Retracement.
On the upside, the 1st resistance level at 16290.73 represents a multi-swing high resistance, potentially posing a challenge for further upward movement.
US500
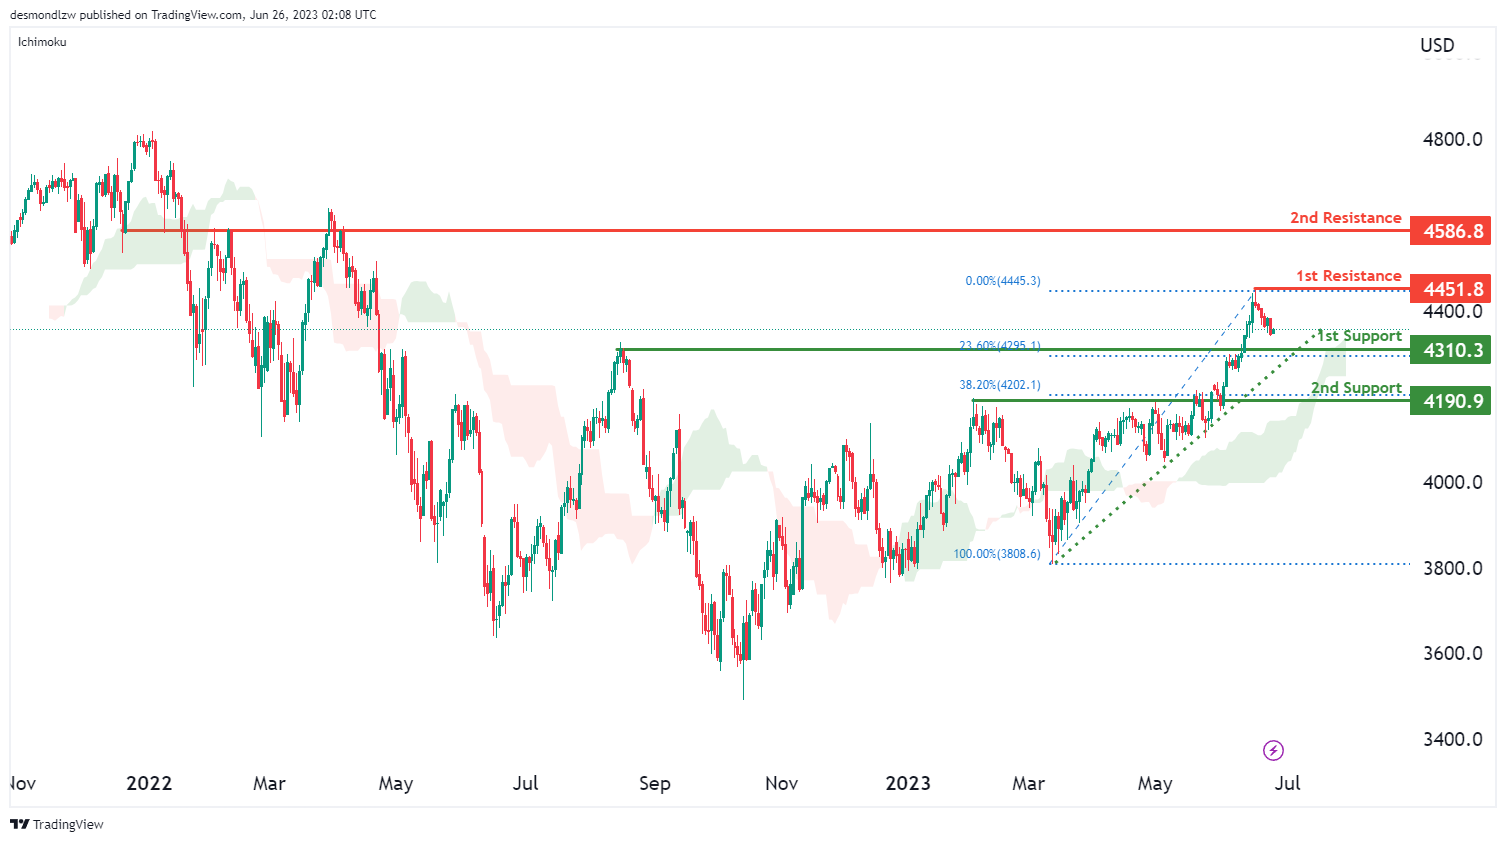
The US500 (S&P 500) chart demonstrates a bullish momentum, supported by two factors. Firstly, the price is currently above the bullish Ichimoku cloud, indicating a positive sentiment in the market. Secondly, it remains above a major ascending trend line, suggesting the potential for further upward movement.
There is a possibility of a short-term drop towards the 1st support level at 4310.3 before the price bounces from there and rises towards the 1st resistance level at 4451.8.
The 1st support level at 4310.3 acts as a pullback support, providing a significant level where buyers may enter the market. Additionally, the 2nd support level at 4190.9 serves as another pullback support, reinforcing the support zone with the presence of the 38.20% Fibonacci Retracement.
On the upside, the 1st resistance level at 4451.8 represents a swing high resistance, potentially posing a challenge for further upward movement. Similarly, the 2nd resistance level at 4586.8 is an overlap resistance, further reinforcing its significance.
BTC/USD:
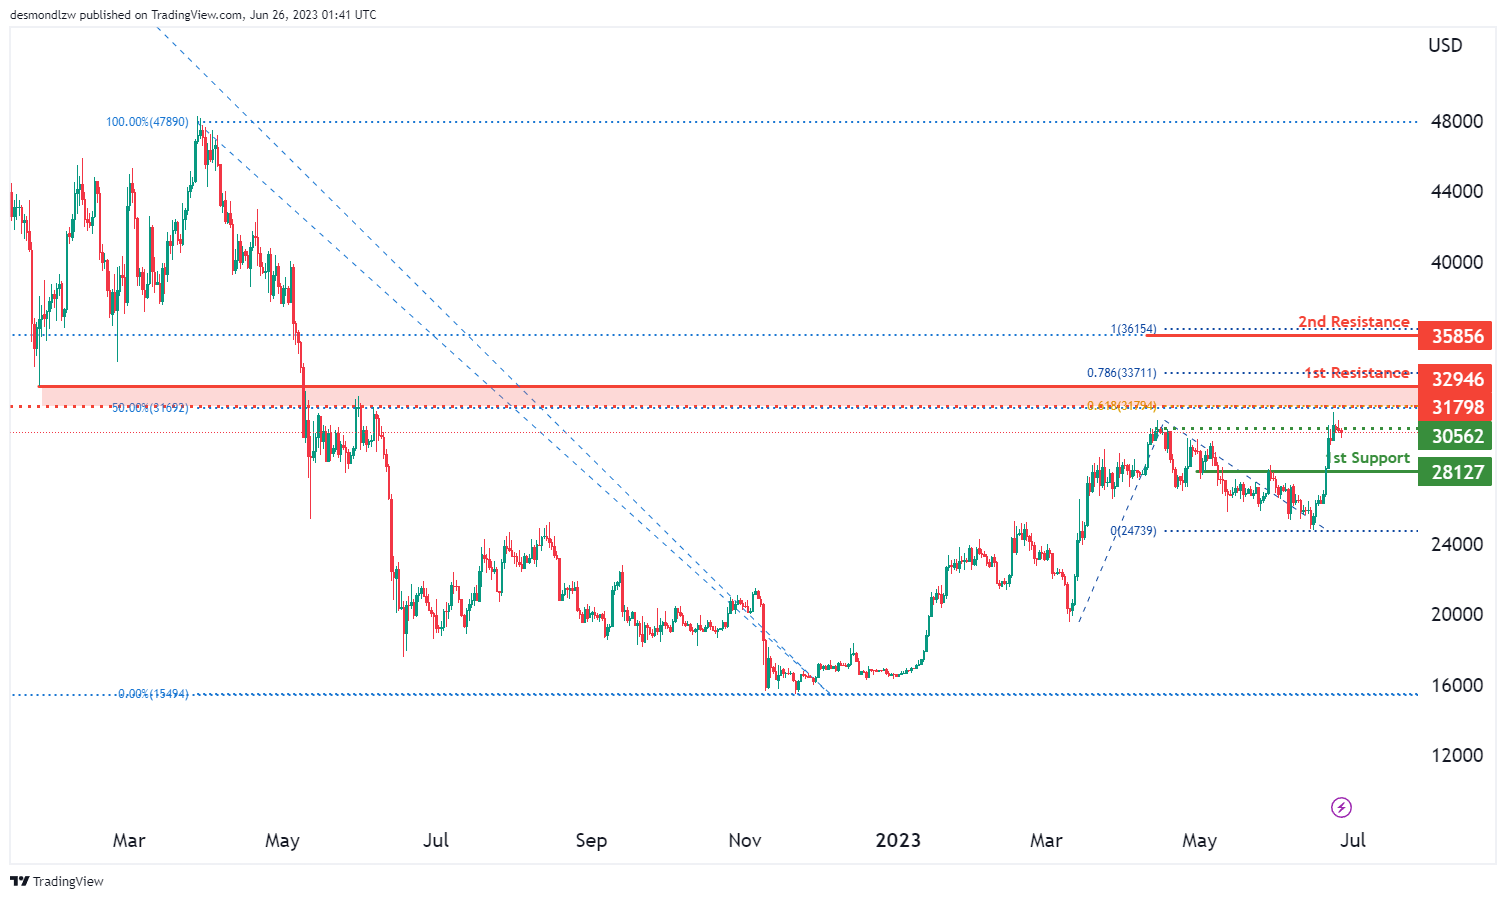
The BTC/USD chart currently exhibits a bearish momentum, indicating a downward trend in the market.
There is a possibility of a bearish reaction at the 1st resistance level of 32946, potentially causing the price to drop towards the 1st support level at 28127.
The 1st support level at 28127 acts as a pullback support, providing a significant level where buyers may enter the market. Additionally, the intermediate support at 30562 serves as a multi-swing low support, further reinforcing its importance as a potential price floor.
On the upside, the 1st resistance level at 32946 represents a pullback resistance, which could impede further upward movement. Similarly, the 2nd resistance level at 35856 is significant as it aligns with the 100% Fibonacci Projection.
Furthermore, the intermediate resistance at 31798 acts as an overlap resistance, reinforced by the presence of the 50% Fibonacci Retracement and the 61.80% Fibonacci Projection. This confluence of Fibonacci levels enhances the significance of this resistance level.
ETH/USD:
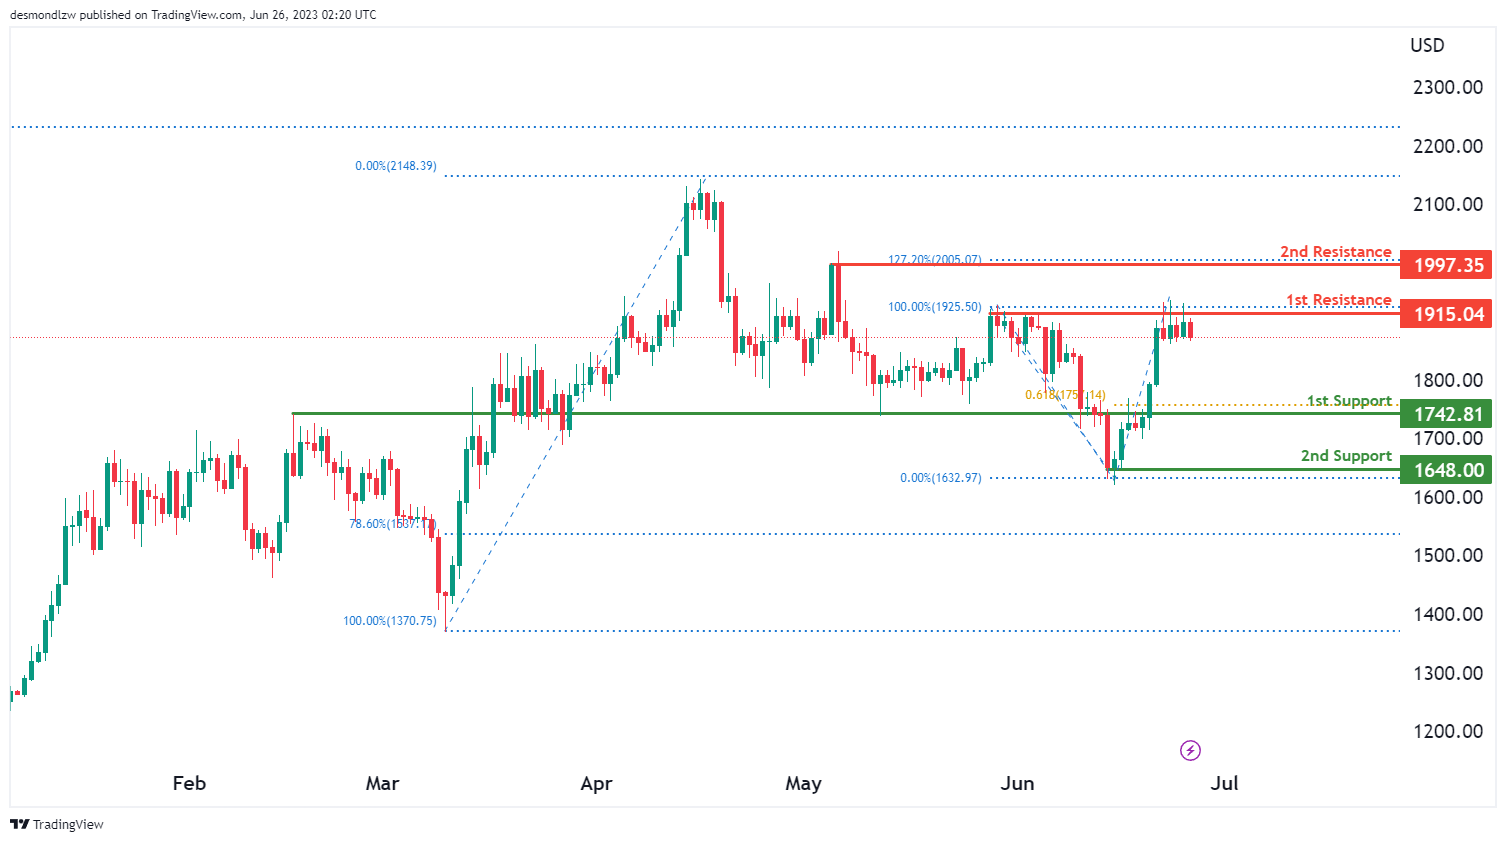
The ETH/USD chart currently shows a bearish momentum, indicating a downward trend in the market.
There is a potential for a bearish reaction at the 1st resistance level of 1915.07, which may lead to a drop towards the 1st support level at 1742.81.
The 1st support level at 1742.81 is considered a pullback support, offering a significant level where buyers could enter the market. Additionally, the 2nd support level at 1648.00 acts as a swing low support, further reinforcing its importance as a potential price floor.
On the upside, the 1st resistance level at 1915.07 represents a multi-swing high resistance, potentially impeding further upward movement. Similarly, the 2nd resistance level at 1997.35 acts as a swing high resistance, strengthened by the presence of the 127.20% Fibonacci Extension.
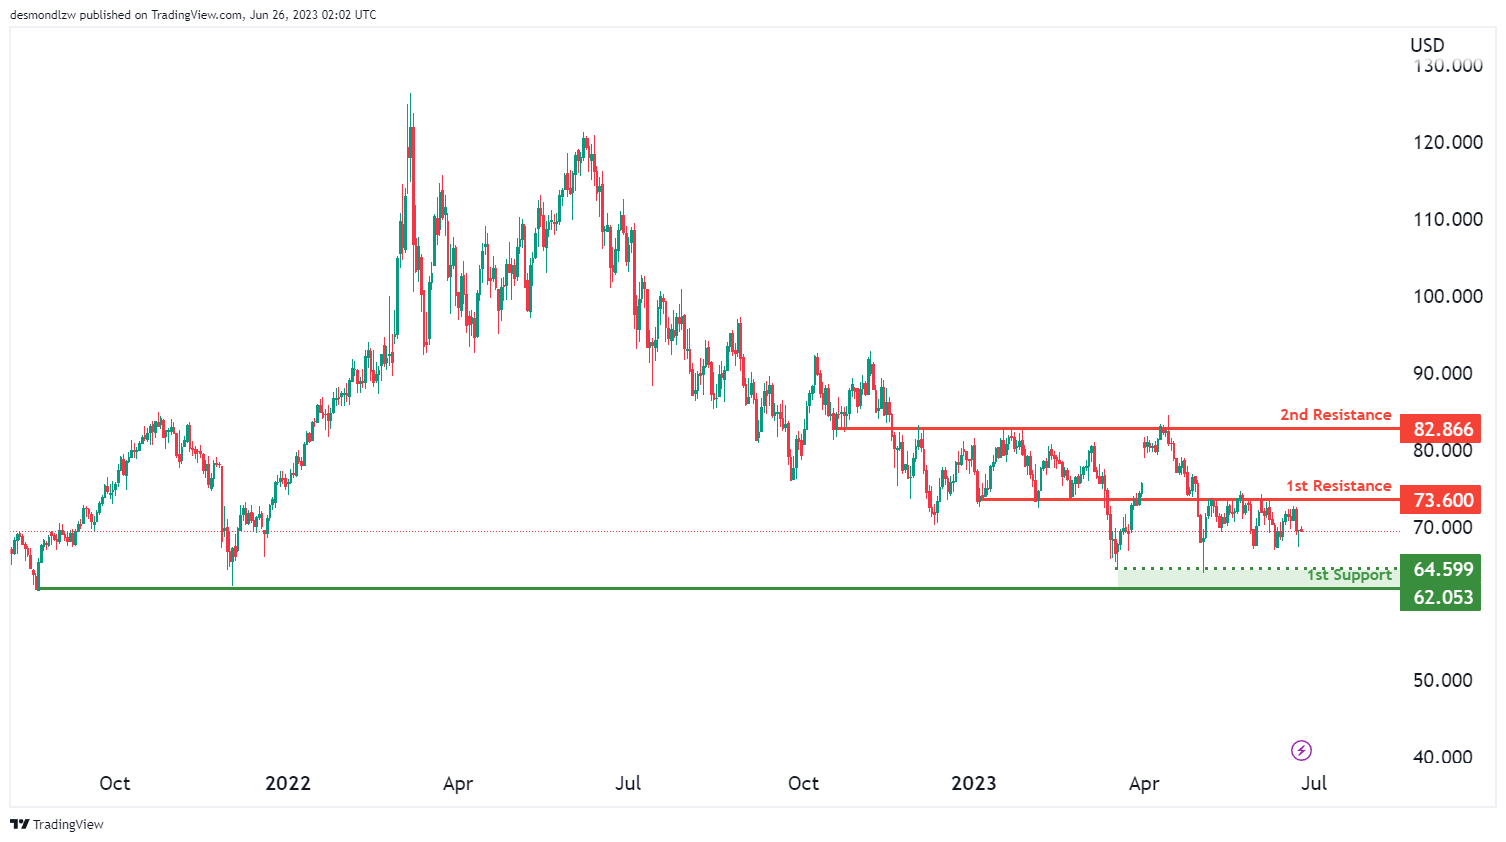
WTI/USD:
The WTI chart currently shows a neutral momentum, indicating a lack of clear direction in the market.
There is a potential for price to fluctuate between the 1st resistance level at 73.60 and the 1st support level at 62.05.
The 1st support level at 62.05 acts as a swing low support, providing a level where buyers could enter the market. Additionally, the intermediate support level at 64.59 further reinforces the support zone.
On the upside, the 1st resistance level at 73.60 represents an overlap resistance, potentially impeding further upward movement. Similarly, the 2nd resistance level at 82.86 acts as another overlap resistance, indicating its significance in hindering price advancement.
XAU/USD (GOLD):
The XAU/USD chart exhibits a bullish momentum, indicating a potential upward movement.
There is a possibility for price to experience a bullish bounce off the 1st support level at 1906.28, which is characterised as an overlap support. This support level is further reinforced by the presence of the 61.80% Fibonacci Retracement and the 61.80% Fibonacci Projection, indicating a Fibonacci confluence. Additionally, the 2nd support level at 1861.59 acts as a pullback support, providing additional strength to the support zone.
On the upside, the 1st resistance level at 1978.95 represents an overlap resistance, potentially hindering further upward price advancement. Similarly, the intermediate resistance level at 1935.74 also acts as an overlap resistance, adding to its significance.
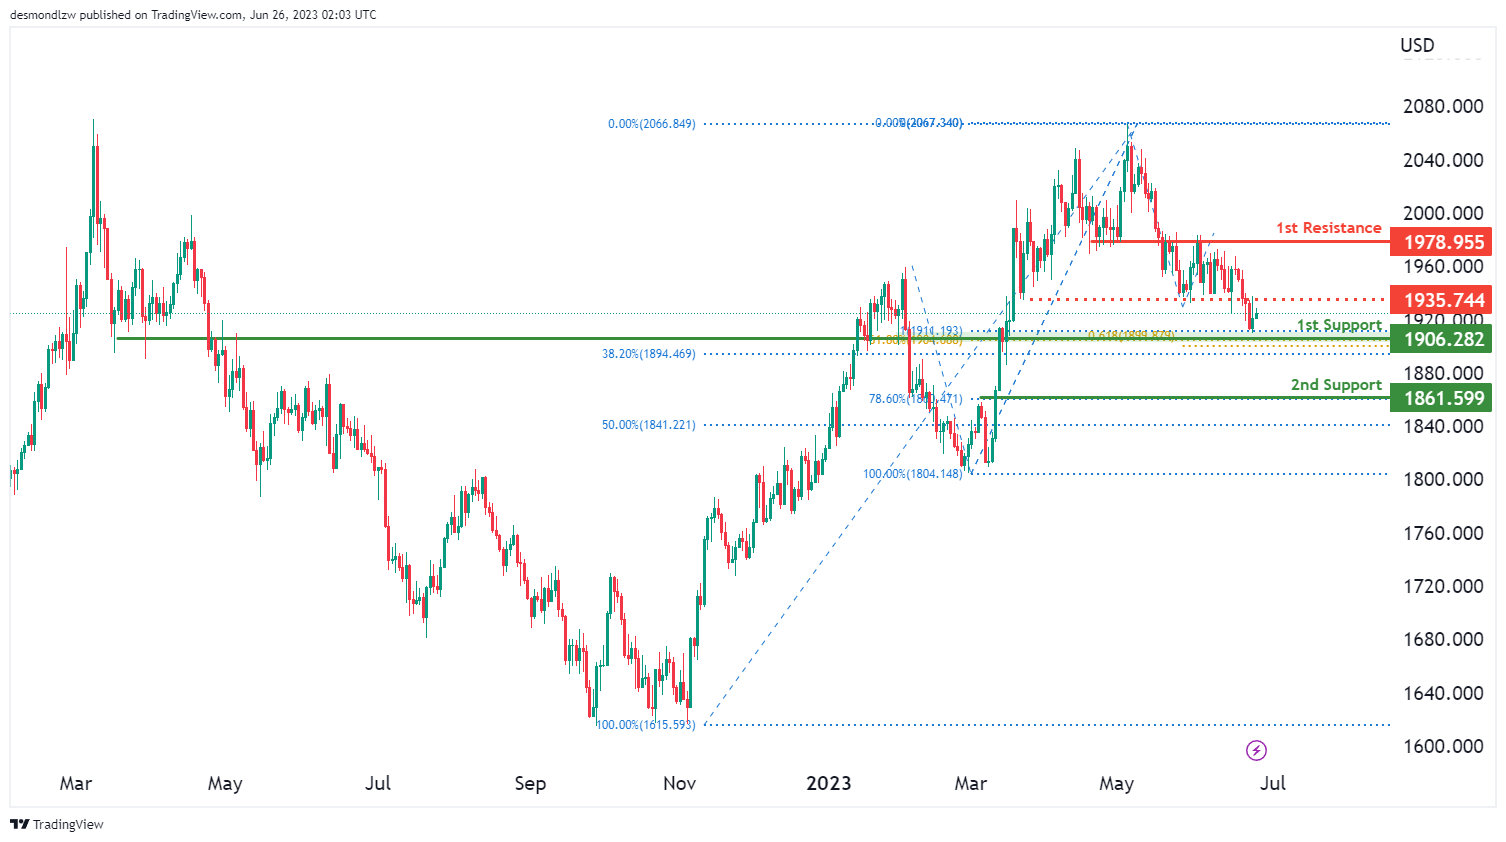


 chart demonstrates a bearish momentum, indicated by the price being below a major descending trend line, suggesting the potential for continued downward movement.)