
DXY:
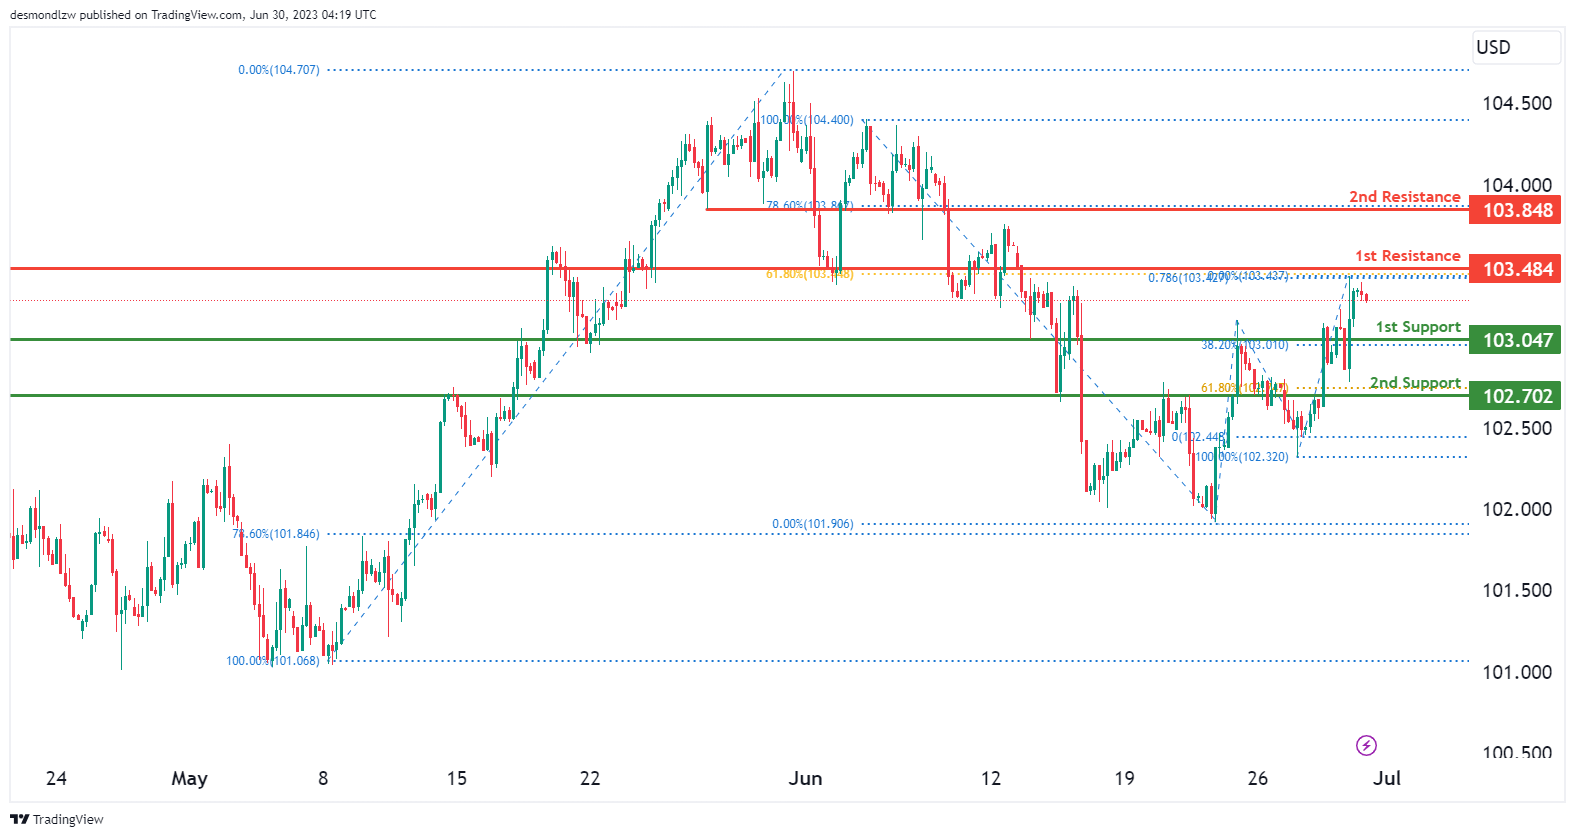
The DXY (US Dollar Index) chart currently exhibits a neutral momentum, suggesting a lack of clear direction. There is a possibility for the price to fluctuate between the 1st support level at 103.047, which is an overlap support and coincides with the 38.2% Fibonacci Retracement. The 2nd support level at 102.702 is an overlap support and coincides with the 61.8% Fibonacci Retracement. The 1st resistance level at 103.484, which represents an overlap resistance, conincides with the 61.8% Fibonacci Retracement and 78.6% Fibonacci Projection, resulting in a Fibonacci confluence.. An additional level to consider is the 2nd resistance at 103.848, an overlap resistance aligning with the 78.6% Fibonacci Retracement.
EUR/USD:
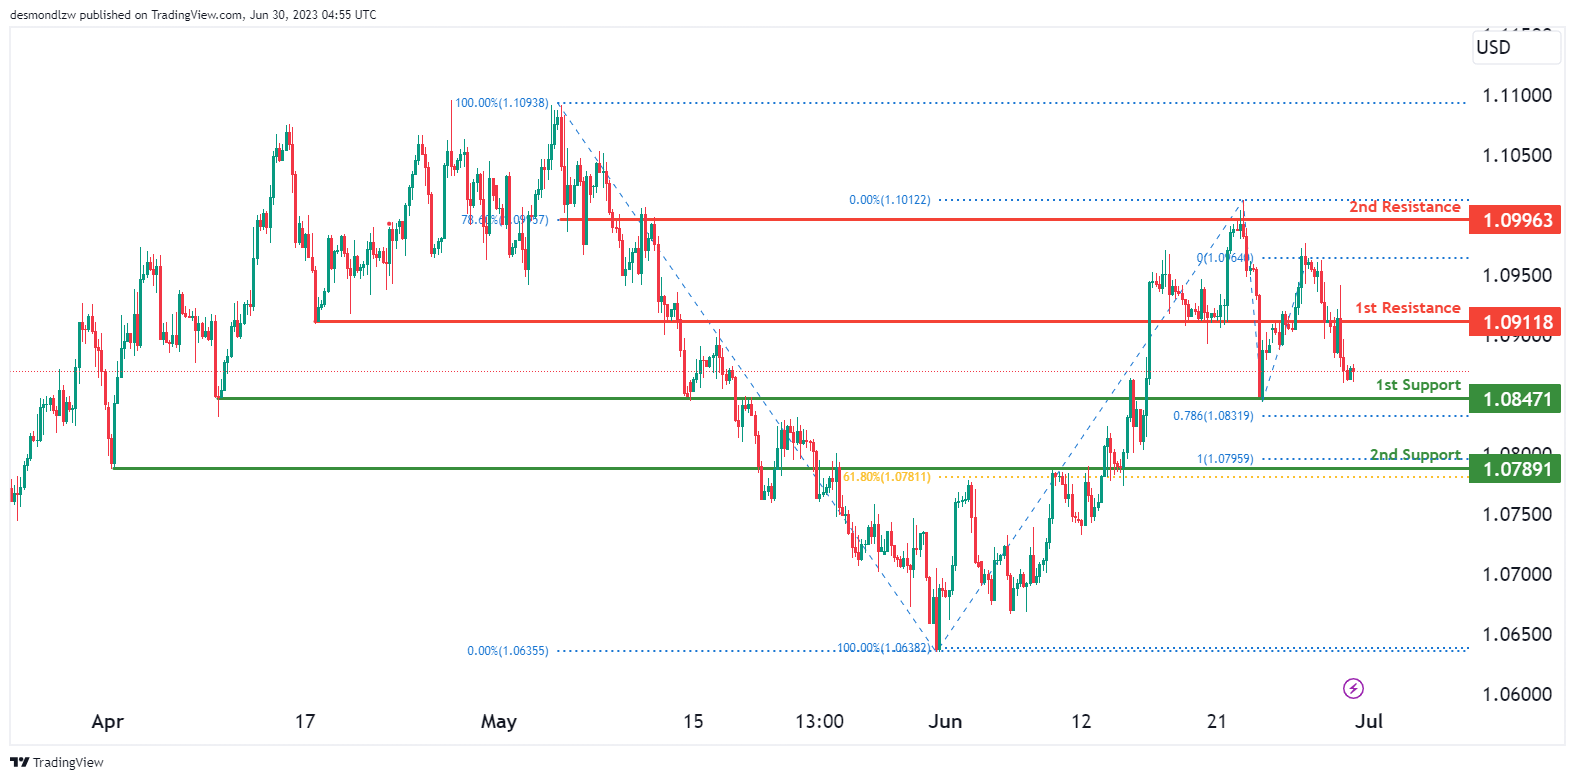
The EUR/USD chart currently shows a bearish momentum, indicating a downward bias in the market. There is a possibility for the price to continue its bearish movement towards the 1st support level at 1.08471, which is considered an overlap support.
Additional support is found at the 2nd support level at 1.07891, identified as an overlap support that aligns with the 61.8% Fibonacci Retracement. On the upside, the 1st resistance level at 1.09118 acts as an overlap resistance, potentially impeding upward price advancement. Furthermore, the 2nd resistance level at 1.109963 represents another overlap resistance that aligns withe 78.6% Fibonacci Retracement.
GBP/USD:
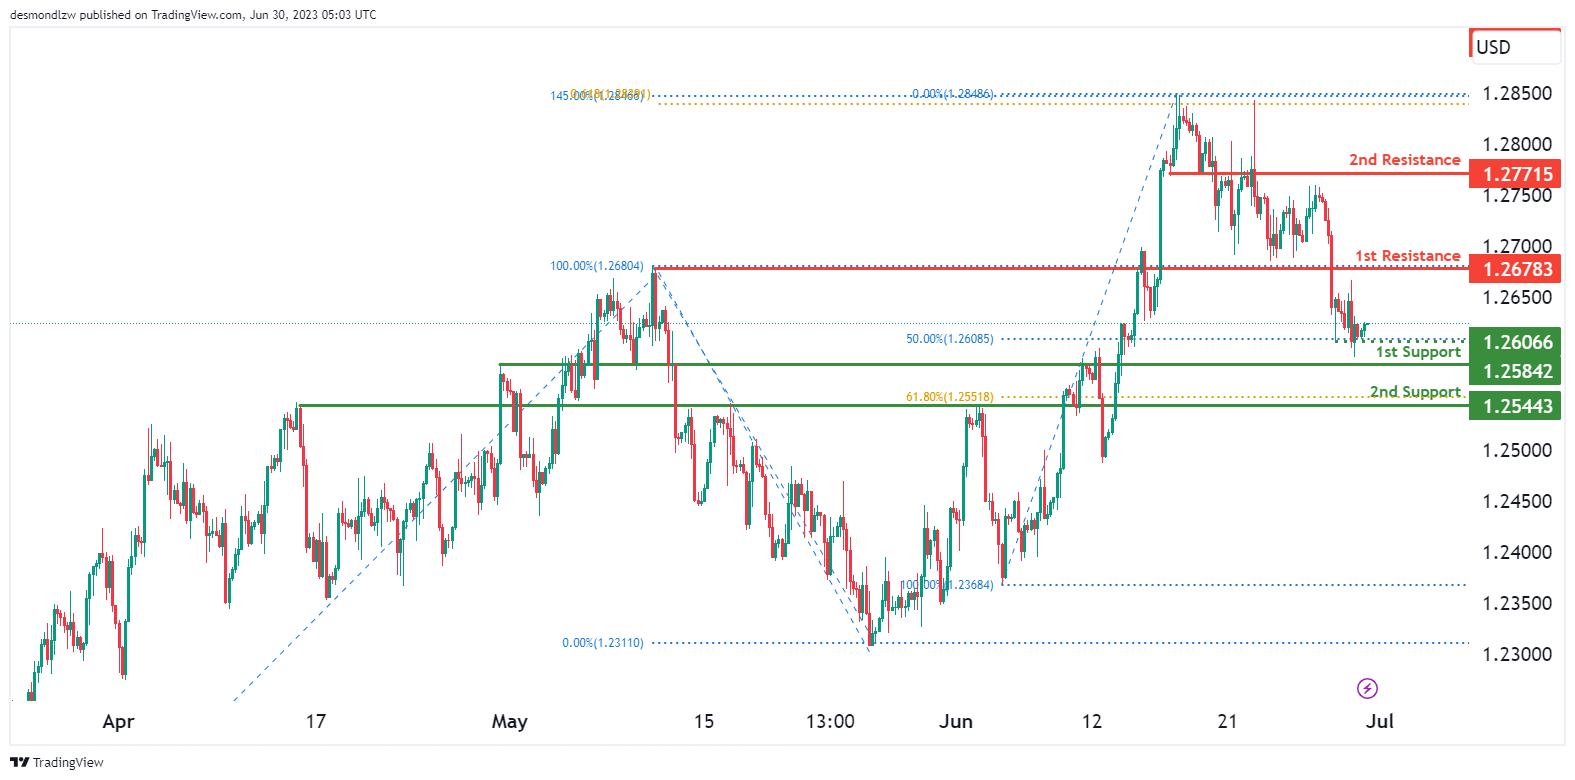
The GBP/USD chart currently indicates a bearish momentum, suggesting a downward trend in the market. There is a potential for the price to continue its bearish movement towards the 1st support level at 1.25842, which is identified as an overlap support, if price breaks below the intermediate support first at 1.26066..
Additional support is found at the 2nd support level at 1.25443, characterized as an overlap support and coincides with the 61.80% Fibonacci Retracement.
On the upside, the 1st resistance level at 1.26783 acts as an overlap resistance, potentially impeding upward price advancement. Furthermore, the 2nd resistance level at 1.27715 represents an overlap resistance.
USD/CHF:
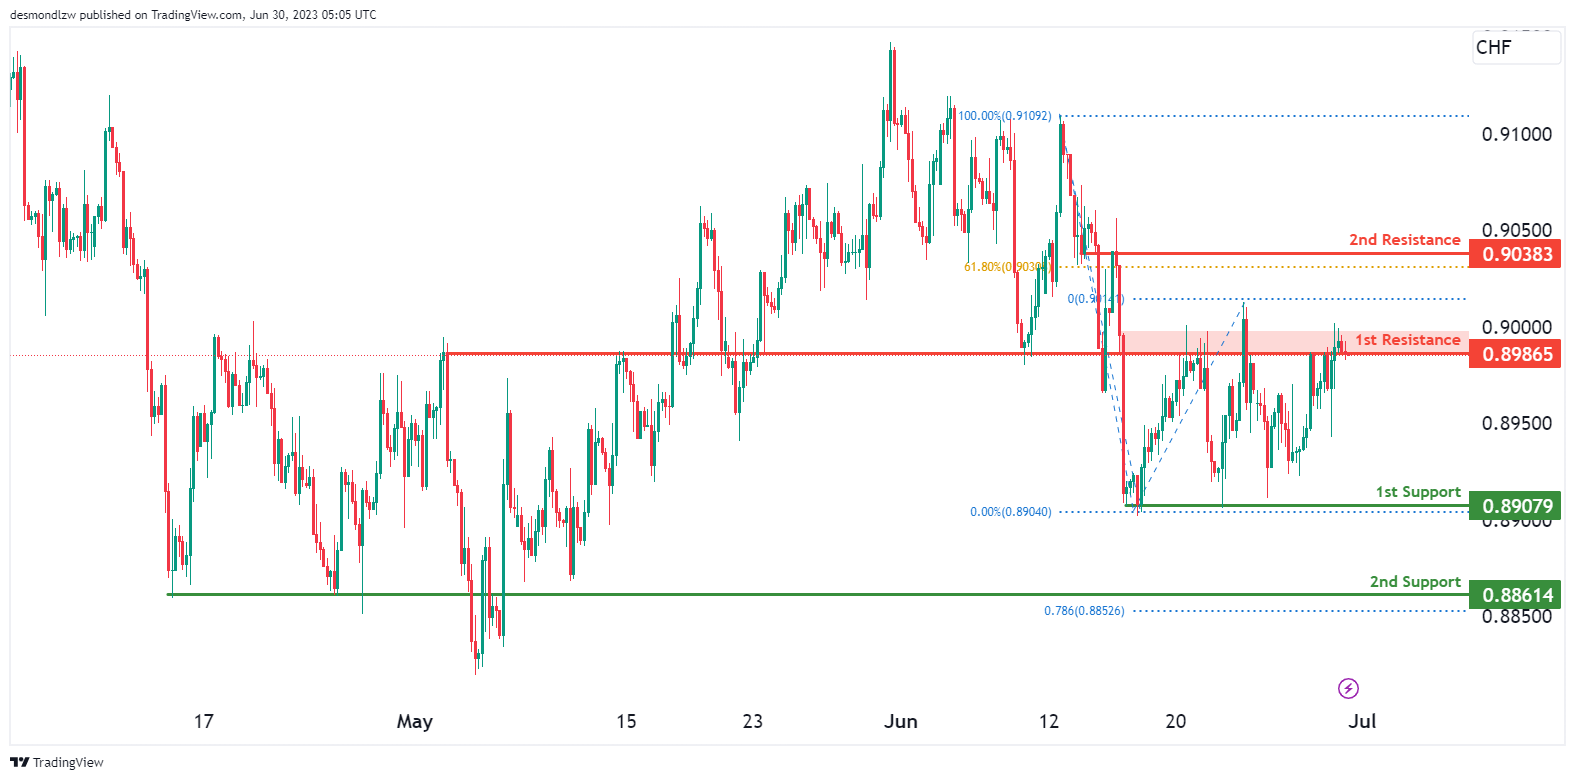
The USD/CHF chart currently demonstrates a weak bearish momentum. There is a potential for the price to reverse from the 1st resistance level at 0.89865, which is identified as an overlap resistance, and drop lower.
The 1st support level at 0.89079 is a multi-swing low overlap support while the 2nd support at 0.88614 is an overlap support that aligns close to the 78.6% Fibonacci Projection.
Additionally, the 2nd resistance level at 0.9038 is considered an overlap resistance that aligns with close to the 61.8% Fibonacci Retracement.
USD/JPY:
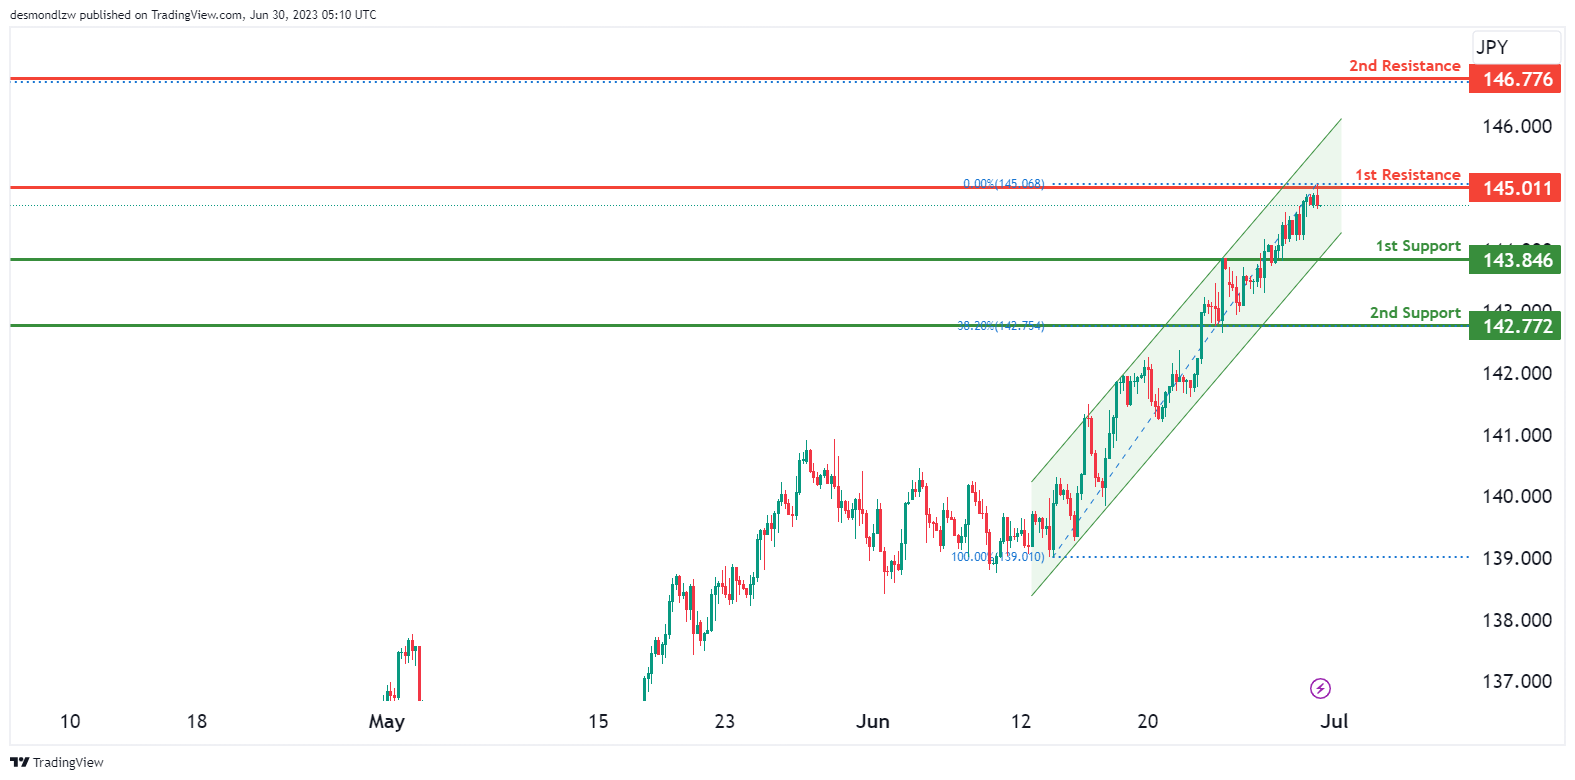
The USD/JPY chart currently exhibits a bullish momentum, characterized by the price movement within a bullish ascending channel, suggesting a potential for further upward movement.
There is a possibility of a bullish continuation towards the 1st resistance level at 145.011. Additionally, the 2nd resistance level at 146.776 acts as another resistance level which coincides with the 78.60% Fibonacci Retracement.
On the downside, the 1st support level at 143.846 is identified as an overlap support, providing potential strength to the support zone. Furthermore, the 2nd support level at 142.772 is an overlap support and also aligns with the 38.2% Fibonacci Projection.
USD/CAD:
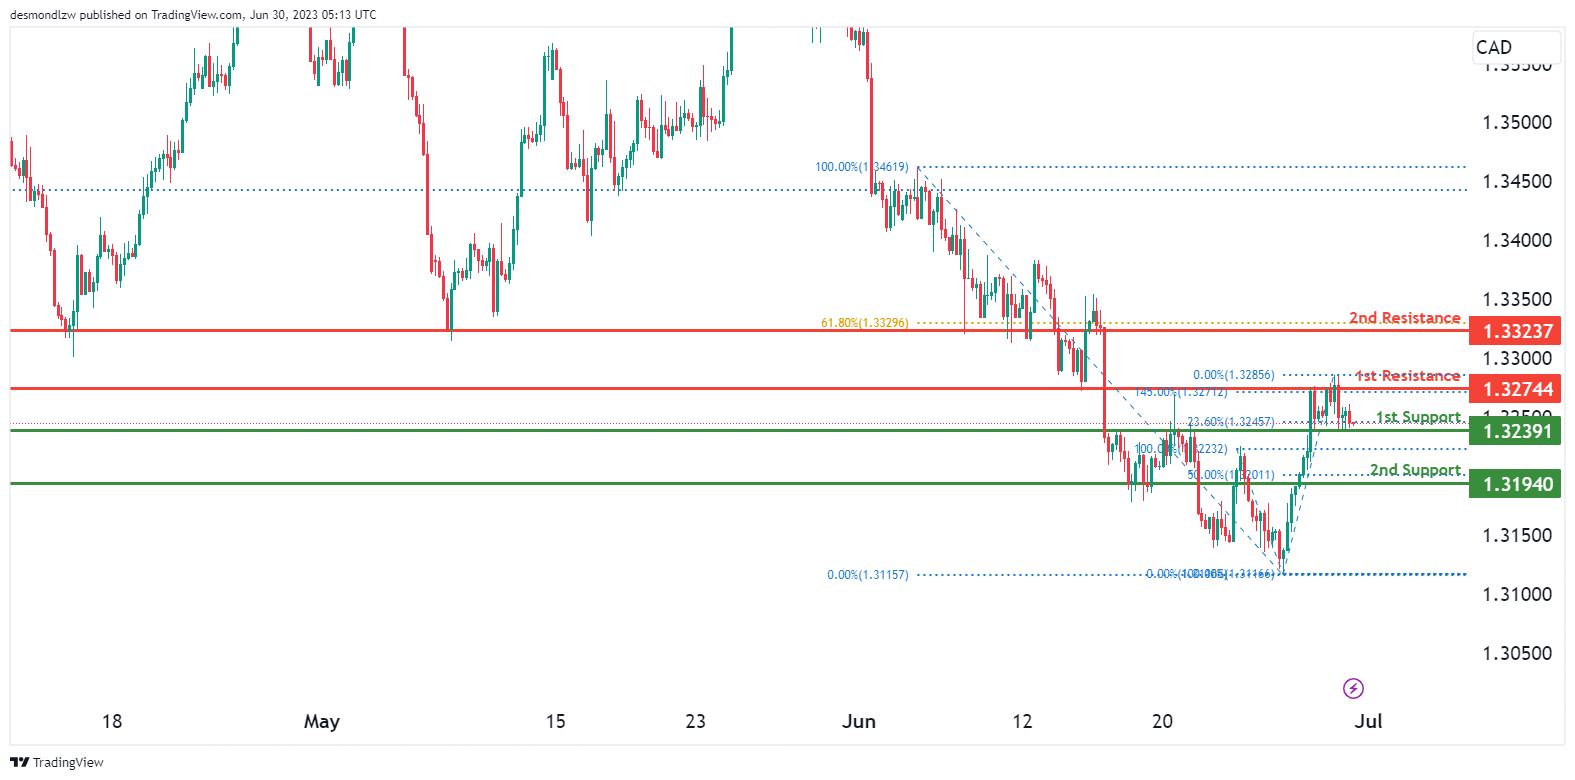
USD/CAD currently exhibits a weak bullish momentum on the chart. Several factors contribute to this momentum, indicating that the price could potentially continue its bullish movement if it bounces from the 1st support level.
The 1st support level is located at 1.32391 and is considered good due to its overlap support characteristics and also aligns with the 23.6% Fibonacci Retracement. Additionally, there is a 2nd support level at 1.31940, which is significant as it represents an overlap support.
On the resistance side, the 1st resistance is positioned at 1.32744 and is considered good because it represents overlap resistance. Furthermore, there is a 2nd resistance level at 1.33237, which is significant as it represents overlap resistance and aligns with a 61.8% Fibonacci Retracement.
AUD/USD:
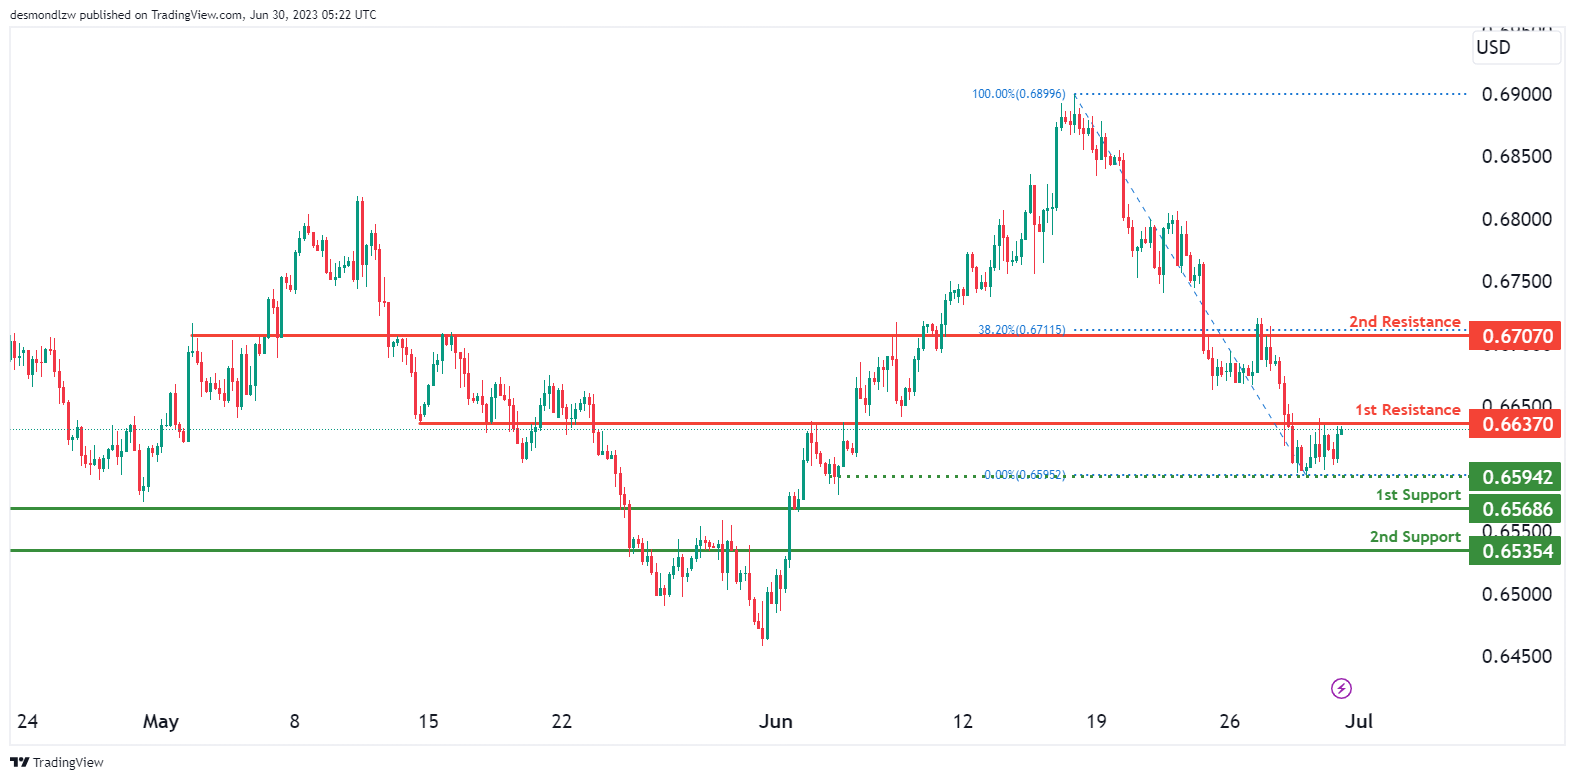
AUD/USD currently exhibits bullish momentum on the chart. Several factors contribute to this momentum, indicating that the price could potentially continue its bearish movement towards the 1st resistance level.
The 1st support level is located at 0.65686 and is considered good due to its overlap support characteristics. Additionally, there is a 2nd support level at 0.65354, which is significant as it represents an overlap support.
On the resistance side, the 1st resistance is positioned at 0.66370 and is considered good because it represents overlap resistance. Furthermore, there is a 2nd resistance level at 0.67070, which is significant as it also represents overlap resistance that aligns with the 38.2% Fibonacci Retracement.
NZD/USD
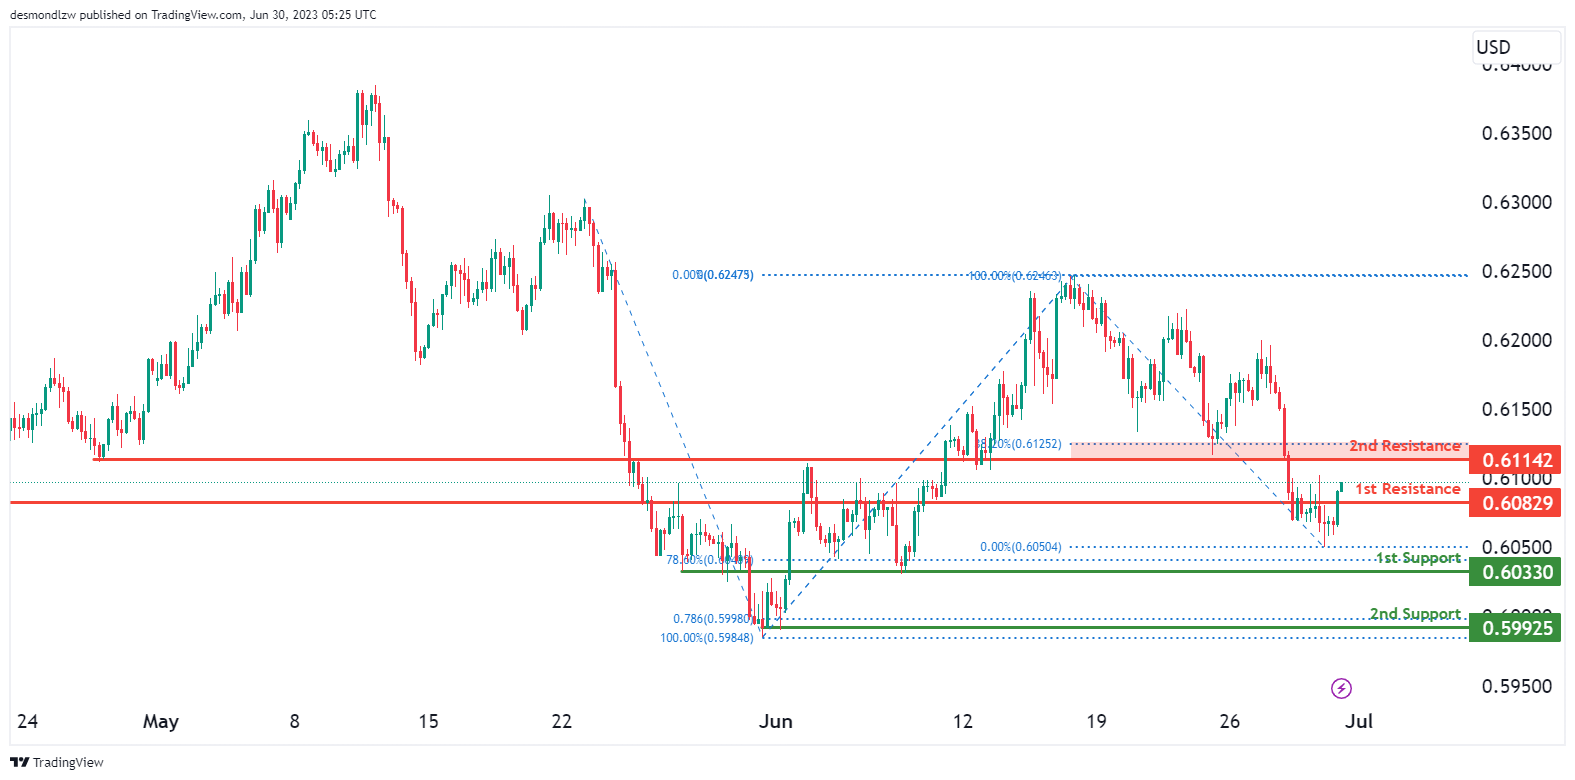
NZD/USD currently shows bullish momentum on the chart. Several factors contribute to this momentum, indicating that the price could potentially continue its bullish movement towards the 1st resistance level.
The 1st support level is located at 0.60330 and is considered good due to its overlap support characteristics and also aligns with the 78.6% Fibonacci Retracement. Additionally, there is a 2nd support level at 0.59925, which is is a swing-low support..
On the resistance side, the 1st resistance is positioned at 0.60829 and is considered good because it represents an overlap resistance. Furthermore, there is a 2nd resistance level at 0.61142, which is significant as it represents an overlap resistance that aligns close to the 38.2% Fibonacci retracement level.
DJ30:
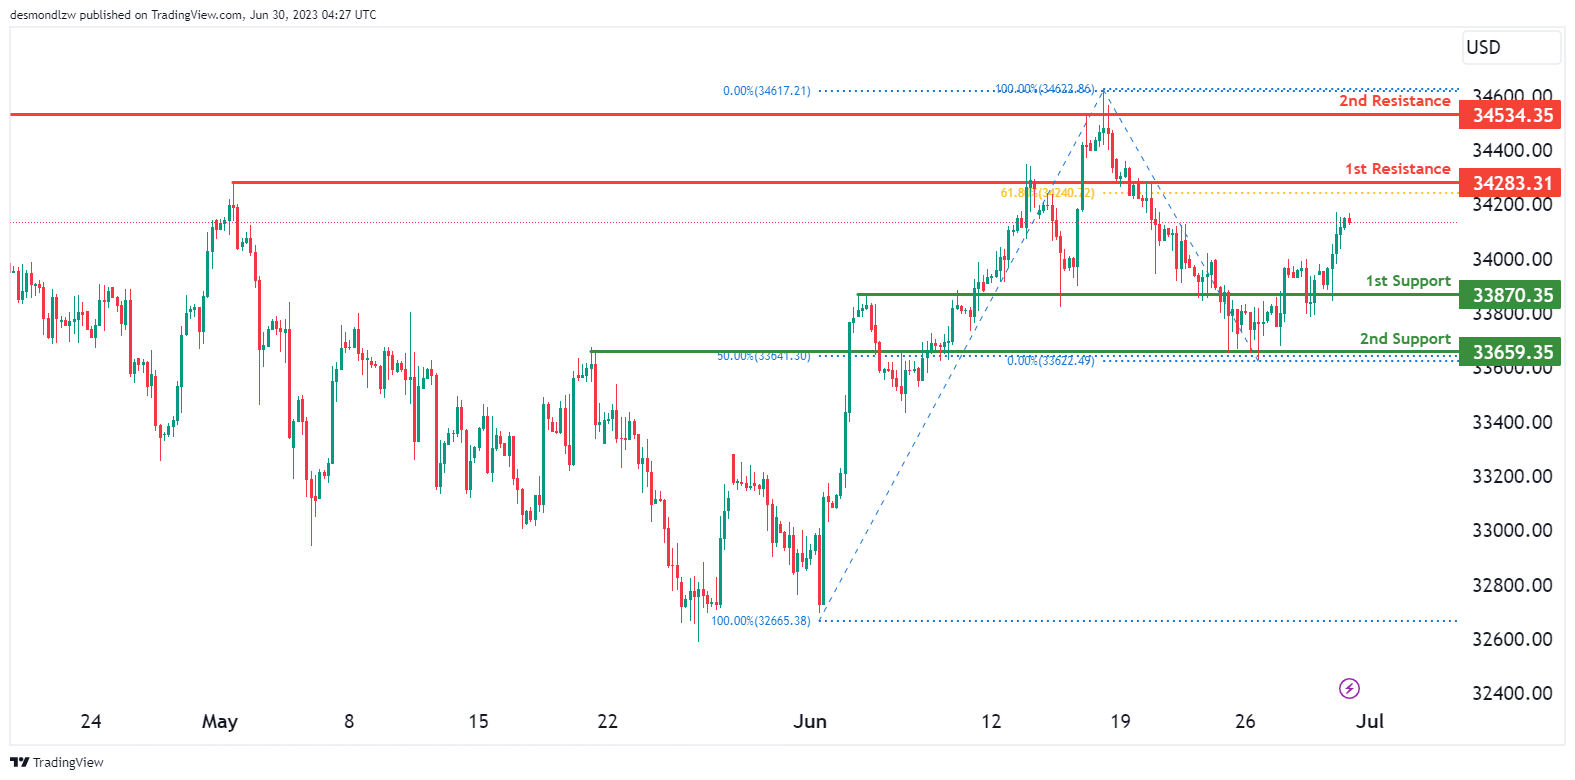
DJ30 (Dow Jones Industrial Average) currently exhibits a bullish overall momentum on the chart. Several factors contribute to this momentum, indicating that the price could potentially continue its bullish movement towards the 1st resistance at 34283.31.
The 1st support level is located at 33870.35 and is considered good due to its overlap support characteristics. Additionally, there is a 2nd support level at 33659.35, which is significant as it represents multi-swing low support and aligns with a 50% Fibonacci Retracement.
On the resistance side, the 1st resistance is positioned at 342283.31 and is considered good because it represents an overlap resistance that aligns with a 61.8% Fibonacci Retracement.. Furthermore, there is a 2nd resistance level at 34534.35, which is significant as it represents swing high resistance.
GER30:
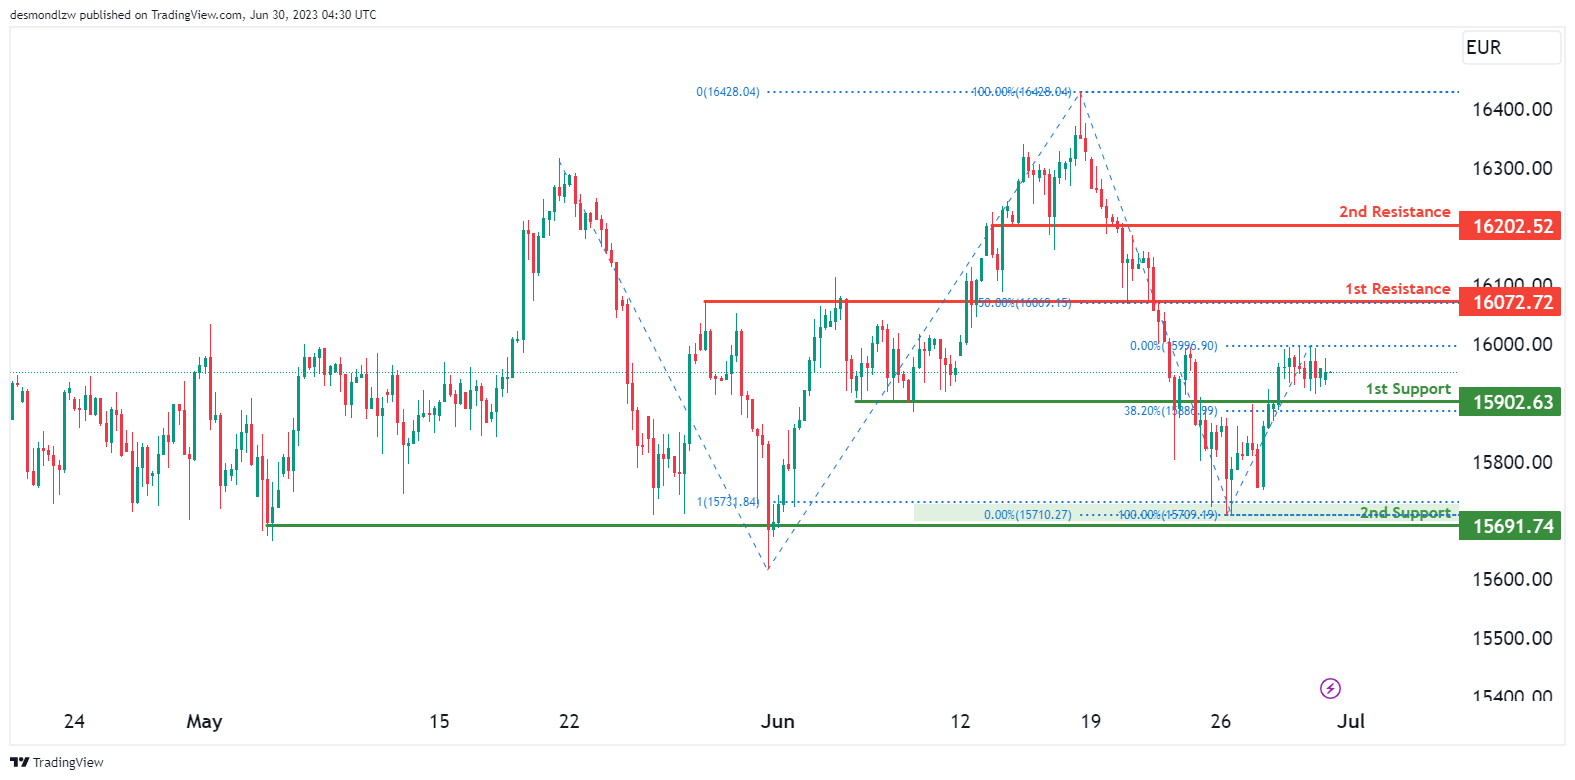
GER30 (German DAX) currently exhibits a bullish overall momentum on the chart. Several factors contribute to this momentum, indicating that the price could potentially continue its bullish movement towards the 1st resistance at 16072.72.
The 1st support level at 15902.63 is considered good due to its overlap support characteristics and aligns with the 38.2% Fibonacci Retracement. Additionally, there is a 2nd support level at 15691.74, which is significant as it represents a multi-swing low overlap support.
On the resistance side, the 1st resistance is positioned at 16072.72 and is considered good because it represents an overlap resistance that aligns with the 50% Fibonacci Retracement while the 2nd resistance is positioned at 16202.52 which is an overlap resistance.
US500
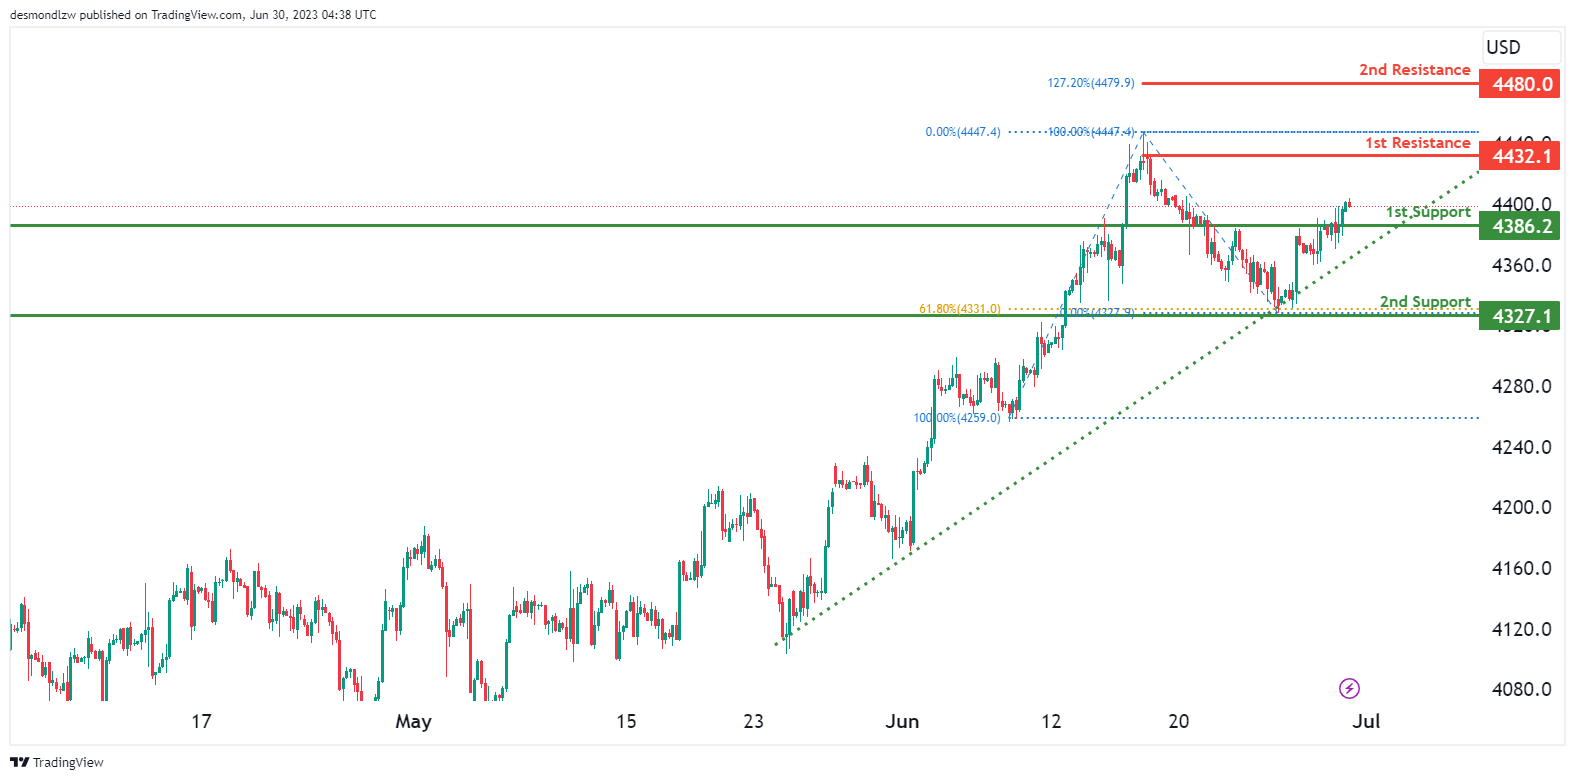
US500 (S&P 500) currently exhibits a bullish momentum on the chart with high confidence. Several factors contribute to this momentum, suggesting that the price could potentially continue its bullish movement towards the 1st resistance level.
The 1st support level is located at 4386.20 and is considered as an overlap support. Additionally, there is a 2nd support level at 4327.10, which is significant as it represents overlap support and aligns with the 61.8% Fibonacci Retracement.
On the resistance side, the 1st resistance is positioned at 4432.10 and is considered good because it represents swing high resistance. Furthermore, there is a 2nd resistance level at 4480.00, which aligns with the 127.2% Fibonacci Extension..
BTC/USD:
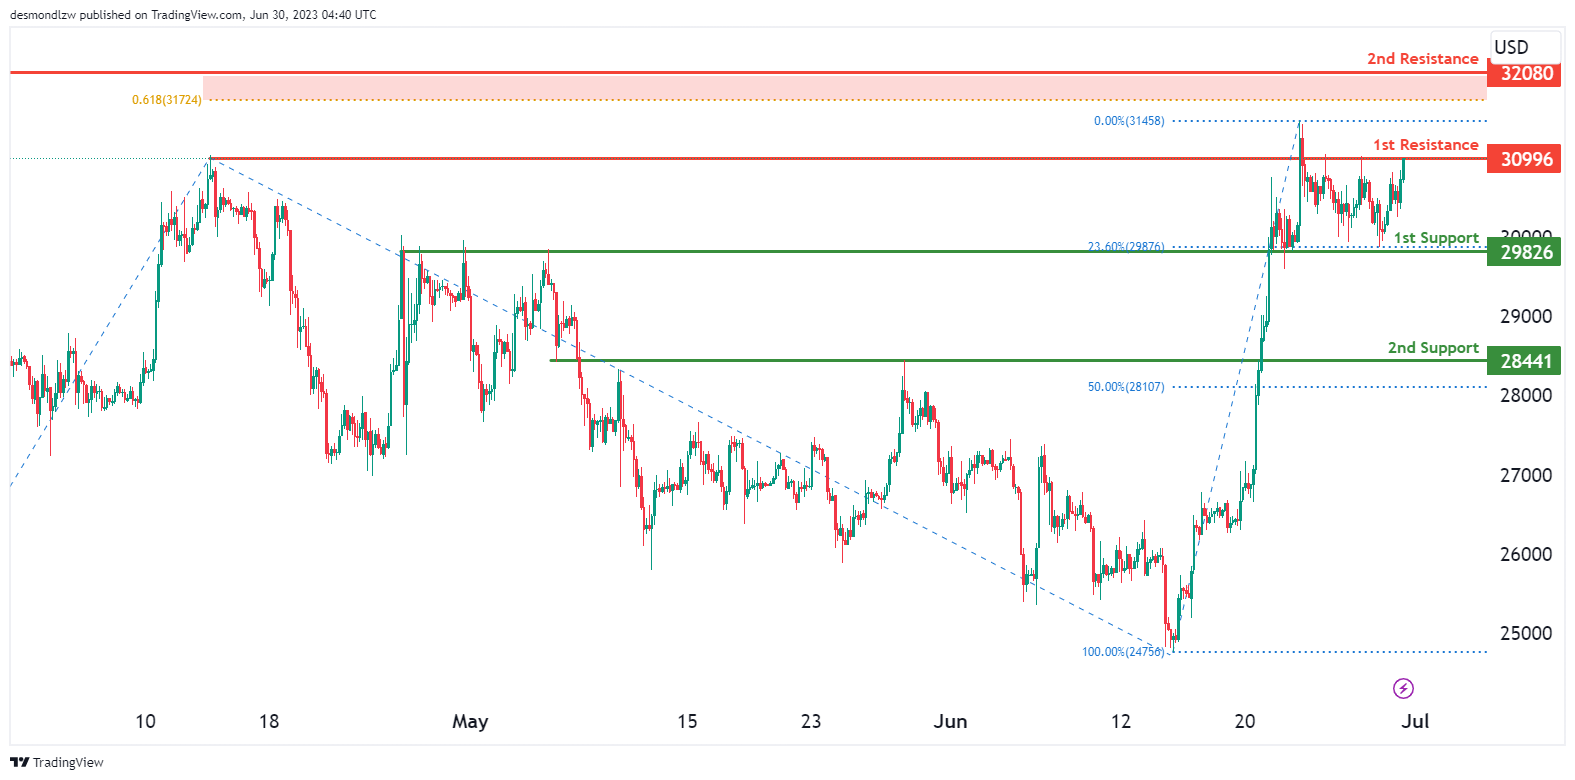
BTC/USD currently exhibits a bullish overall momentum on the chart. Several factors contribute to this momentum, indicating that the price could potentially continue its bullish movement towards the 1st resistance level at 30996.00. The 1st support level at 29826.00 is considered good due to its pullback support and also aligns with the 23.6% Fibonacci Retracement..
On the resistance side, the 1st resistance at 30996.00 is significant because it represents an overlap resistance. The 2nd resistance at 32080.00 is also noteworthy as it is an overlap resistance and aligns close to a 61.8% Fibonacci Projection.
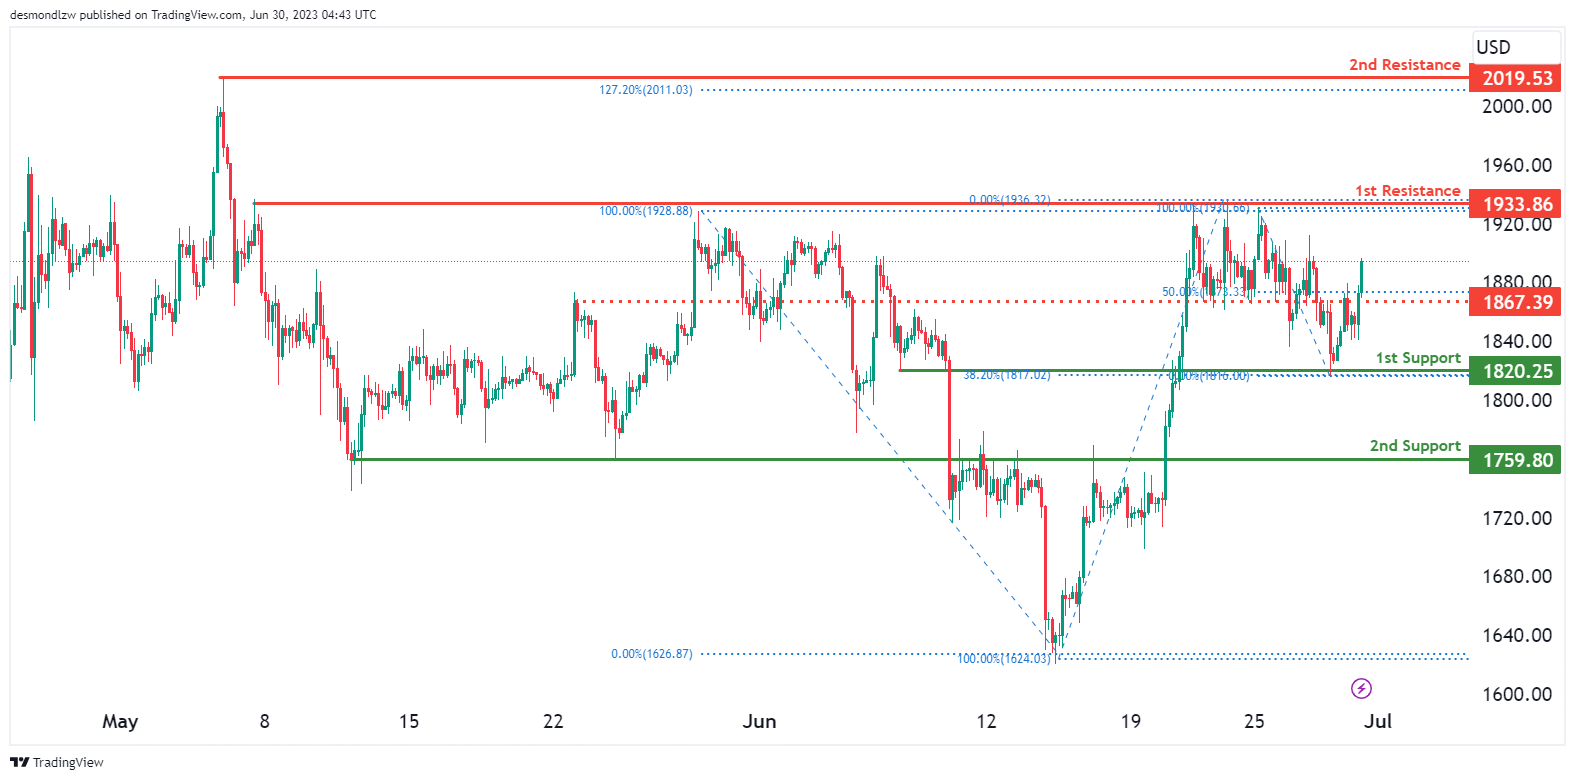
ETH/USD:
ETH/USD currently exhibits a strong bullish momentum on the chart with high confidence.Based on the bullish momentum, the price could potentially continue its upward movement towards the 1st resistance level.
The 1st support level is located at 1820.25 and is considered good due to its overlap support characteristics, as well as aligning with a 38.2% Fibonacci Retracement. Additionally, there is a 2nd support level at 1759.80, which is an overlap support.
On the resistance side, the 1st resistance is positioned at 1933.86 and is considered good because it represents multi-swing high resistance. Furthermore, there is a 2nd resistance level at 2019.53, which is significant as it represents swing high resistance and aligns with a 127.20% Fibonacci Extension.
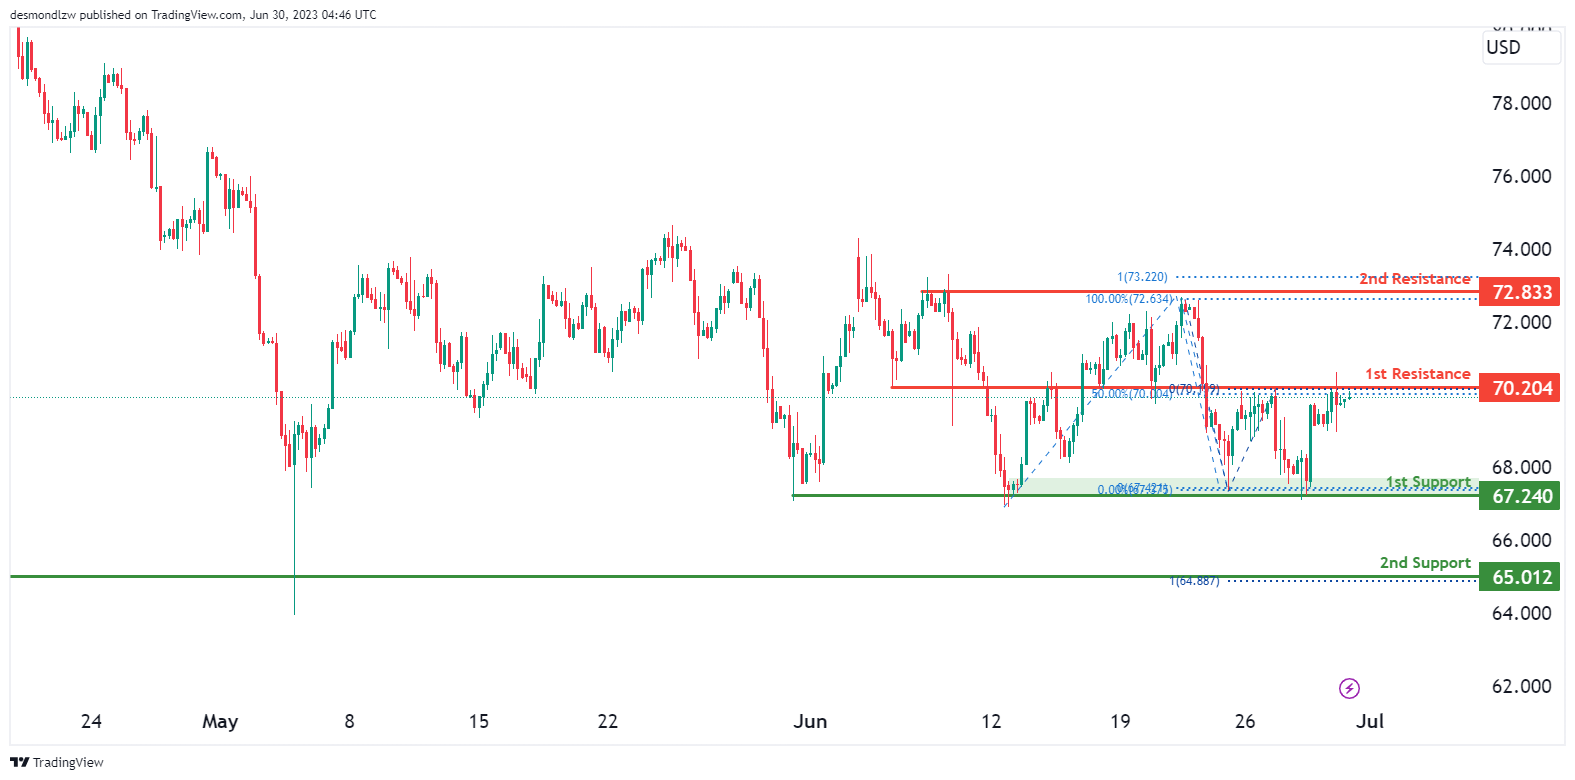
WTI/USD:
WTI (West Texas Intermediate) currently shows a wek bullish momentum on the chart. Several factors contribute to this momentum, indicating that the price could potentially move above the 1st resistance at 70.204 before reversing from this level. The 1st support level is considered good as it represents multi-swing low support. The 2nd support level at 65.012 is an overlap support that aligns with the 100% Fibonacci Projection.
On the resistance side, the 1st resistance at 70.204 is significant as it represents multi-swing high resistance. Similarly, the 2nd resistance at 72.833 is noteworthy as it also represents multi-swing high resistance.
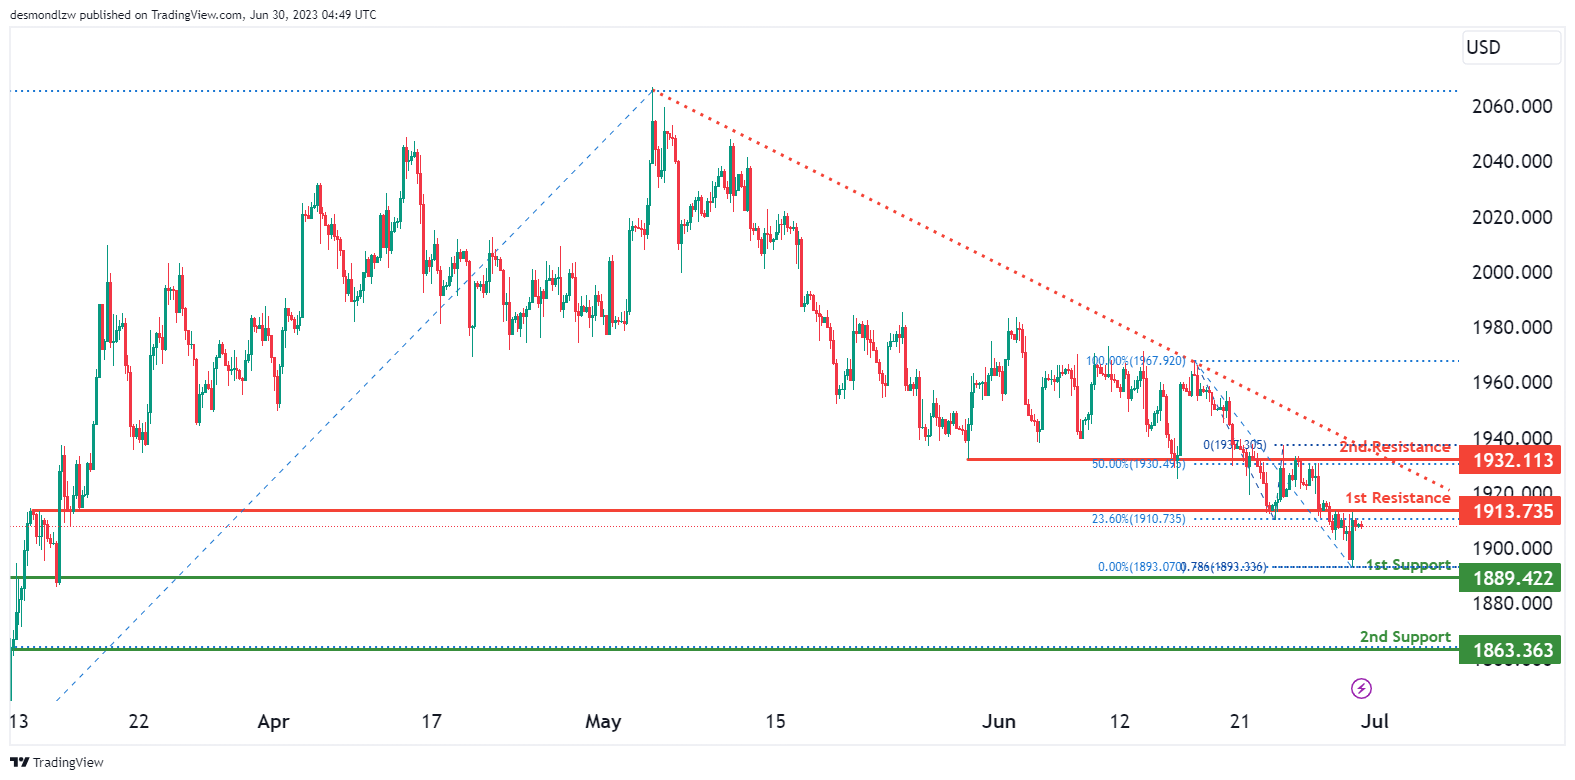
XAU/USD (GOLD):
The XAU/USD (Gold) chart displays a bearish momentum, indicating a negative outlook for the market. Factors contributing to this momentum include the potential for a bearish reversal off the 1st resistance level and a move towards the 1st support level.
The 1st support level at 1889.422 is identified as an overlap support, suggesting its significance in providing potential price stability. The 2nd support level at 1863.363 also acts as an overlap support that aligns with the 78.6% Fibonacci Retracement.
On the upside, the 1st resistance level at 1913.735 represents an overlap resistance that aligns with the 23.6% Fibonacci Retracement. Furthermore, the 2nd resistance level at 1932.113 is classified as an overla resistance that aligns with the 50.0% Fibonacci Retracement.


