
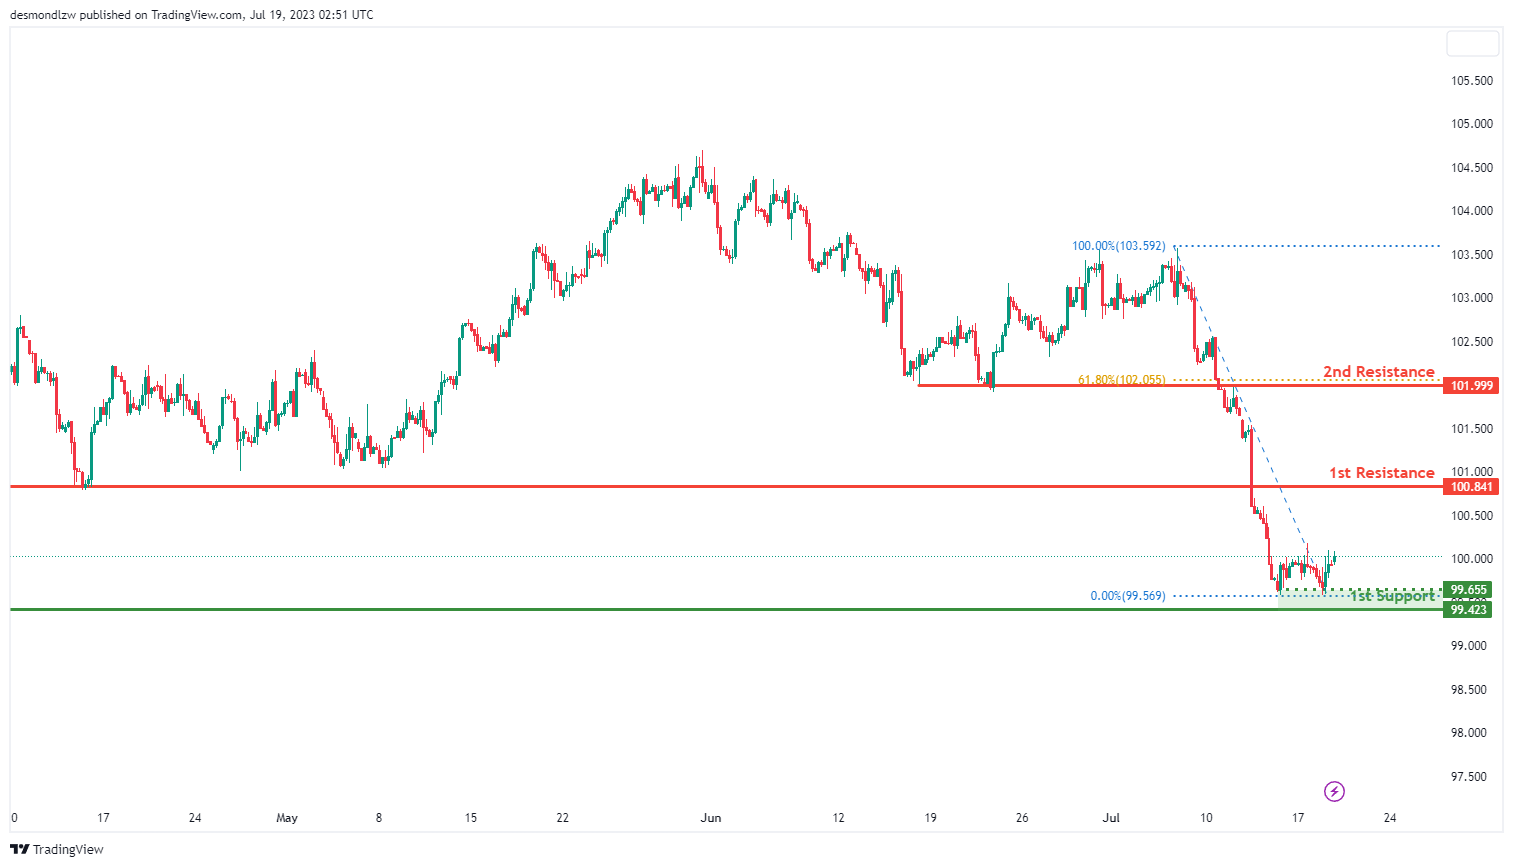
DXY:
The dollar index (DXY) chart is currently exhibiting a bullish momentum, suggesting that the price could potentially make a bullish continuation towards the 1st resistance.
The intermediate support level is at 99.66 and is identified as a multi-swing low support. This level may halt any short-term downtrend.
The 1st support level is found at 99.42, recognized as an overlap support. This could potentially provide a rebound point in case of a further downward move.
If the price maintains its bullish trajectory, it could face resistance at 100.84, which is considered an overlap resistance. This might pose a challenge to the upward price movement.
A further rise in price might meet the 2nd resistance at 101.99. This level is considered an overlap resistance and also aligns with the 61.80% Fibonacci retracement level, adding to its significance as a potential turning point.
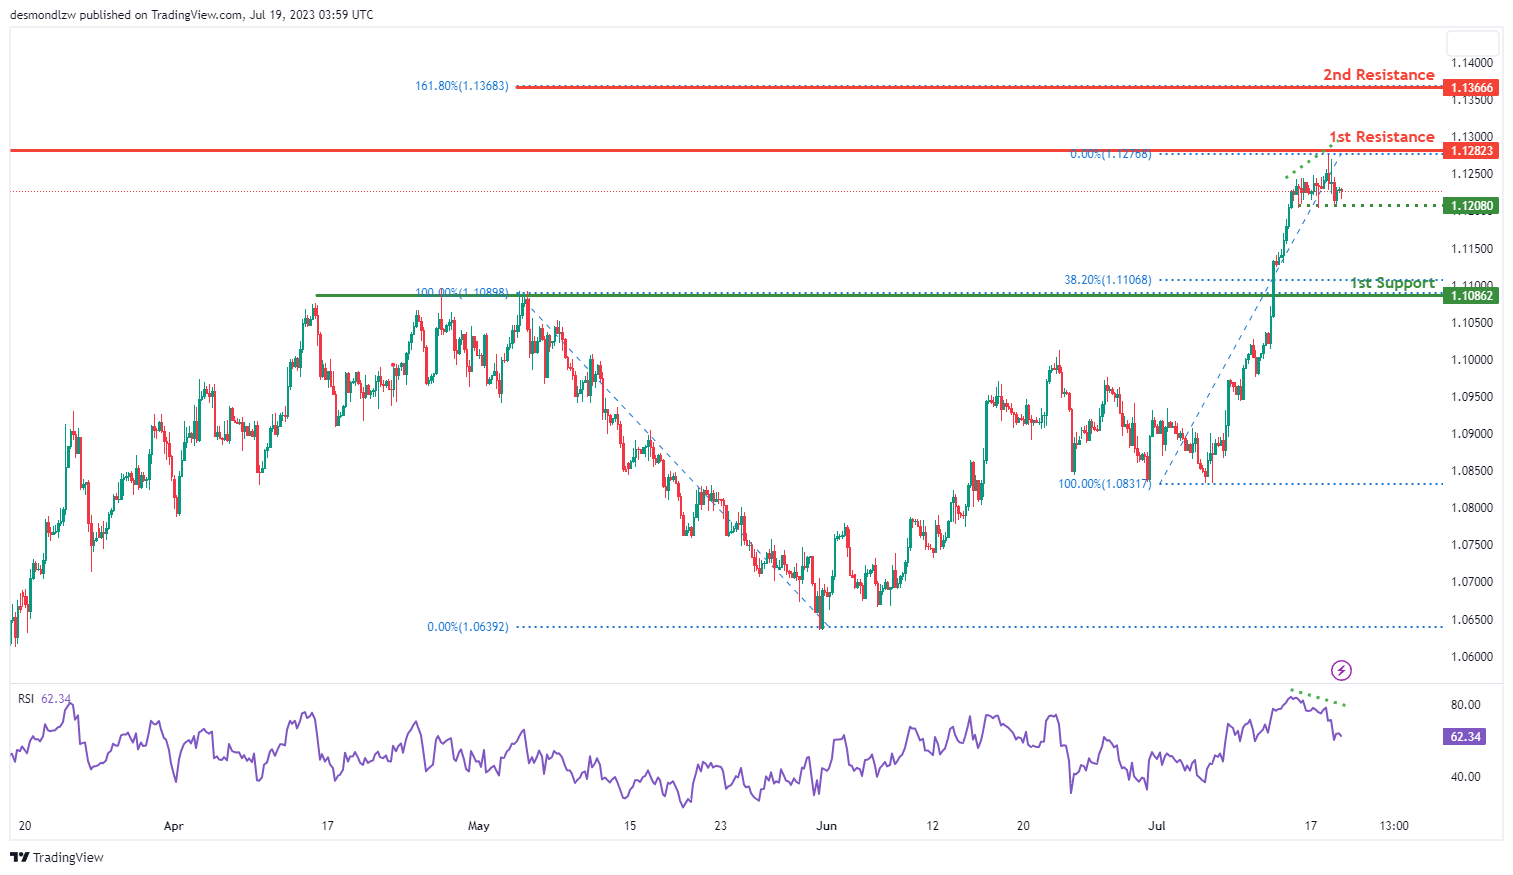
EUR/USD:
The EUR/USD chart currently demonstrates bearish momentum, indicating a potential continuation of the downward movement. There is a possibility for a bearish reaction off the 1st resistance level, leading to a drop towards the 1st support.
The 1st support at 1.1088 is considered a pullback support and coincides with the 38.20% Fibonacci Retracement level. Additionally, there is an intermediate support at 1.1208, which serves as a multi-swing low support.
On the upside, the 1st resistance level at 1.1282 is identified as an overlap resistance. Furthermore, the 2nd resistance at 1.1366 aligns with the 161.80% Fibonacci Retracement level.
Additionally, the RSI is displaying bearish divergence versus the price, indicating a likelihood of a rapid decline in price
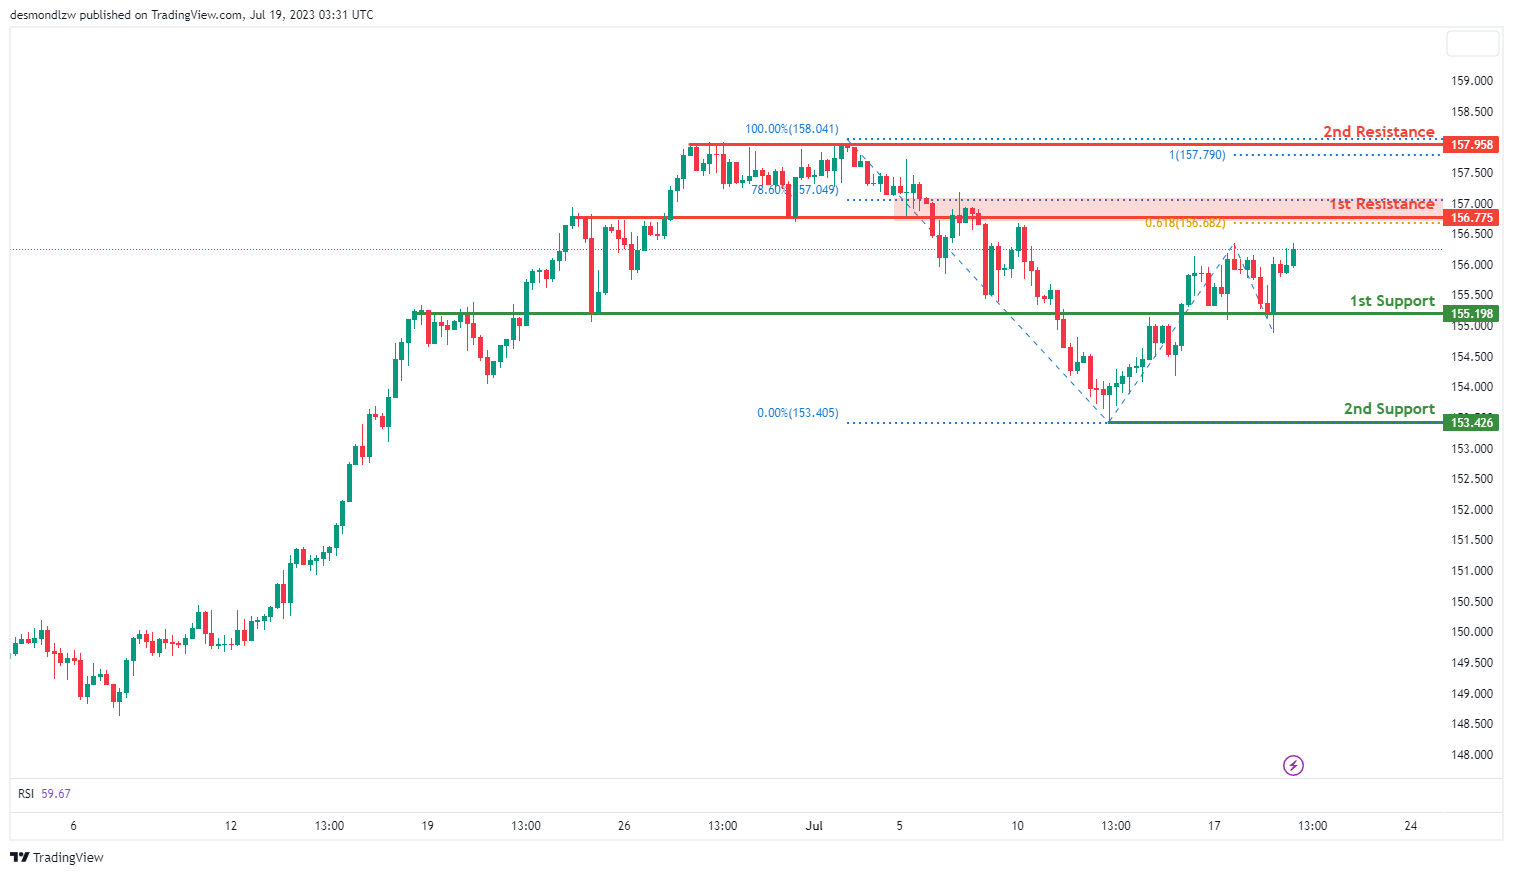
EUR/JPY:
The EUR/JPY chart currently shows a bullish overall momentum, indicating a potential for a bullish continuation towards the 1st resistance level.
The 1st support level at 155.19 is identified as an overlap support, suggesting a level where buyers may enter the market and provide support to the price. Additionally, the 2nd support level at 153.42 acts as a swing low support, further reinforcing its significance.
On the upside, the 1st resistance level at 156.77 represents a swing high resistance, indicating a level where selling pressure may increase. This resistance level also aligns with a 61.80% Fibonacci Projection and a 78.60% Fibonacci Retracement, indicating Fibonacci confluence and adding to its significance.
Furthermore, the 2nd resistance level at 157.95 is identified as a multi-swing high resistance, and it coincides with a 100% Fibonacci Projection, further reinforcing its potential as a significant barrier to further price advancement.
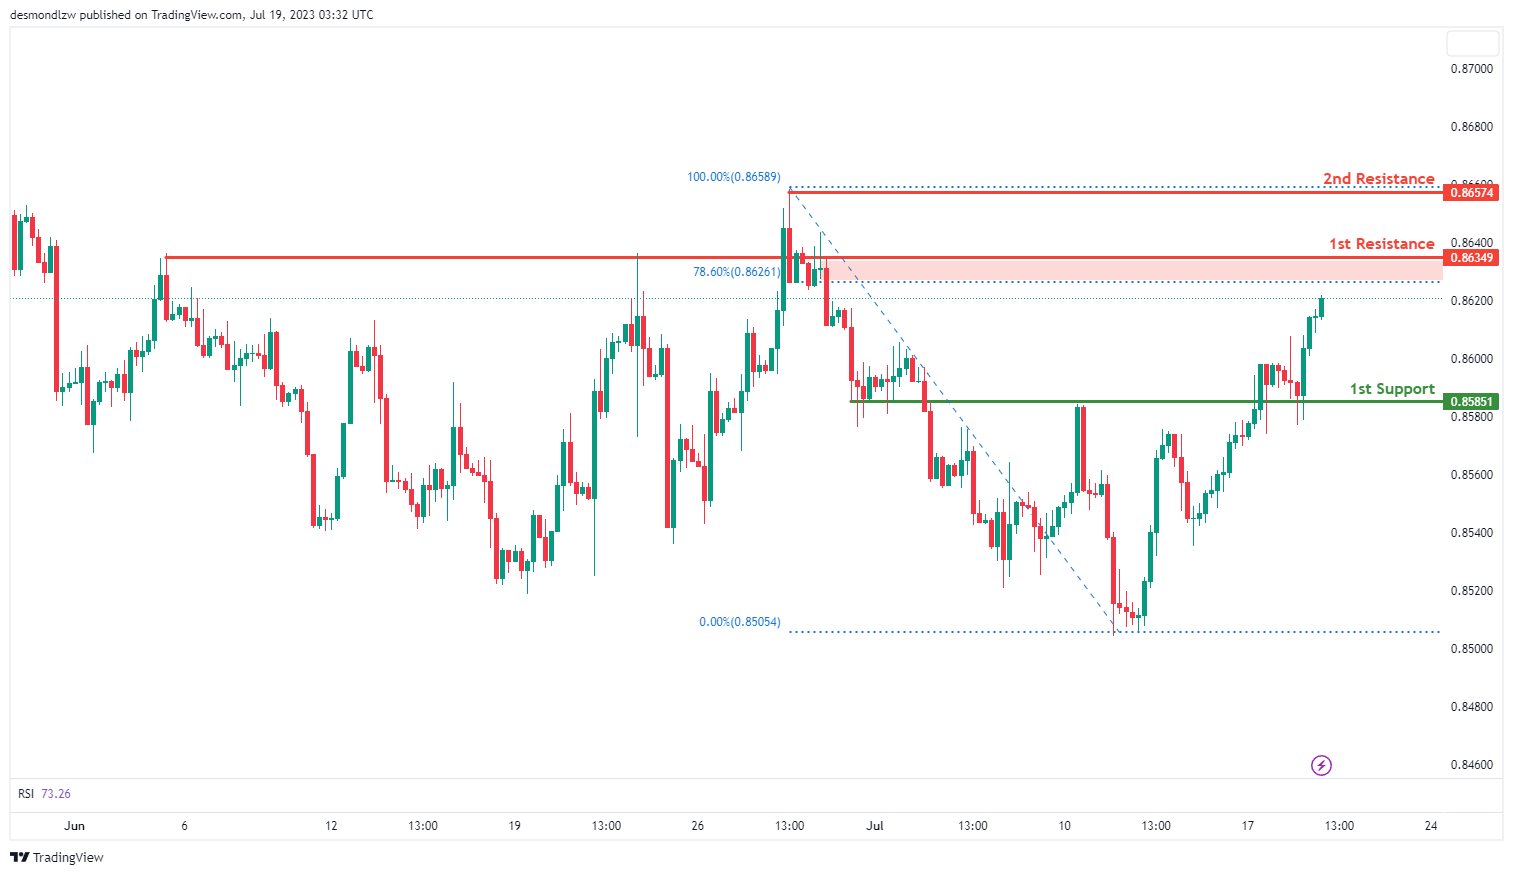
EUR/GBP:
The EUR/GBP chart currently displays a bullish overall momentum, suggesting a potential for a bullish continuation towards the 1st resistance level.
The 1st support level at 0.8585 is identified as an overlap support, indicating a level where buyers may enter the market and provide support to the price.
On the upside, the 1st resistance level at 0.8634 represents an overlap resistance. Additionally, this resistance level aligns with a 78.60% Fibonacci Retracement, further reinforcing its significance as a potential barrier to further price advancement.
Furthermore, the 2nd resistance level at 0.8657 is identified as a swing high resistance, indicating a level where selling pressure may increase, potentially adding to the resistance.
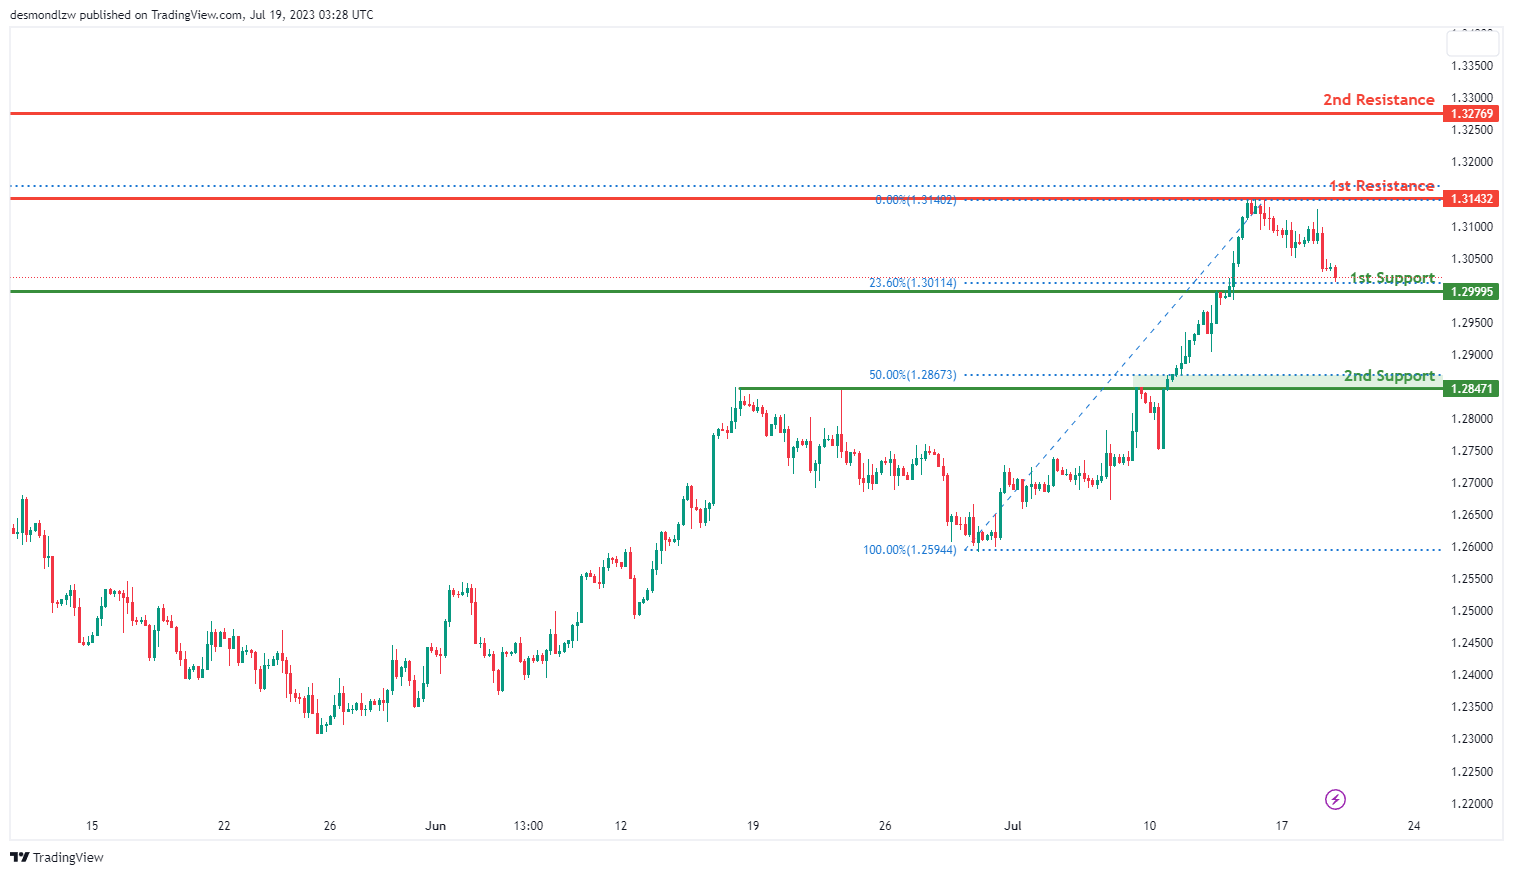
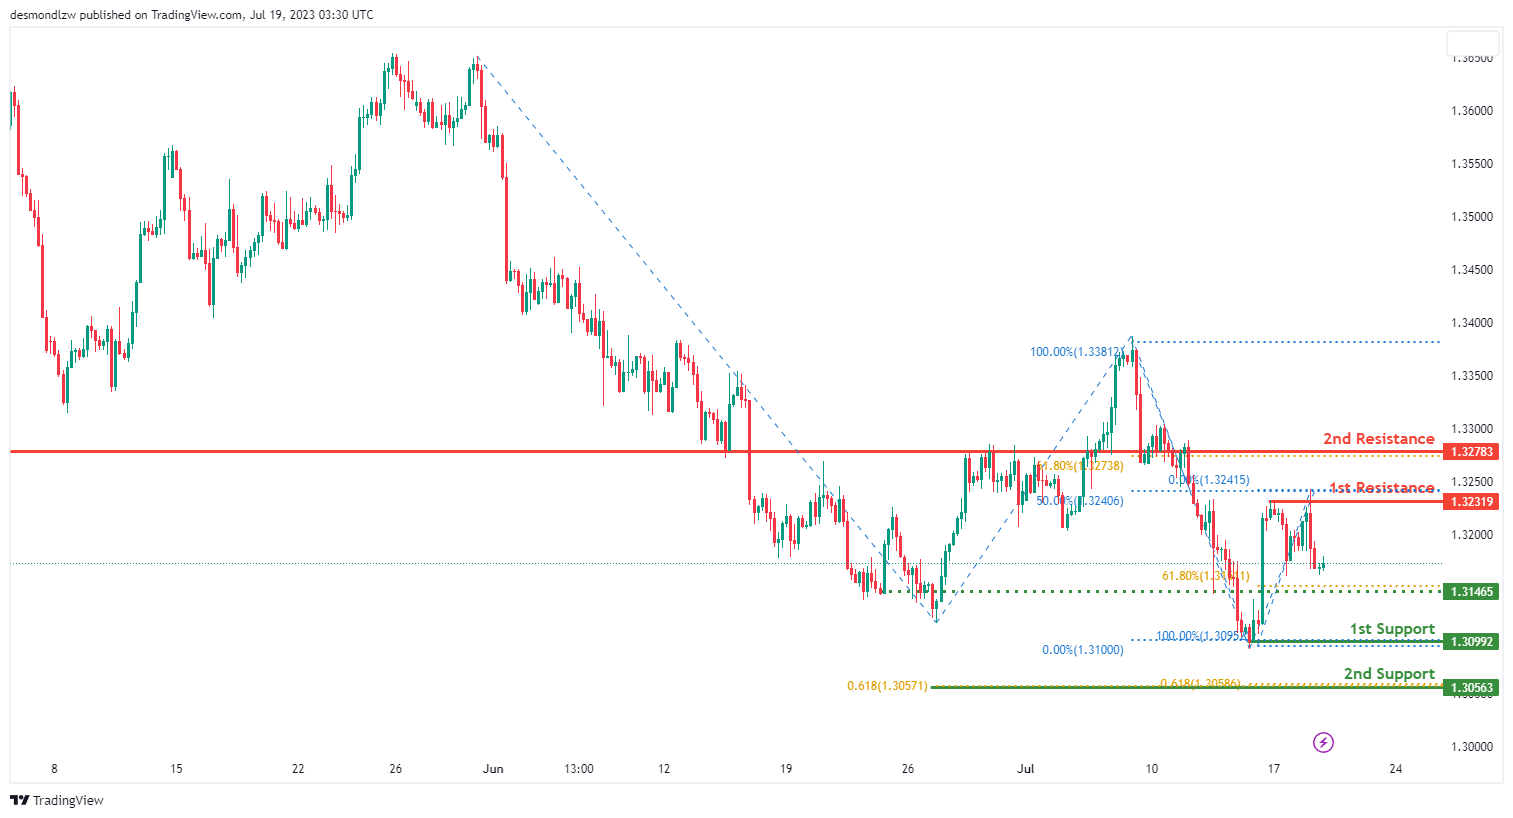
GBP/USD:
The GBP/USD chart is currently showing bearish momentum, suggesting that the price could continue to fall towards the 1st support level.
The 1st support level is at 1.2999, identified as an overlap support and coincides with the 23.60% Fibonacci retracement level. This level might act as a significant barrier to further price decline.
If the price falls even further, it could meet the 2nd support level at 1.2847, also characterized as an overlap support and aligns with the 50% Fibonacci retracement level. This support level could be a crucial area where buying pressure may outweigh selling pressure, leading to a potential price increase.
However, if the price reverses its bearish trend, it could face resistance at 1.3143, identified as an overlap resistance. A further bullish move could meet resistance at the 2nd level of 1.3277, also an overlap resistance. These resistance levels might hinder upward price movement and could trigger a selling response.
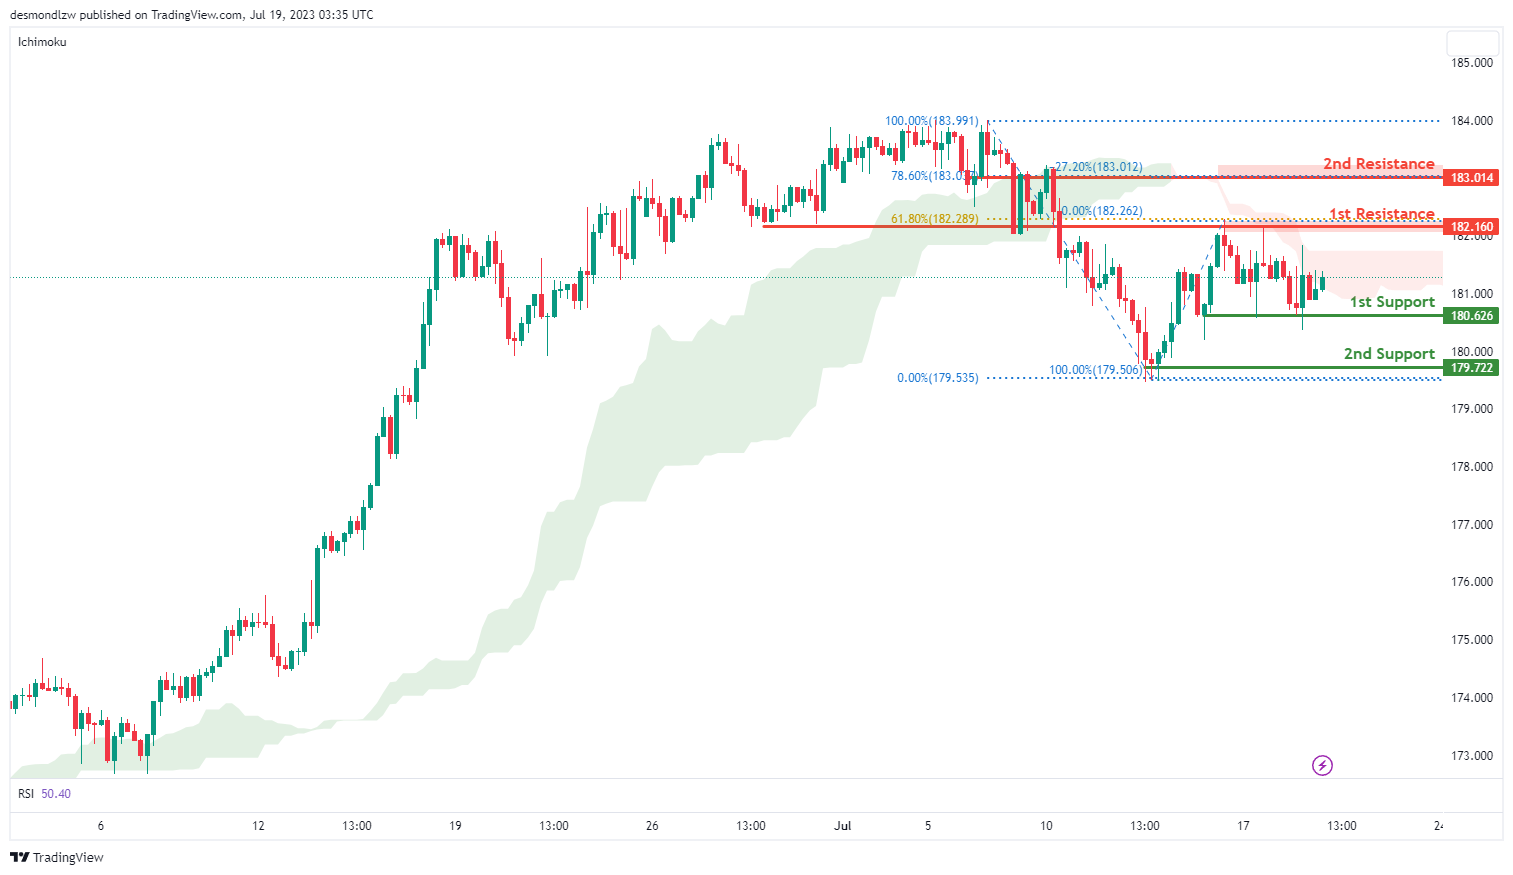
GBP/JPY:
The GBP/JPY chart demonstrates a bearish overall momentum, supported by the fact that the price is below the bearish Ichimoku cloud. This suggests a potential for a bearish continuation towards the 1st support level.
The 1st support at 180.16 is identified as a multi-swing low support, indicating a level where buyers may enter the market and provide support to the price. Additionally, the 2nd support at 179.72 is a swing low support, further reinforcing its significance as a potential level where buying interest could emerge.
On the upside, the 1st resistance at 182.16 represents an overlap resistance and aligns with a 61.80% Fibonacci Retracement. This level may act as a barrier to further price advancement.
Furthermore, the 2nd resistance at 183.01 is identified as an overlap resistance. It also coincides with a 78.60% Fibonacci Retracement and a -27% Fibonacci Expansion, indicating a potential Fibonacci confluence that may add to the resistance.
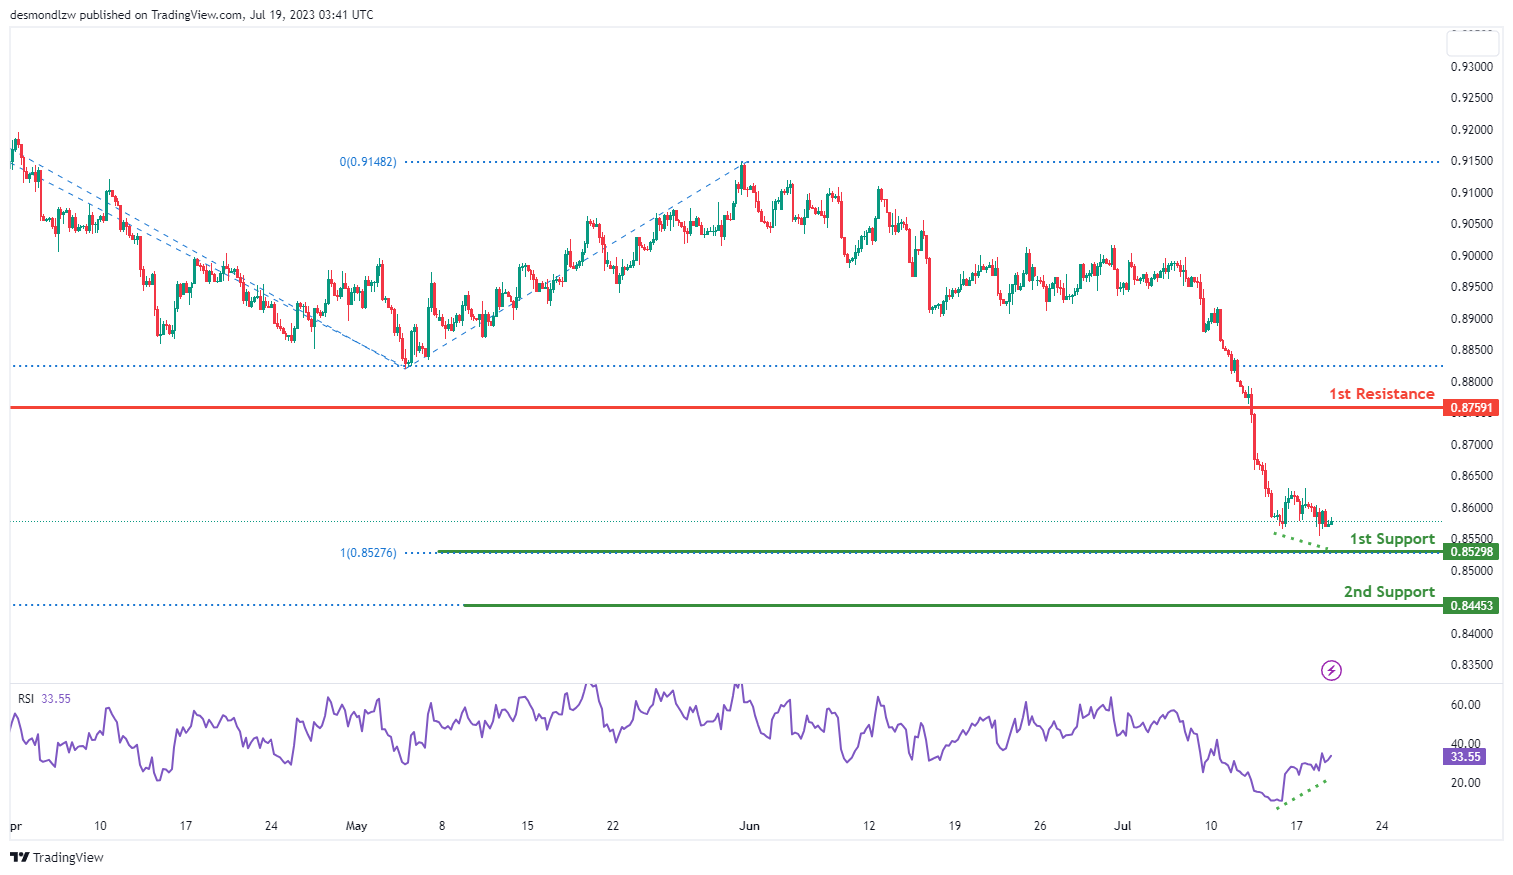
USD/CHF:
The USD/CHF chart currently indicates a bullish momentum, suggesting a potential for a bullish bounce off the 1st support level and a subsequent move towards the 1st resistance.
The 1st support level at 0.8529 is noteworthy as it aligns with a 100% Fibonacci Projection. This confluence of factors increases the significance of this support level.
Additionally, the 2nd support at 0.8445 is identified as a level that corresponds to a -61.8% Fibonacci Expansion, providing further potential support.
On the upside, the 1st resistance at 0.8759 is classified as a pullback resistance. This resistance level may present a barrier to further price advancement.
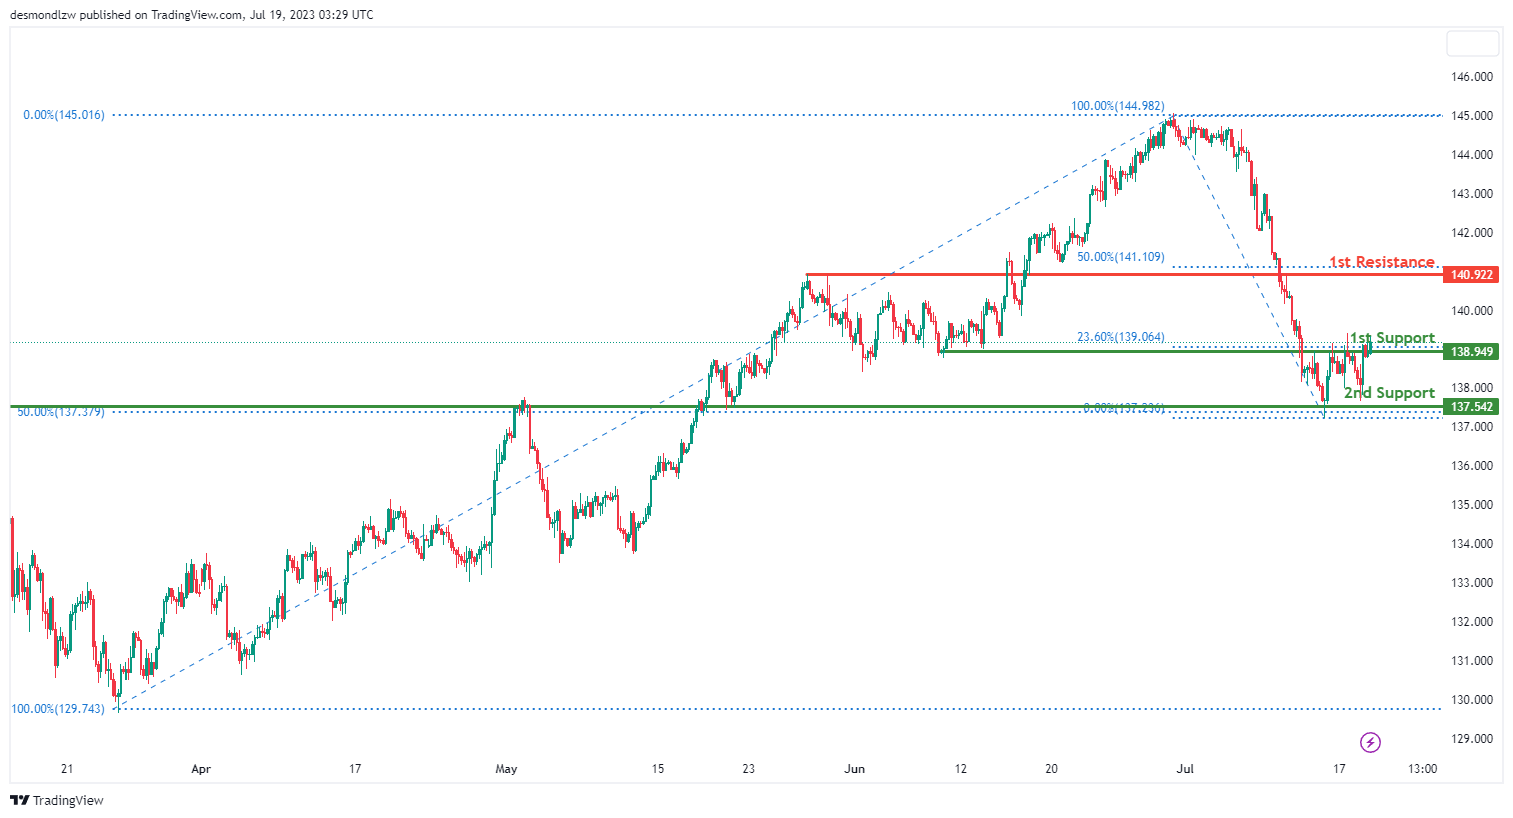
USD/JPY:
The USD/JPY chart is bullish, indicating a potential continuation of the upward trend towards the 1st resistance level.
At the downside, the 1st support level at 138.95 serves as an overlap support, while the 2nd support level at 137.54 also acts as an overlap support. These levels have the potential to attract buying interest and initiate a rebound.
On the other hand, if the bullish momentum persists, the price may encounter resistance at the 1st resistance level of 140.92. This level coincides with the 50% Fibonacci retracement and is considered an overlap resistance. It may impede further upward movement and trigger selling activity.
USD/CAD:
The USD/CAD pair is currently displaying neutral momentum, suggesting price fluctuations between the 1st resistance and 1st support levels.
The 1st support level at 1.3099, a swing low support, could potentially halt any downward movement. If the price drops further, the 2nd support level at 1.3056, marked by a Fibonacci confluence at the 61.80% projection, could provide a strong barrier against further decline.
If the price reverses and climbs, it may encounter resistance at 1.3232, a multi-swing high resistance and the 50% Fibonacci retracement level. A further ascent could meet the 2nd resistance level at 1.3278, a pullback resistance aligning with the 61.8% Fibonacci projection.
Additionally, there’s an intermediate support at 1.3147, a pullback support coinciding with the 61.80% Fibonacci retracement, which could serve as a potential rebound point in a bearish scenario.
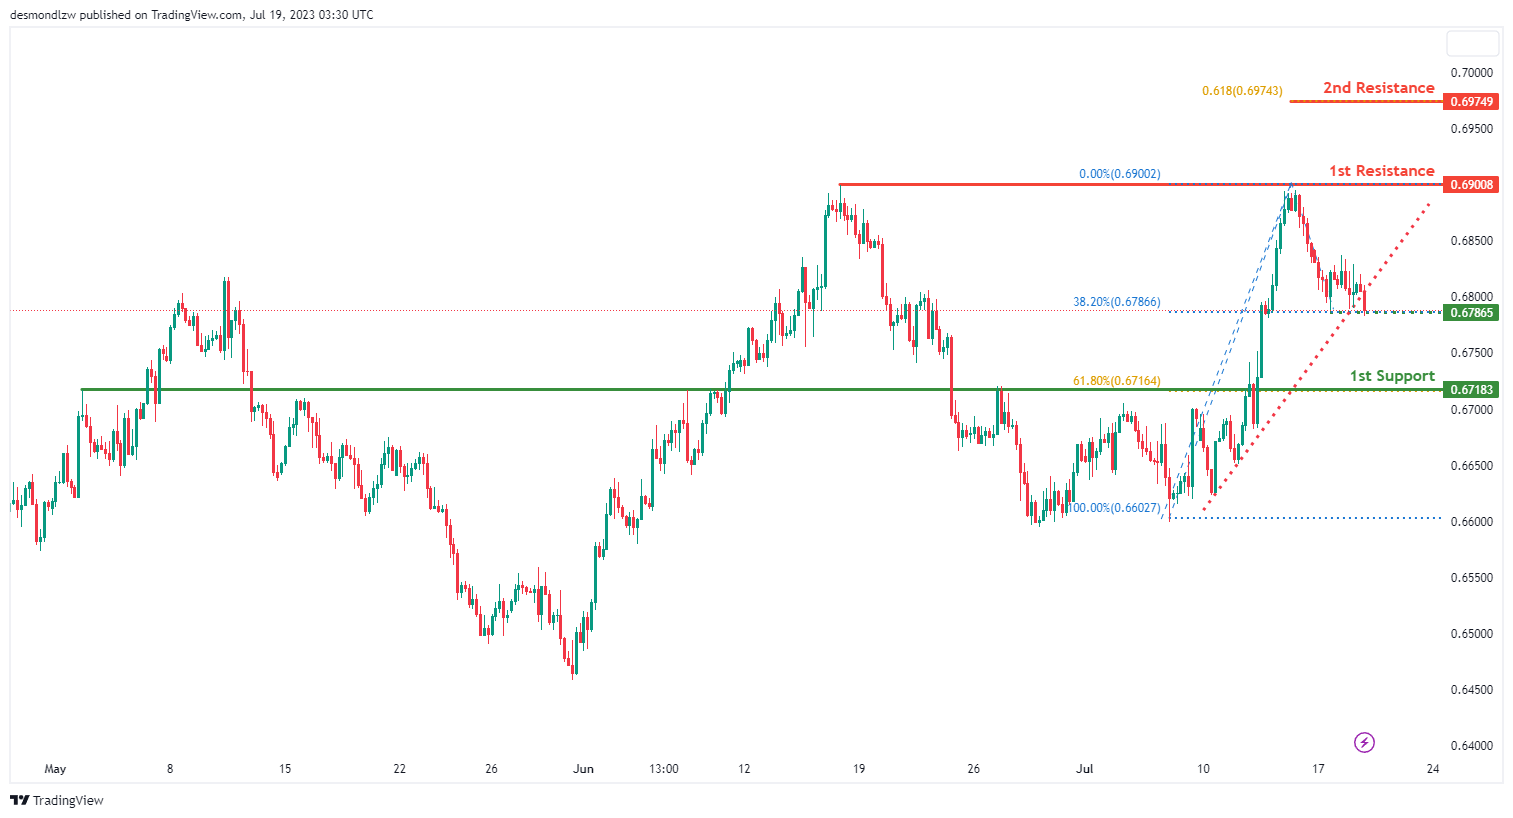
AUD/USD:
The AUD/USD pair is currently exhibiting bearish momentum after breaking below an ascending support line, which could suggest a continuation of this downward trend towards the 1st support level.
The intermediate support level is at 0.6787, serving as an overlap support and coinciding with the 38.20% Fibonacci retracement level. This level could potentially halt further price decline. If the price drops beyond this point, the 1st support level at 0.6718, also an overlap support, aligns with the 61.80% Fibonacci retracement level and may offer another potential rebound point.
On the contrary, if the price manages to reverse its bearish momentum, it could face resistance at 0.6901, identified as an overlap resistance. Further upward movement may encounter the 2nd resistance level at 0.6975, which is another overlap resistance and coincides with the 61.80% Fibonacci projection. These resistance levels could hinder the price’s progress and potentially stimulate a selling response.
NZD/USD
The NZD/USD chart currently exhibits a bullish overall momentum. The price is above a major ascending trend line, indicating the potential for further bullish movement.
There is a possibility for a bullish bounce off the 1st support level at 0.625, which is considered a pullback support and coincides with the 50% Fibonacci Retracement level. Additionally, the 2nd support level at 0.611 acts as an overlap support and aligns with the 78.60% Fibonacci Retracement level.
On the upside, the 1st resistance level at 0.630 represents an overlap resistance. If the price breaks above this level, the next hurdle could be the 2nd resistance level at 0.641, which is identified as a swing high resistance.
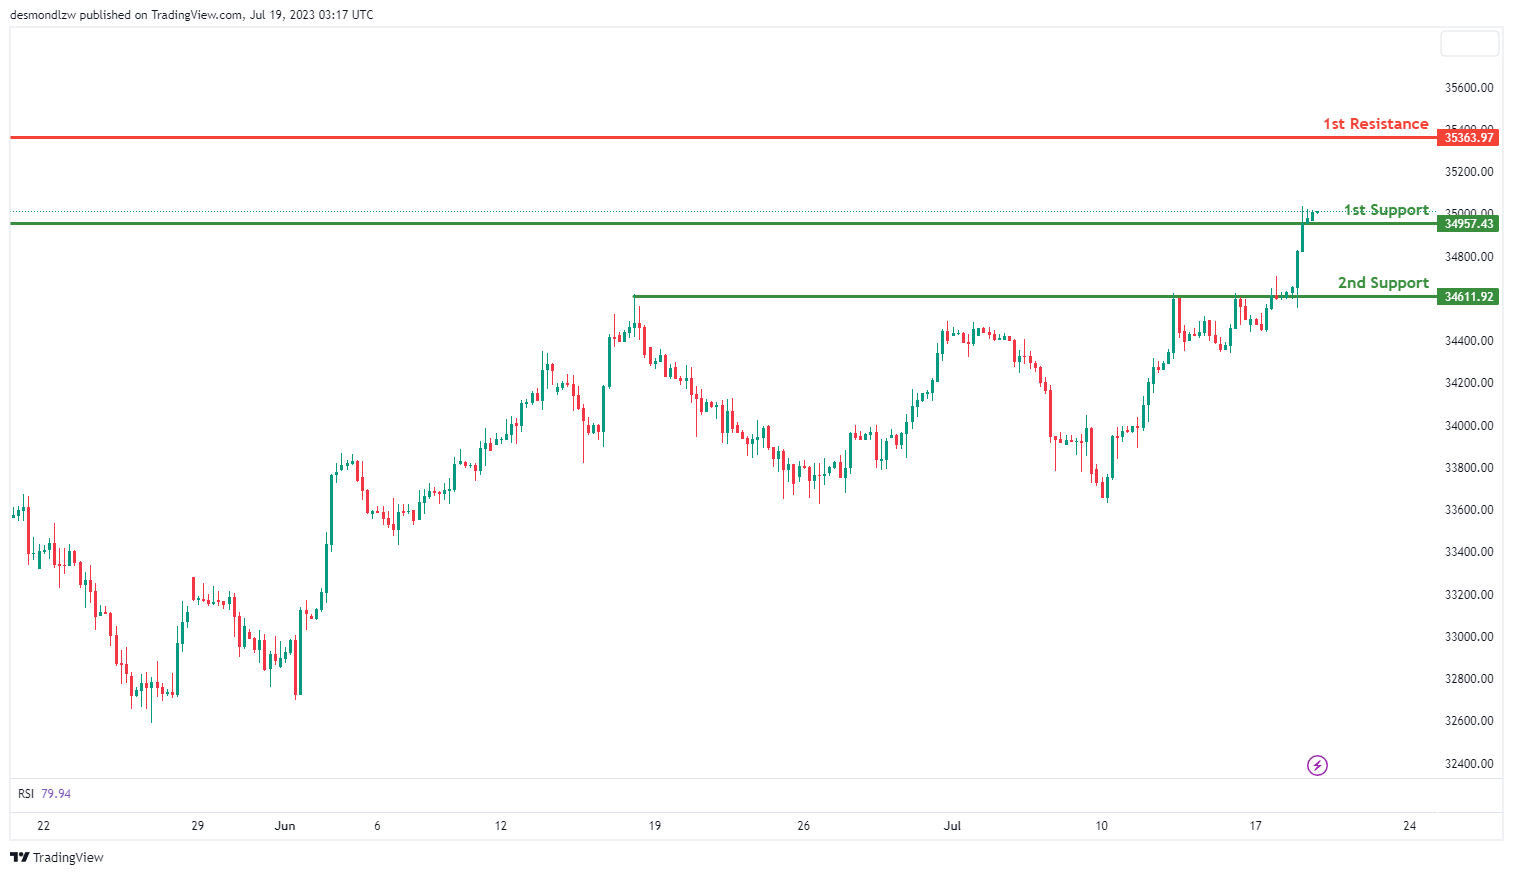
DJ30:
The DJ30 (Dow Jones Industrial Average) chart indicates a bullish overall momentum, suggesting the potential for a bullish bounce off the 1st support level and a subsequent move towards the 1st resistance level.
The 1st support level at 34957.43 is identified as a pullback support, potentially providing a bounce for the price. Additionally, the 2nd support at 34611.92 acts as an overlap support, further reinforcing its significance.
On the upside, the 1st resistance level at 35363.97 represents an overlap resistance, potentially posing a challenge for the price’s upward movement.
GER30:
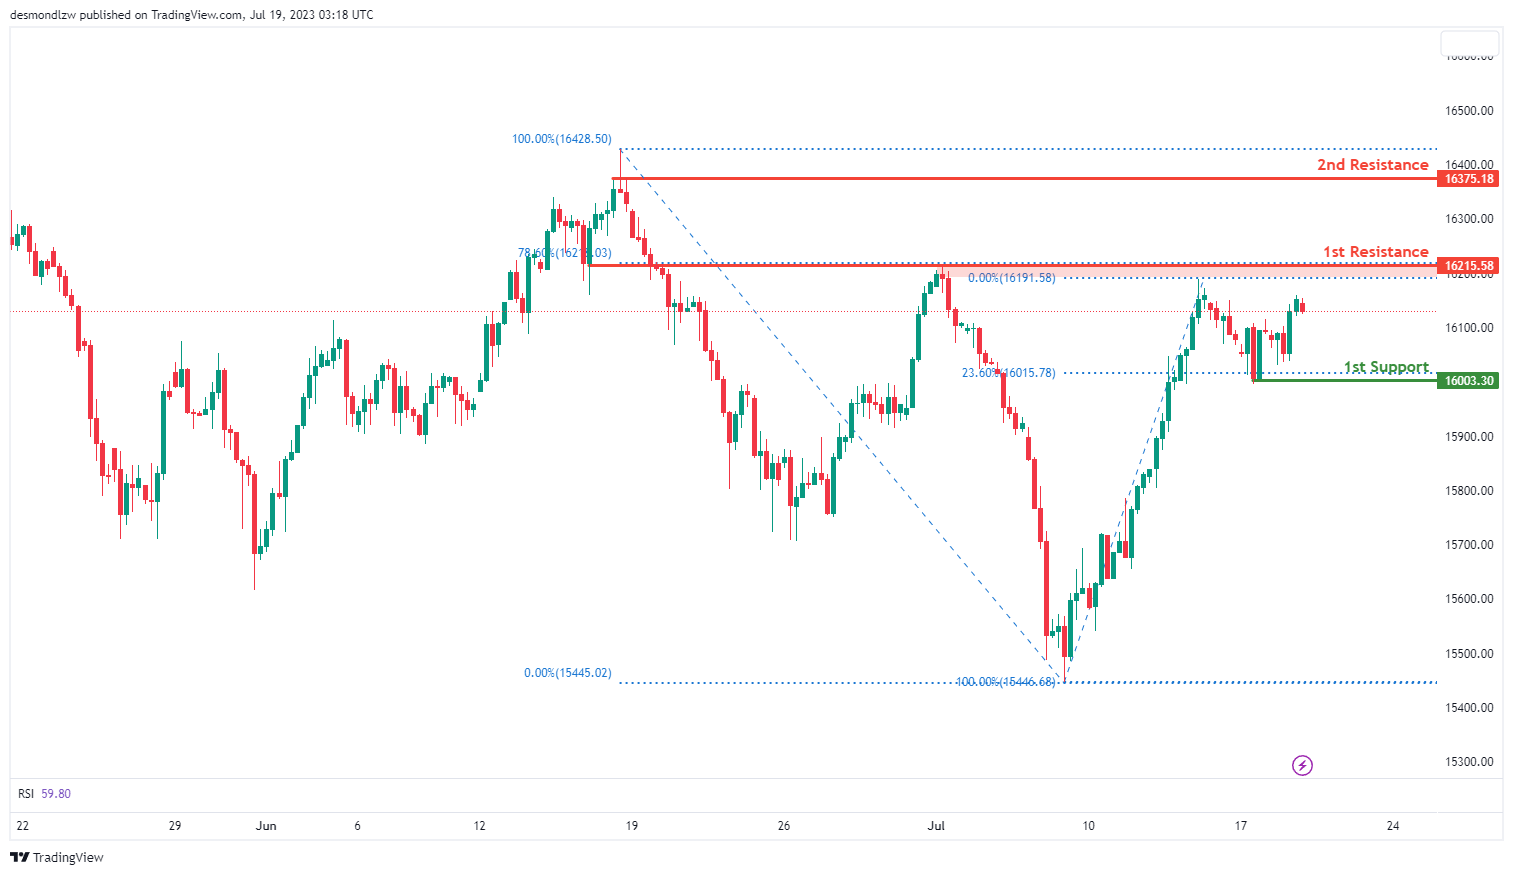
The GER30 (DAX) chart indicates a bullish overall momentum, suggesting the potential for a bullish continuation towards the 1st resistance level.
The 1st support level at 16003.30 is identified as a swing low support, and it coincides with a 23.60% Fibonacci retracement level, providing a strong foundation for potential price support.
On the upside, the 1st resistance level at 16215.58 represents an overlap resistance and aligns with a 78.60% Fibonacci retracement level. This level is expected to pose a significant barrier to further price advancement. Furthermore, the 2nd resistance level at 16375.18 acts as a swing high resistance, further strengthening the potential resistance zone.
US500
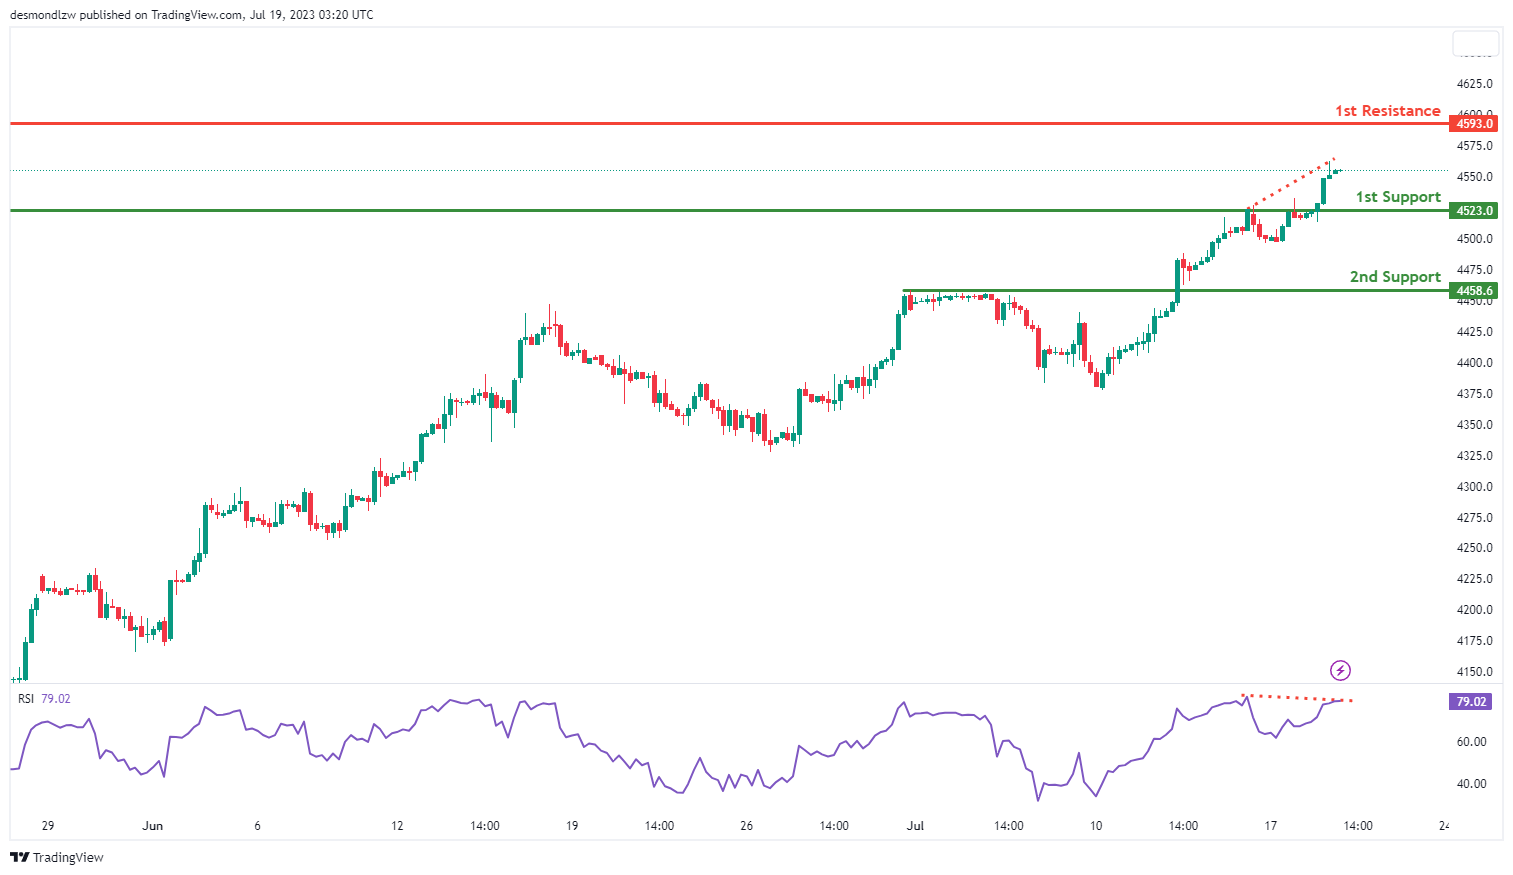
The US500 (S&P 500) chart currently exhibits a bearish overall momentum, suggesting a potential rise towards the 1st resistance level in the short term before reversing off it and dropping towards the 1st support level.
The 1st support level at 4523.0 is identified as a pullback support, indicating a level where buyers may step in and provide price stability. Additionally, the 2nd support level at 4458.6 also acts as a pullback support, further reinforcing its significance.
On the upside, the 1st resistance level at 4593.0 represents a swing high resistance, indicating a level where selling pressure might intensify and potentially stall further upward movement.
Furthermore, the Relative Strength Index (RSI) is displaying bearish divergence versus price, suggesting that a reversal might occur soon. This could further support the bearish scenario.
BTC/USD:
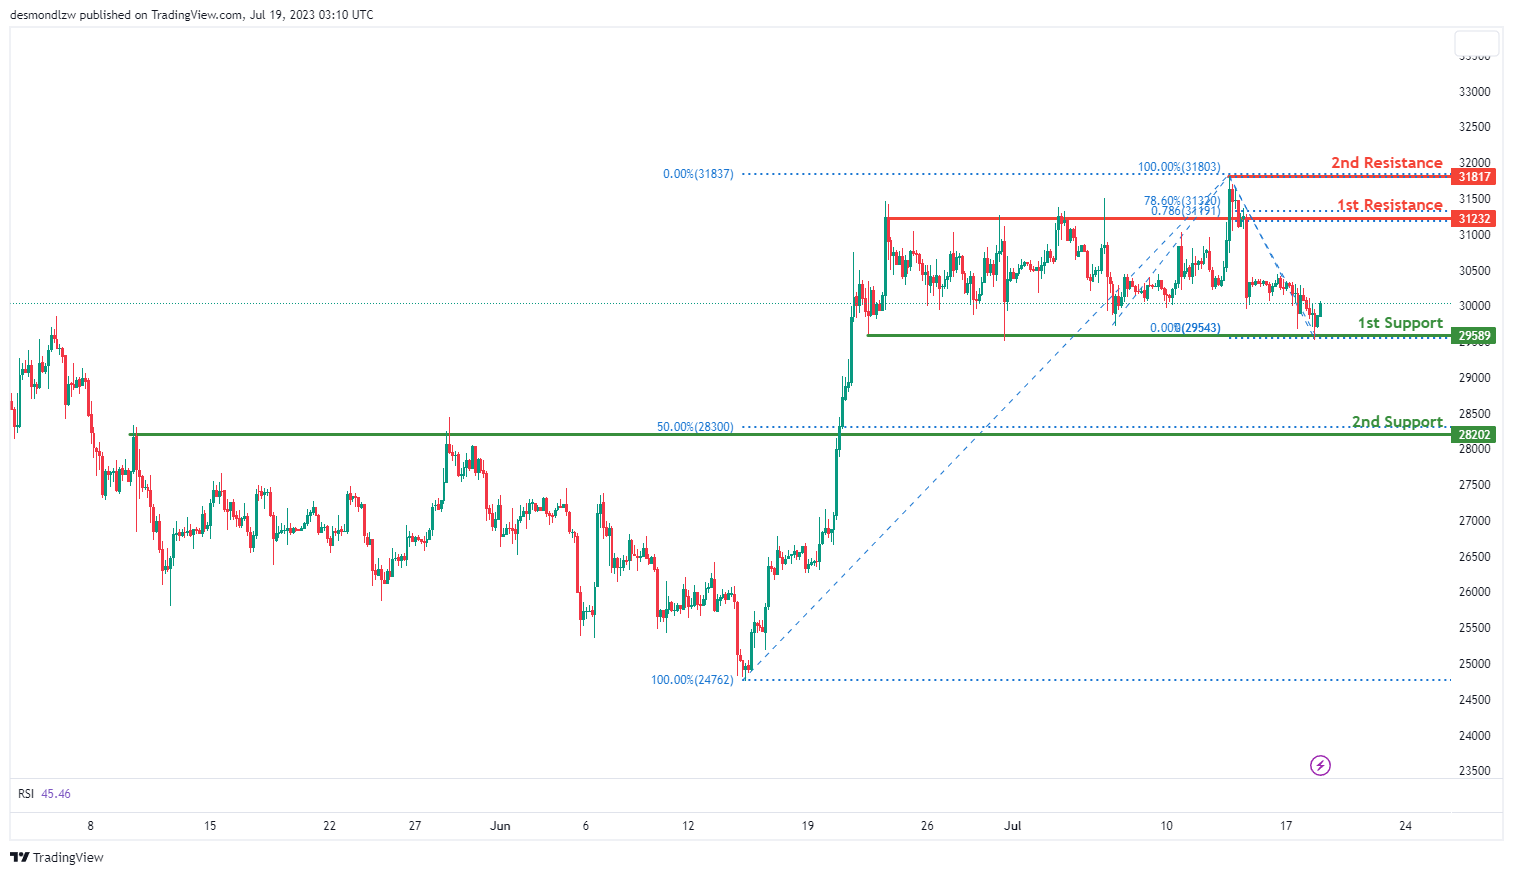
The BTC/USD chart currently exhibits a bullish trend, with the potential for a bullish bounce off the 1st support level at 29589, characterized by its multi-swing low support, and moving towards the 1st resistance.
The 2nd support level is located at 28202, offering a pullback support and aligning with the 50% Fibonacci retracement level, signifying its potential as a strong buying area.
On the upside, the 1st resistance level is identified at 31232. This level presents an overlap resistance and corresponds with the 78.60% Fibonacci retracement, suggesting it could act as a significant barrier to further price increases.
Further upward, the 2nd resistance level is set at 31817, recognized as a swing high resistance, indicating another point where the market could face selling pressure and potentially reverse.
ETH/USD:
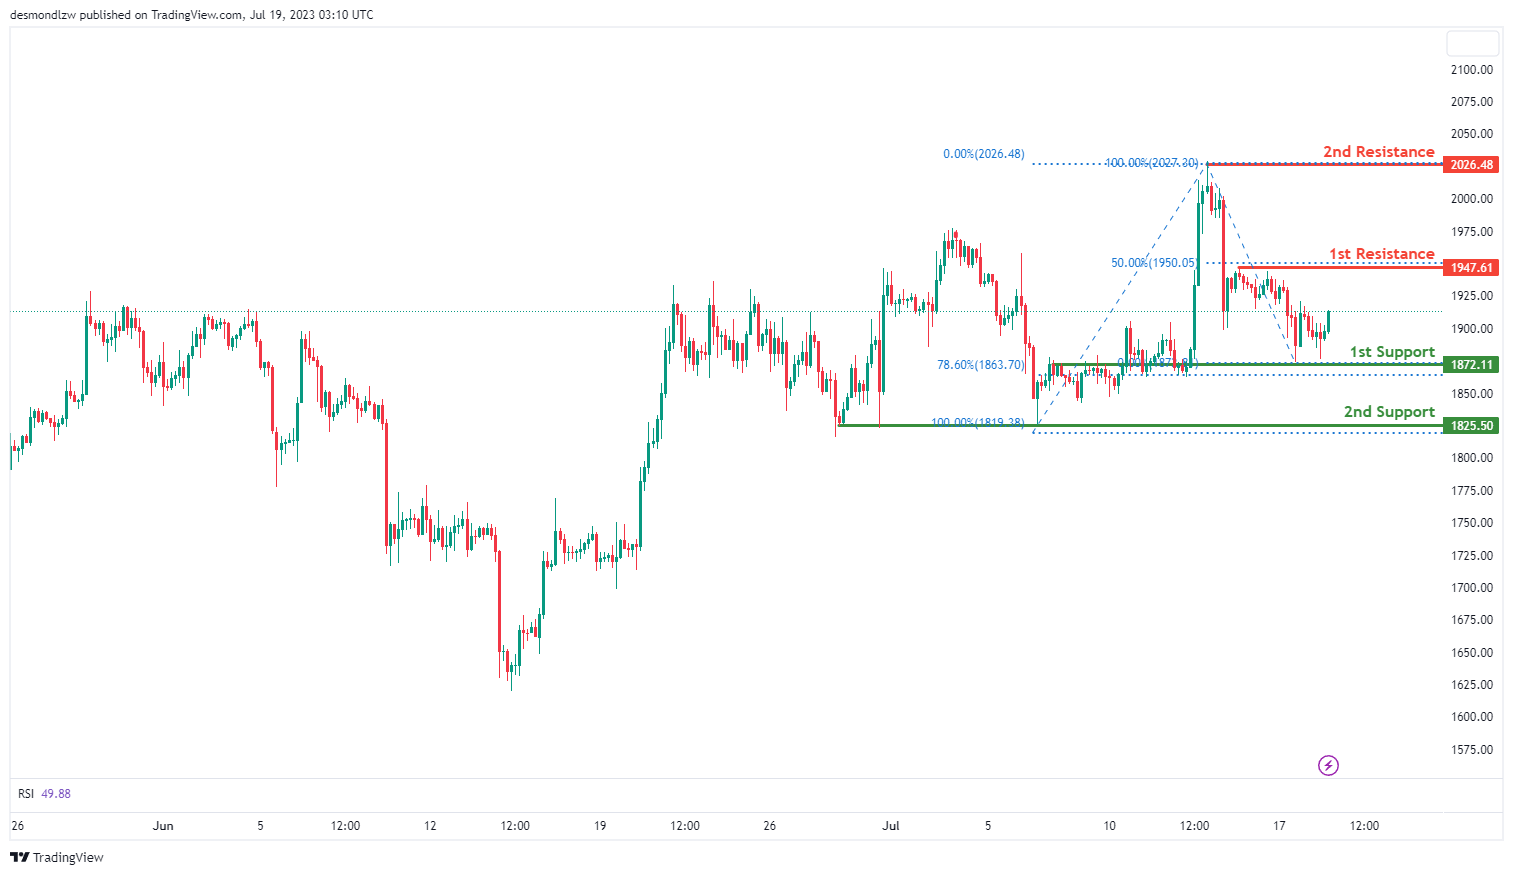
The ETH/USD chart demonstrates a bullish momentum, indicating the potential for a bullish continuation towards the 1st resistance level.
The 1st support level at 1872.11 is considered good due to its status as an overlap support and aligning with the 78.60% Fibonacci Retracement level. Additionally, the 2nd support at 1825.50 acts as a multi-swing low support.
On the upside, the 1st resistance level at 1947.61 represents a multi-swing high resistance and coincides with the 50% Fibonacci Retracement level. Furthermore, the 2nd resistance at 2026.48 is identified as a swing high resistance.
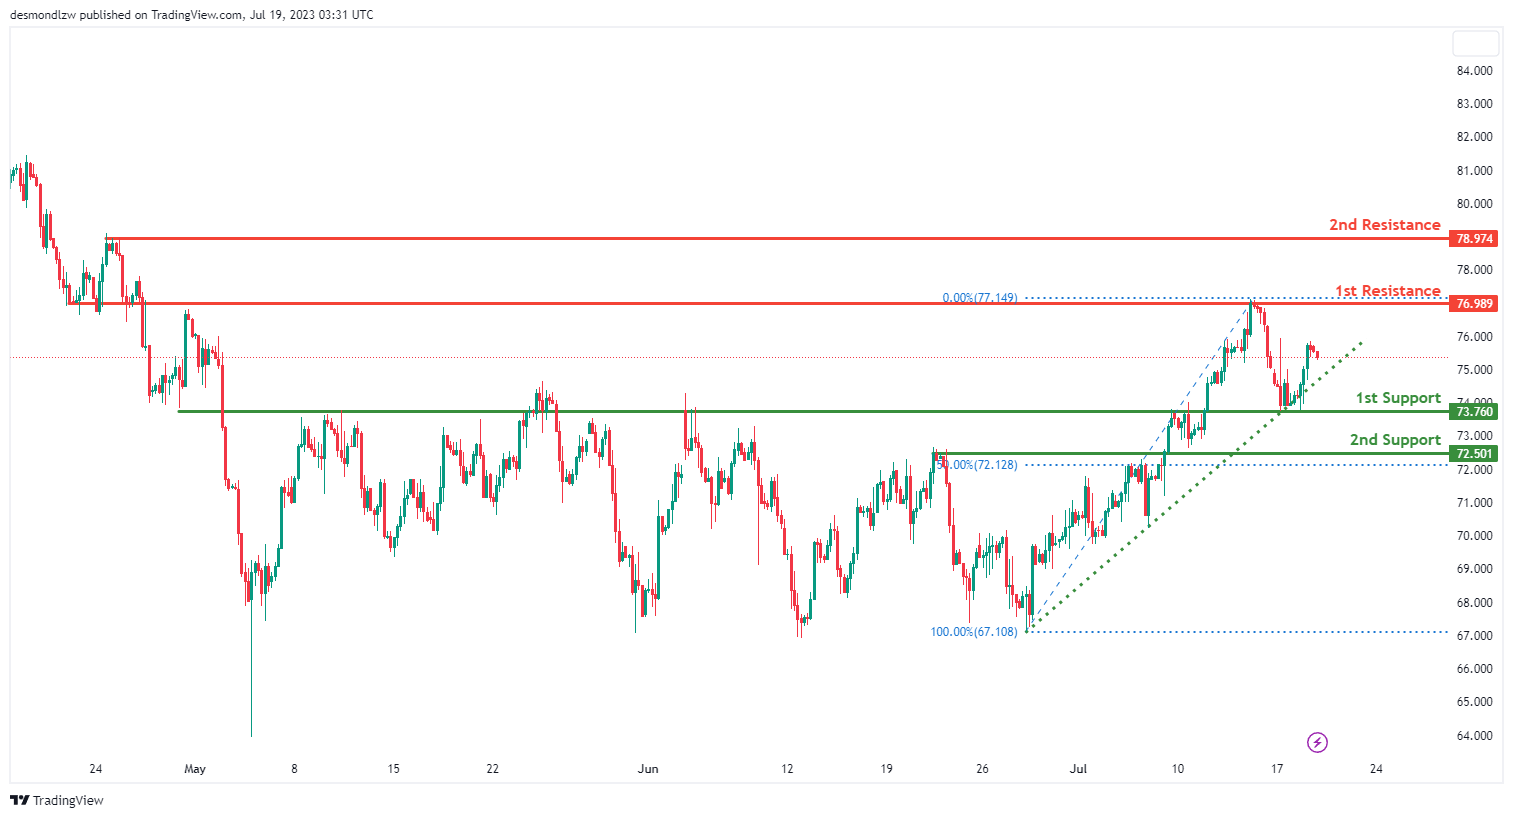
WTI/USD:
The WTI/USD chart currently shows a weak bullish momentum with low confidence. It is suggested that the price could potentially drop to the 1st support in the short term before bouncing back and rising towards the 1st resistance level.
The 1st support level is at 73.76, which has been identified as an overlap support. This could potentially provide a rebound point for the price in the event of a further decline.
The 2nd support level is at 72.50, recognized as an overlap support and also coincides with the 50% Fibonacci retracement level. This adds significance to the level as a potential barrier to further price declines.
On the flip side, if the price reverses its course and begins to climb, it may face resistance at 76.98, which is identified as an overlap resistance. This could potentially hinder the price’s upward movement.
A further rise in price might encounter the 2nd resistance at 78.97, another overlap resistance level. This level might act as a barrier to further upward movement.
XAU/USD (GOLD):
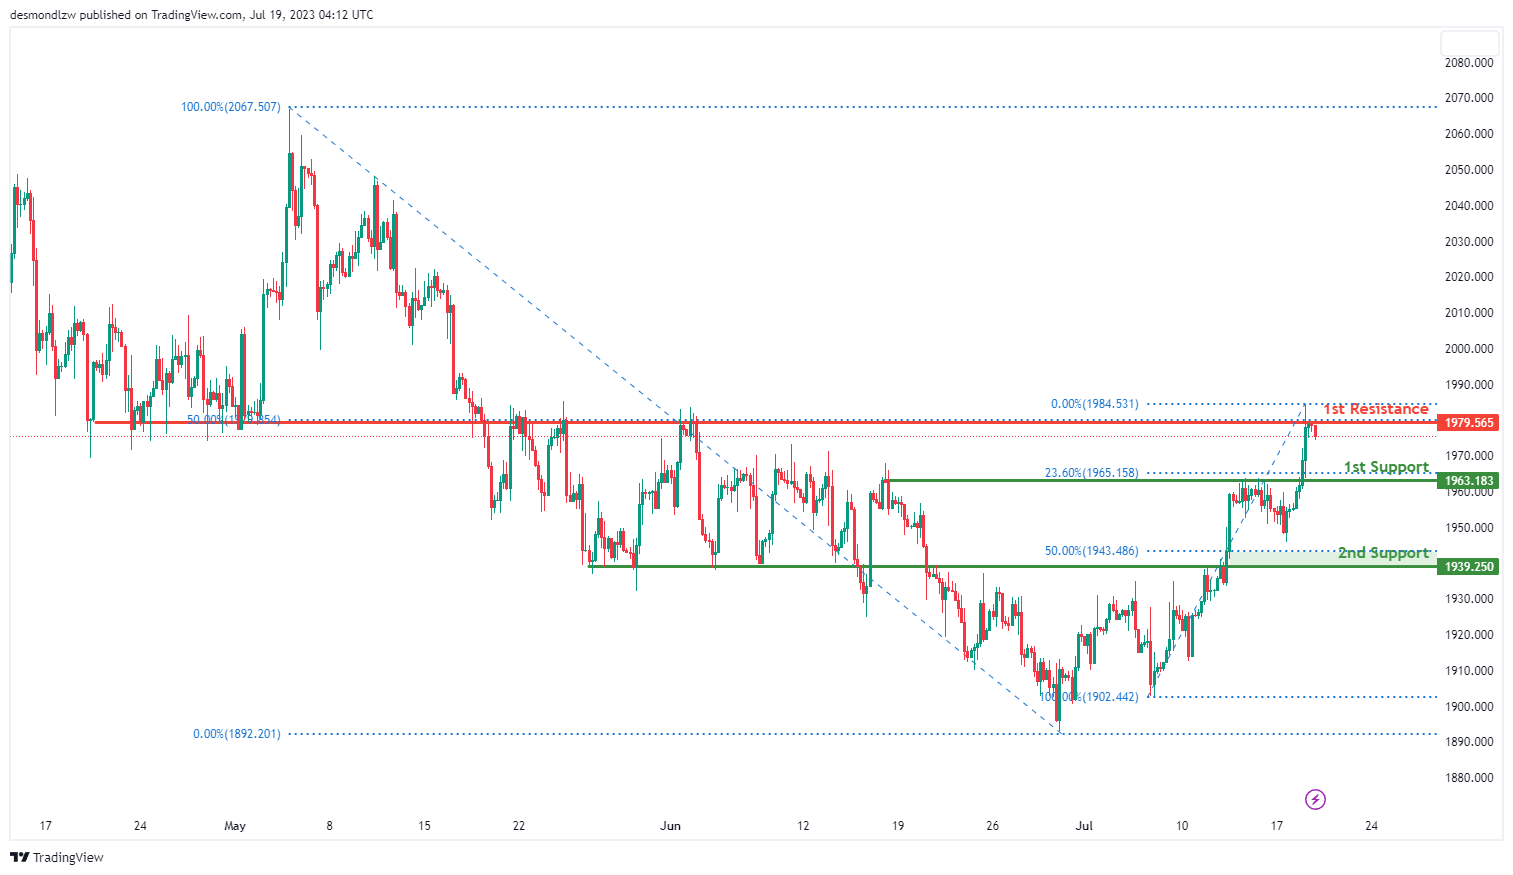
Gold (XAU/USD) currently shows a bearish momentum, suggesting that the price could potentially continue its downward trend towards the 1st support level.
The 1st support level is at 1963.18, recognized as an overlap support and coinciding with the 23.60% Fibonacci retracement level. This could provide a bounce back point for the price if it continues to decline.
The 2nd support level is at 1939.25, identified as an overlap support and also coinciding with the 50% Fibonacci retracement level. This further reinforces the level as a significant potential barrier against further price declines.
On the other hand, if the price reverses its course and begins to climb, it could face resistance at 1979.57. This level is identified as an overlap resistance and also aligns with the 50% Fibonacci retracement level, which could potentially hinder the price’s upward movement.


