
DXY:
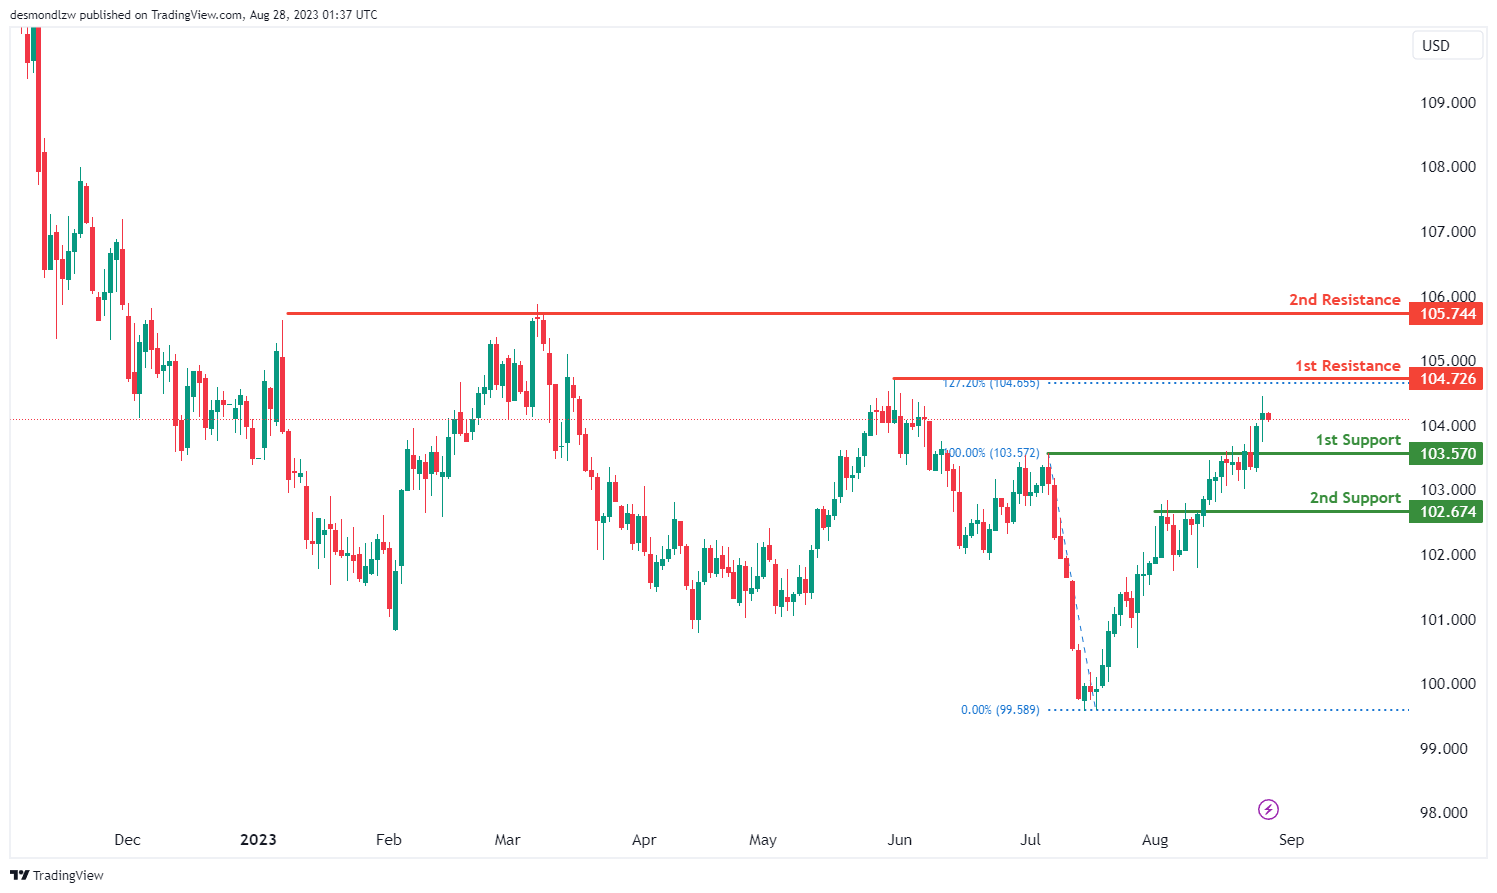
The DXY (U.S. Dollar Index) chart currently exhibits a bullish momentum. This suggests the possibility that the price could continue its bullish trajectory, aiming towards the first resistance level.
The first support for the price is located at 103.57, acting as a pullback support. This level is expected to serve as a significant safety net for any short-term pullbacks. The 2nd support is at 102.67, which also holds the characterization of a pullback support.
On the potential barrier front, the first resistance is set at 104.72. What accentuates its significance is its confluence with the 127.20% Fibonacci Extension, cementing its position as a swing high resistance. The 2nd resistance is found at 105.74, marking another critical threshold in the potential upward journey of the DXY.
EUR/USD:
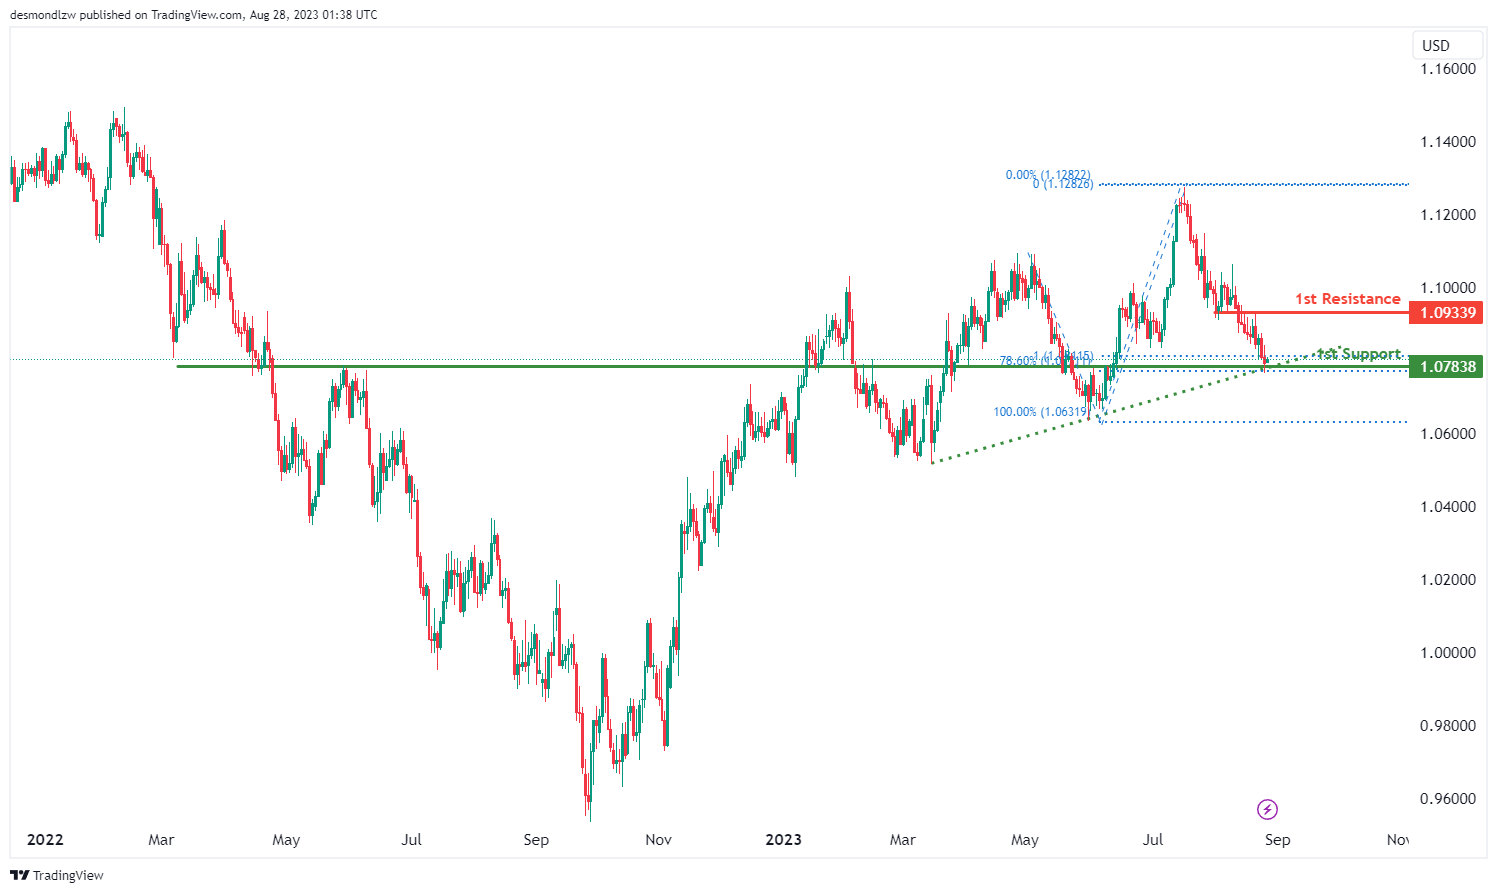
The EUR/USD chart is currently displaying bullish momentum, primarily influenced by the price’s position above a major ascending trend line. This position suggests that there’s a strong possibility for further bullish momentum in the future. Within this context, there’s potential for the price to experience a bullish bounce from the first support at 1.0783 and then make its way towards the first resistance at 1.0933. The first support at 1.0783 is particularly noteworthy because it’s an overlap support, and it aligns with both the 78.60% and 100% Fibonacci Projections, highlighting a Fibonacci confluence.
On the other side, the first resistance at 1.0933 is identified as an overlap resistance, indicating a potential area where selling interest might arise.
EUR/JPY:
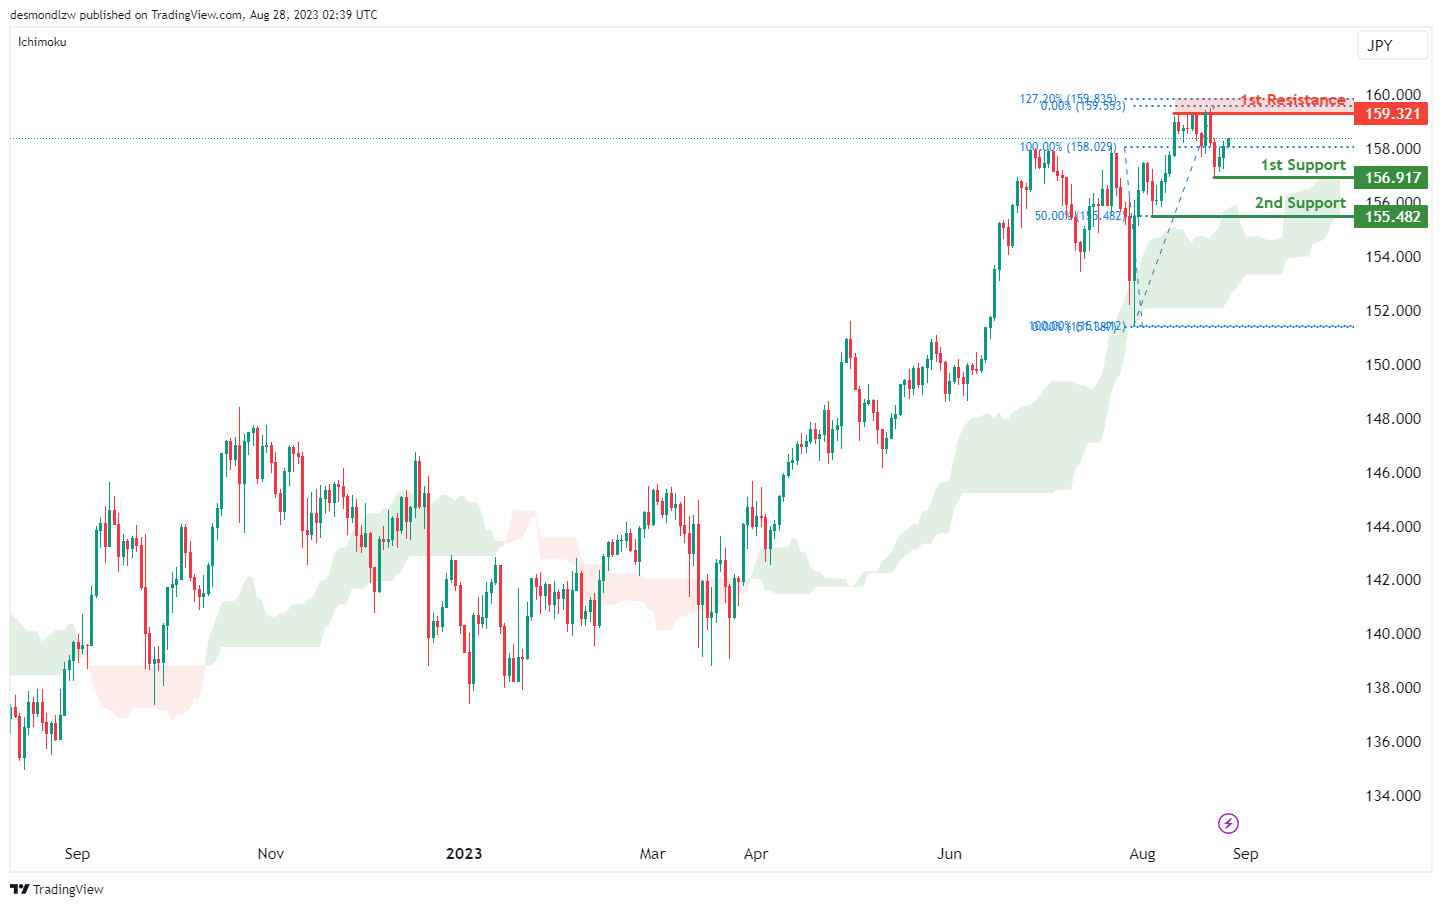
The EUR/JPY chart is currently experiencing a bullish overall momentum and is positioned above the bullish Ichimoku cloud. Based on the analysis, there’s a potential scenario for a bullish continuation towards the first resistance level.
The first support at 156.91 is a significant level due to its swing low support characteristics.
The 2nd support at 155.48 is also valuable as it represents a swing low support and coincides with the 50% Fibonacci Retracement.
In terms of resistance levels, the first resistance at 159.32 stands out due to its multi-swing high resistance attributes, as well as its alignment with the 127.20% Fibonacci Extension.
EUR/GBP:
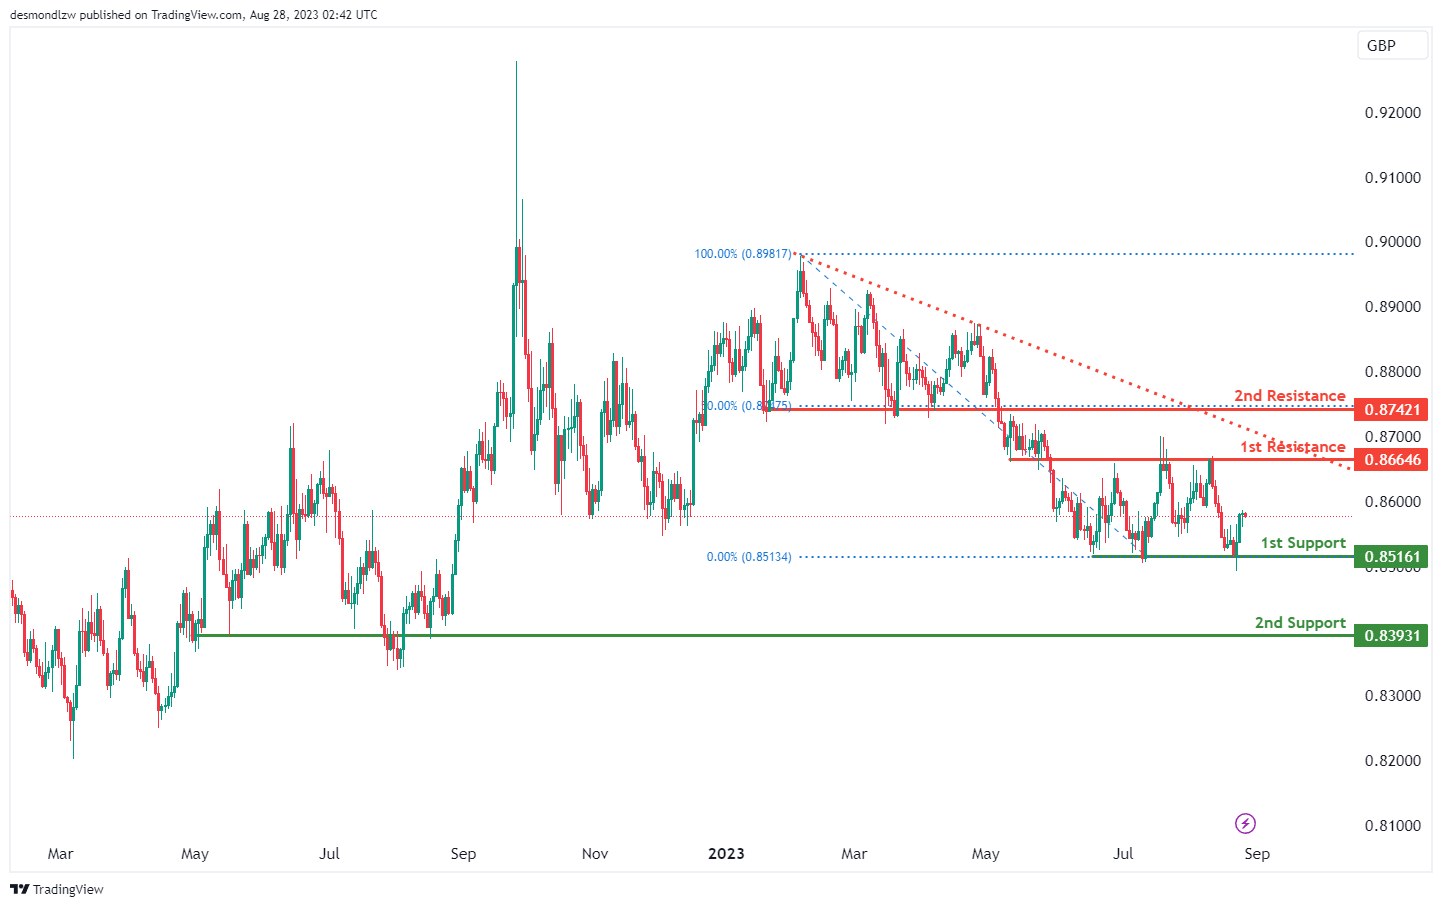
The EUR/GBP chart is exhibiting a bullish overall momentum. According to the analysis, there’s potential for a bullish continuation towards the first resistance level.
The first support at 0.8516 is notable for its multi-swing low support characteristics.
The 2nd support at 0.8393 is also significant as it represents an overlap support.
On the resistance side, the first resistance at 0.8664 stands out due to its overlap resistance characteristics.
The 2nd resistance at 0.8742 is noteworthy for being a pullback resistance and coincides with the 50% Fibonacci Retracement.
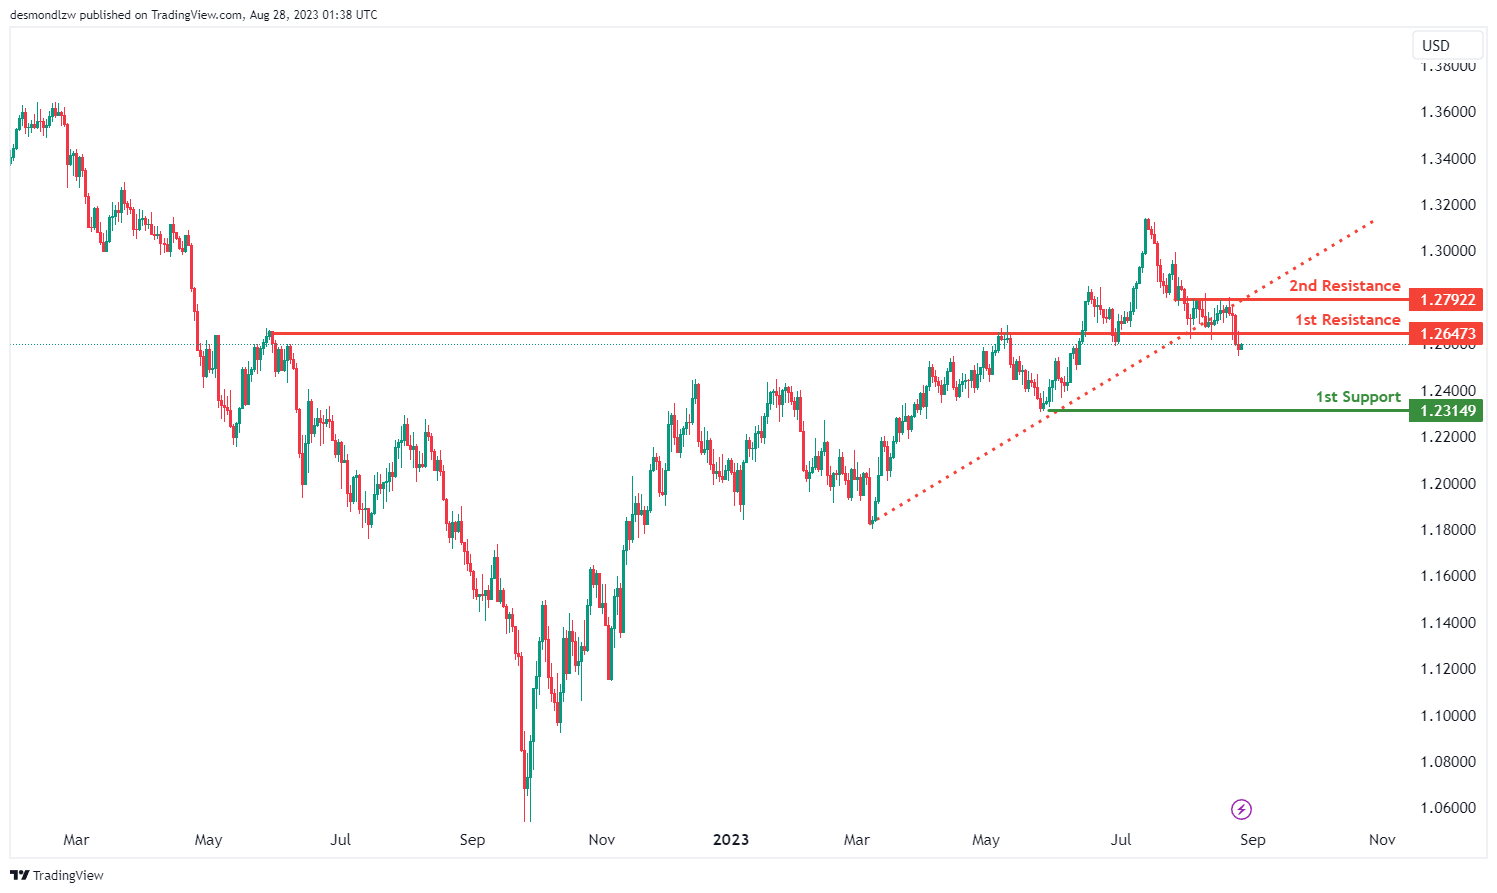
GBP/USD:
The GBP/USD currency pair’s technical landscape reveals a tentative bearish undertone, albeit with subdued conviction. The recent breach below a critical ascending support line has precipitated a potential bearish inclination. This evolving narrative suggests the likelihood of a bearish continuation targeting the first support level pegged at 1.2314, identified due to its function as a swing low support.
On the other hand, any rallies might confront resistance barriers. The first resistance, set at 1.2647, is delineated as an overlap resistance, making it an essential point of observation. Similarly, a secondary resistance level is pinpointed at 1.2792, which also carries the classification of an overlap resistance. These technical demarcations offer pivotal zones to monitor, both for potential reversals and continuations in line with the emerging bearish sentiment.
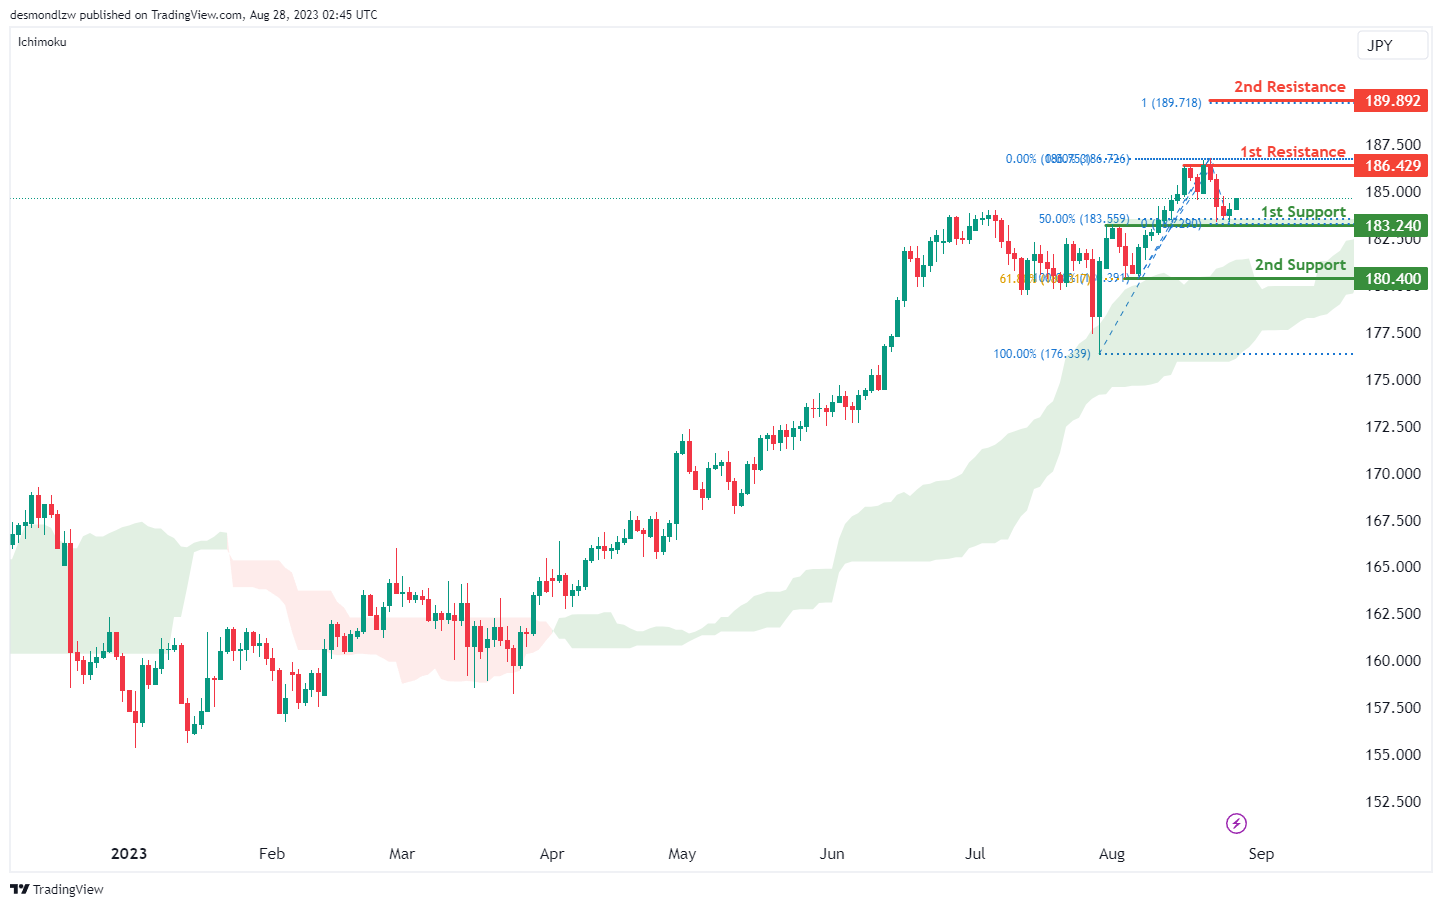
GBP/JPY:
The GBP/JPY chart is demonstrating a bullish overall momentum, and this is further supported by the fact that the price is currently above the bullish Ichimoku cloud. Based on the analysis, there’s potential for a bullish continuation towards the first resistance level.
The first support at 183.24 is significant due to its overlap support characteristics and its alignment with the 50% Fibonacci Retracement.
The 2nd support at 180.40 is noteworthy as it represents a swing low support and coincides with the 61.80% Fibonacci Retracement.
Regarding resistance levels, the first resistance at 186.42 stands out due to its multi-swing high resistance features.
The 2nd resistance at 189.89 is meaningful as it corresponds to the 100% Fibonacci Projection.
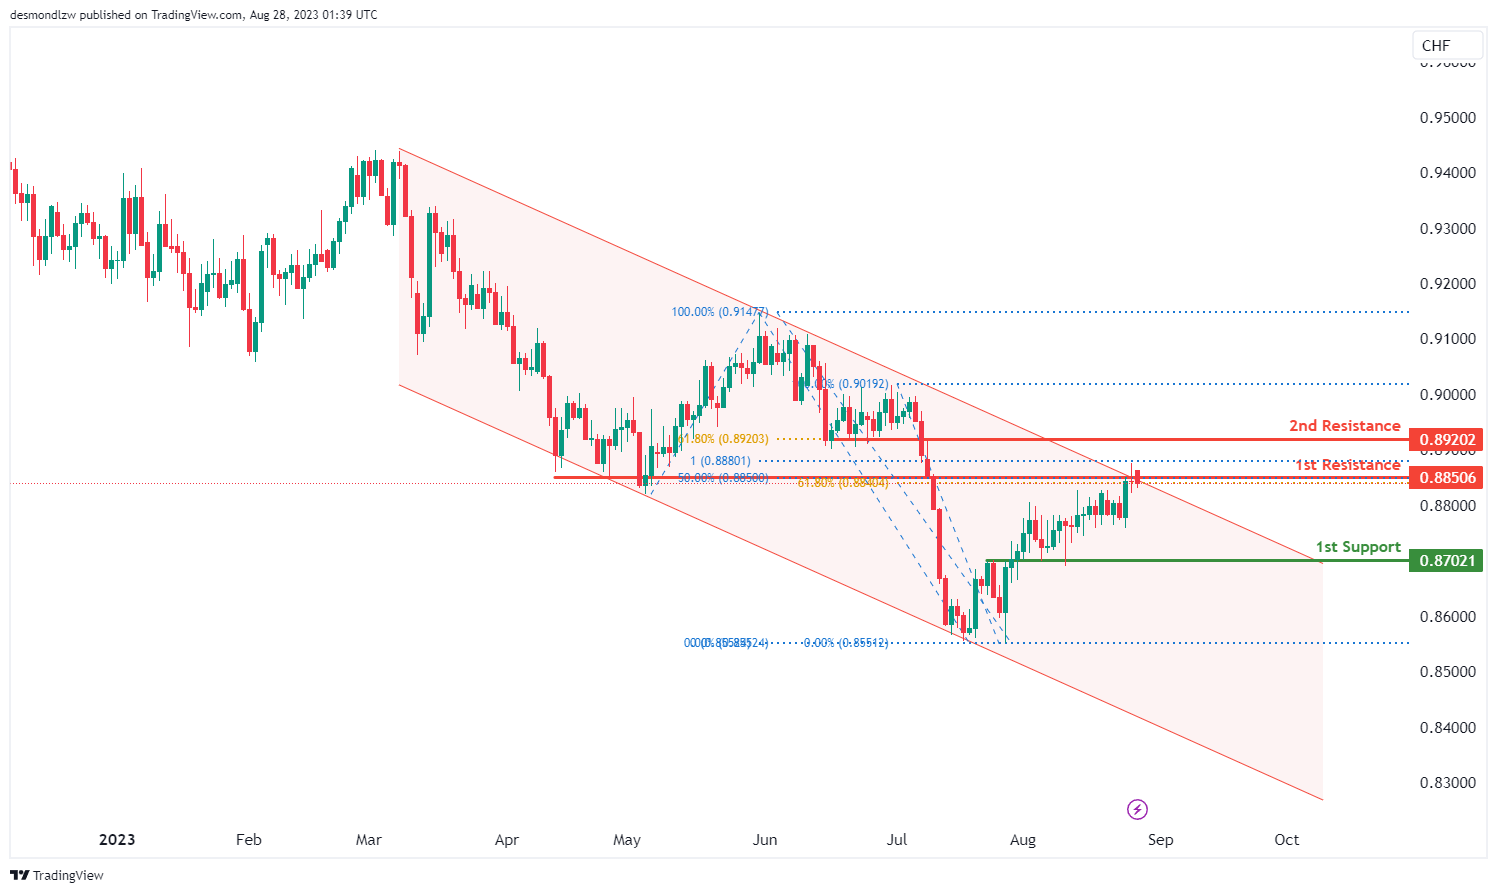
USD/CHF:
The USD/CHF chart currently manifests a bearish momentum, predominantly influenced by the price’s movement within a descending channel. This channel further accentuates the bearish trend, suggesting the likelihood that the price might persist in its decline due to the prevailing bearish impetus.
Within this environment, there’s a foreseeable scenario wherein the price may exhibit a bearish response upon approaching the first resistance at 0.8850 and subsequently descend towards the first support level at 0.8702. The first support level is notable for its designation as an overlap support, signifying a potential zone where the price could find stability.
Conversely, the first resistance at 0.8850 is of particular interest not only because it’s identified as an overlap resistance but also due to its alignment with both the 50% and 61.80% Fibonacci Retracement levels, presenting a Fibonacci confluence. This confluence may amplify its role as a barrier to any upward movement. Additionally, the 2nd resistance at 0.8920, marked as an overlap resistance, is also aligned with the 61.80% Fibonacci Retracement, further accentuating its potential significance in the price dynamics.
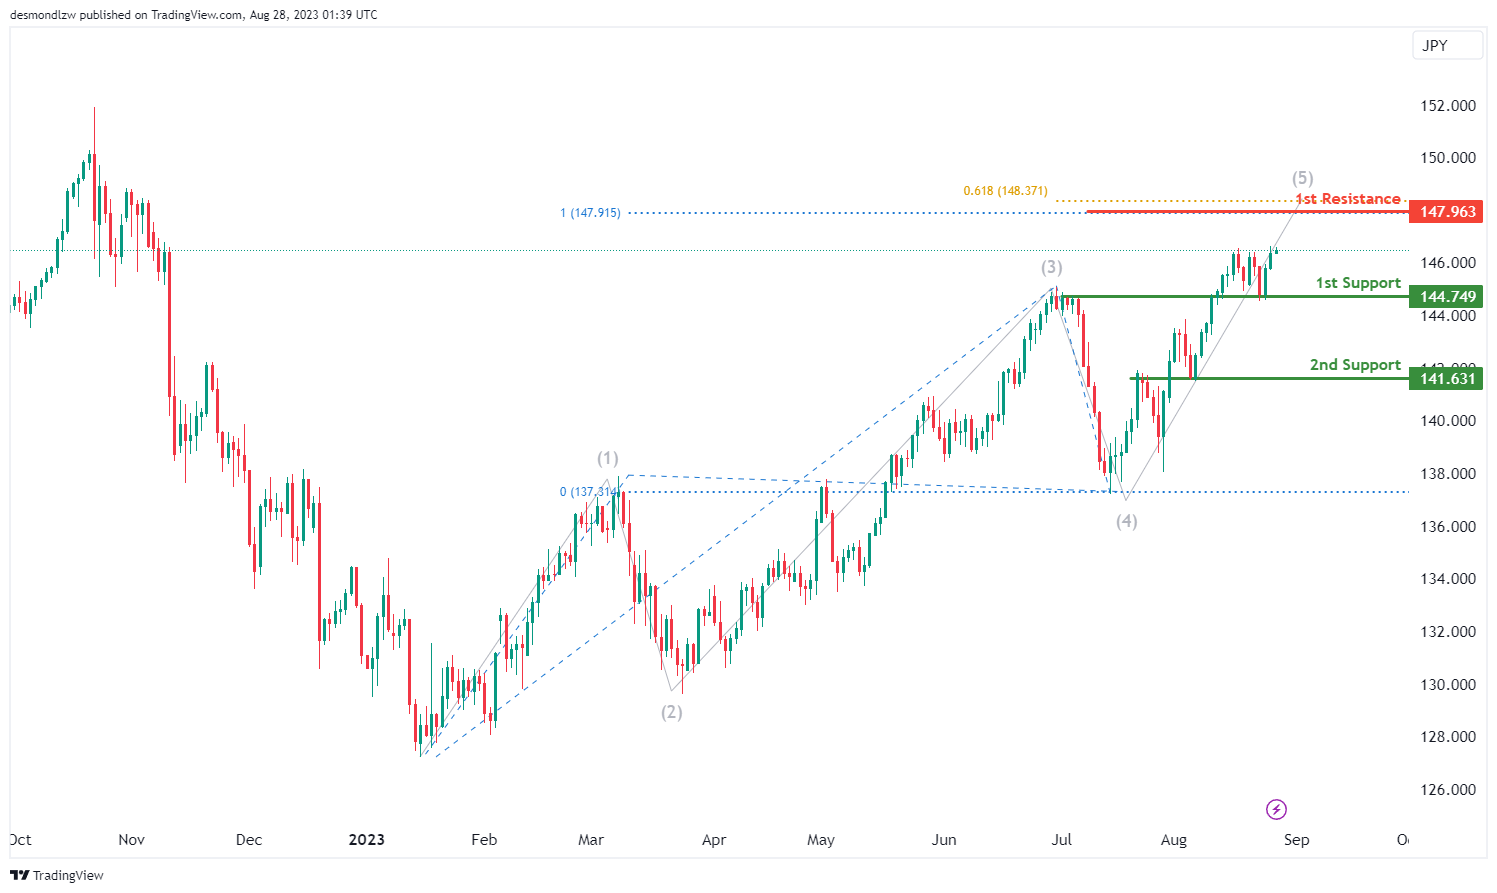
USD/JPY:
The USD/JPY chart currently displays a bullish momentum. Within this favorable trend, it is anticipated that the price might continue its bullish path, targeting the first resistance at 147.96. This resistance level is notable not just because it acts as a pullback resistance, but also due to its alignment with both the 61.80% and 100% Fibonacci Projections, highlighting a significant Fibonacci confluence that could influence price behavior.
Additionally, the first support is also situated at 147.96, which is identified as an overlap support. This suggests that this level might play a dual role, serving as both a potential floor for price retractions and an impending target for bullish pursuits. Further reinforcing the chart’s structure is the 2nd support at 141.63, which is similarly characterized as an overlap support.
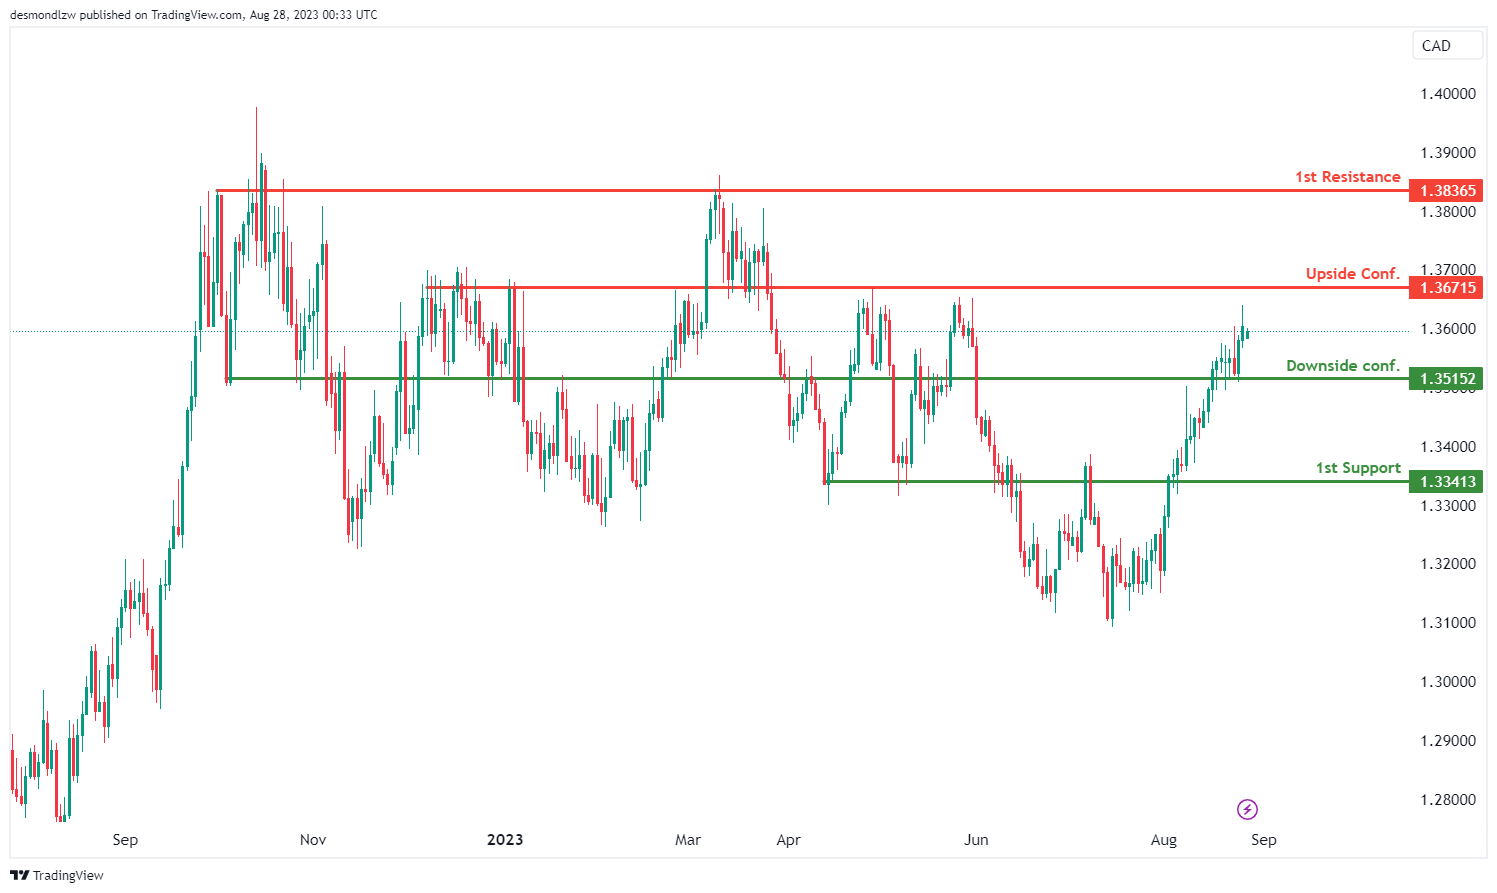
USD/CAD:
The USD/CAD chart has been showing an overall bullish momentum but could now exhibit a neutral momentum. There is a possibility for price to fluctuate between the upside and downside confirmation levels before price breaking through either level.
The upside confirmation level at 1.3672 is identified as an overlap resistance. Should price break through this level, there is a potential for further upward movement towards the first resistance. This first resistance level at 1.3837 is identified as an overlap resistance, implying that it could act as a hurdle to the price’s upward movement.
On the other hand, the downside confirmation level at 1.3515 is identified as an overlap support. Should price break through this level, there is a potential for further downward movement towards the first support. This first support level at 1.3341 is also identified as an overlap support, suggesting that it might provide additional support to the price.
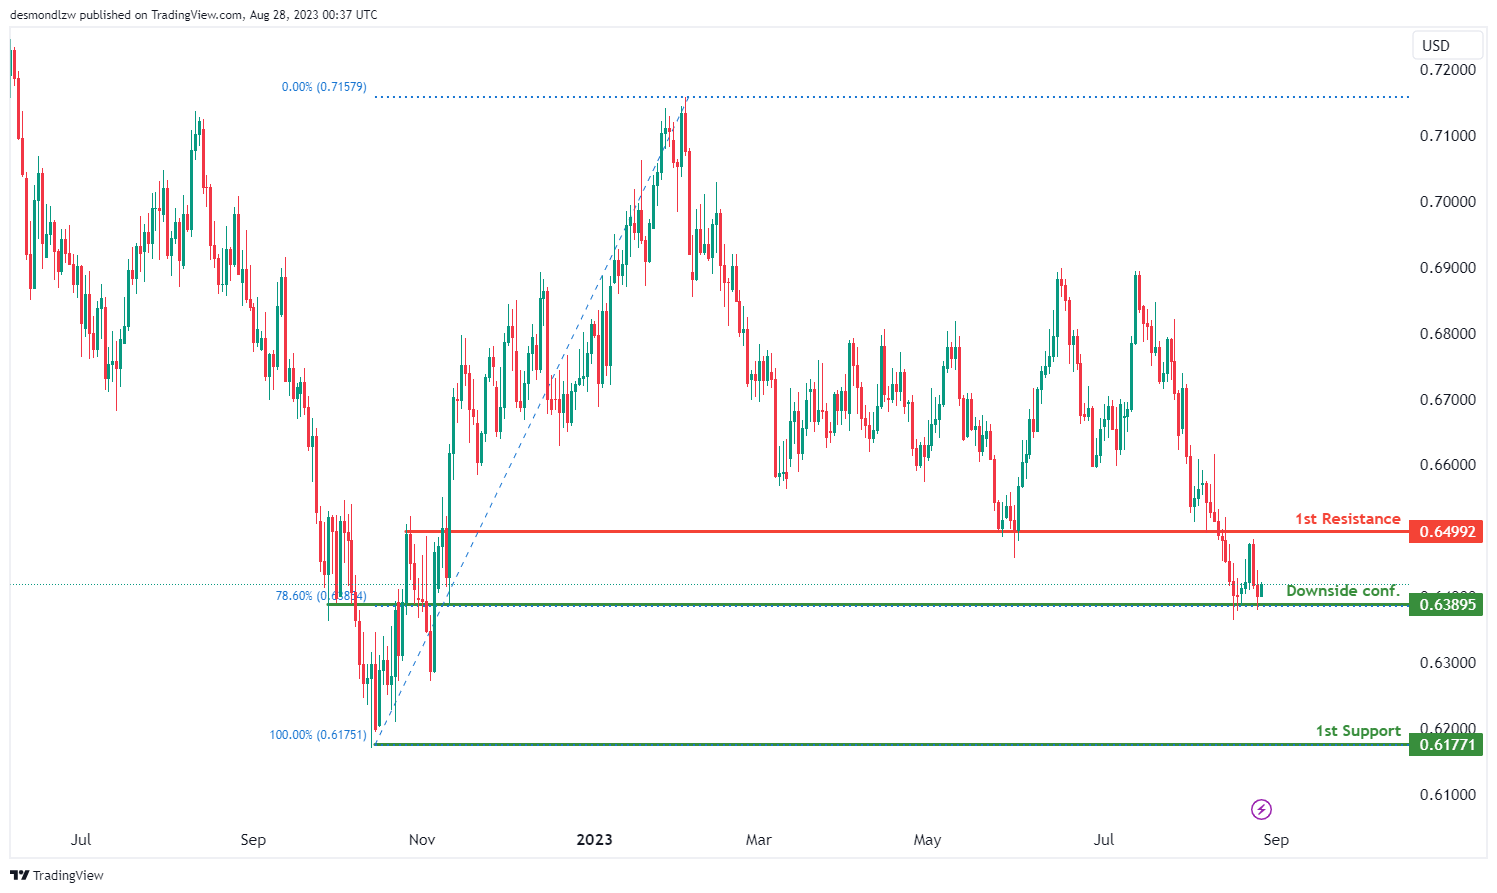
AUD/USD:
The AUD/USD chart is currently exhibiting an overall bearish momentum, indicating a prevailing downtrend. Given this momentum, there’s a possibility that the price might experience a bearish reaction off the downside confirmation level and subsequently drop towards the first support level.
The potential downward movement could continue should price break below the downside confirmation level at 0.6389 which is identified as an overlap support that aligns with the 78.60% Fibonacci retracement level. Furthermore, the first support level at 0.6177 is identified as a swing-low support, indicating that it has previously acted as a point of support during previous price swings.
To the upside, the first resistance level at 0.6499 is identified as an overlap resistance, suggesting that historical price action has seen resistance around this level.
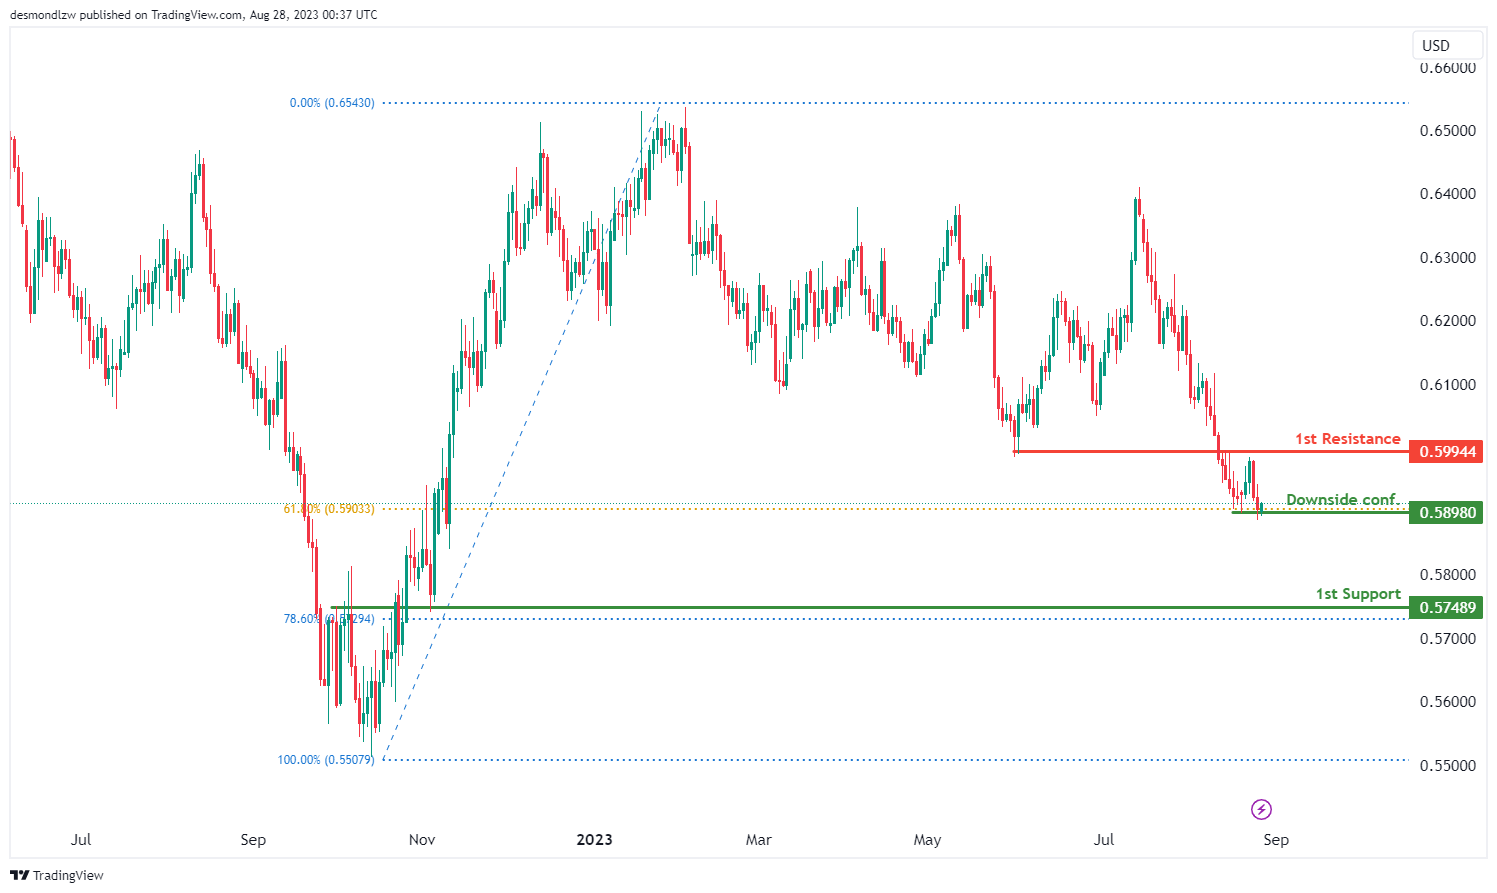
NZD/USD
The overall momentum of the NZD/USD chart is currently bearish, indicating a prevailing trend of downward movement. In this scenario, there is a possibility that the price could experience a bearish breakout off the downside confirmation level and potentially drop towards the first support level.
The downside confirmation level at 0.5898 is identified as a multiple swing-low support that corresponds to the 61.80% Fibonacci retracement level. In addition, the first support level at 0.5749 is identified as an overlap support that aligns with the 78.60% Fibonacci retracement level.
To the upside, the first resistance level at 0.5994 is identified as an overlap resistance where price may encounter a significant barrier to upward movement.
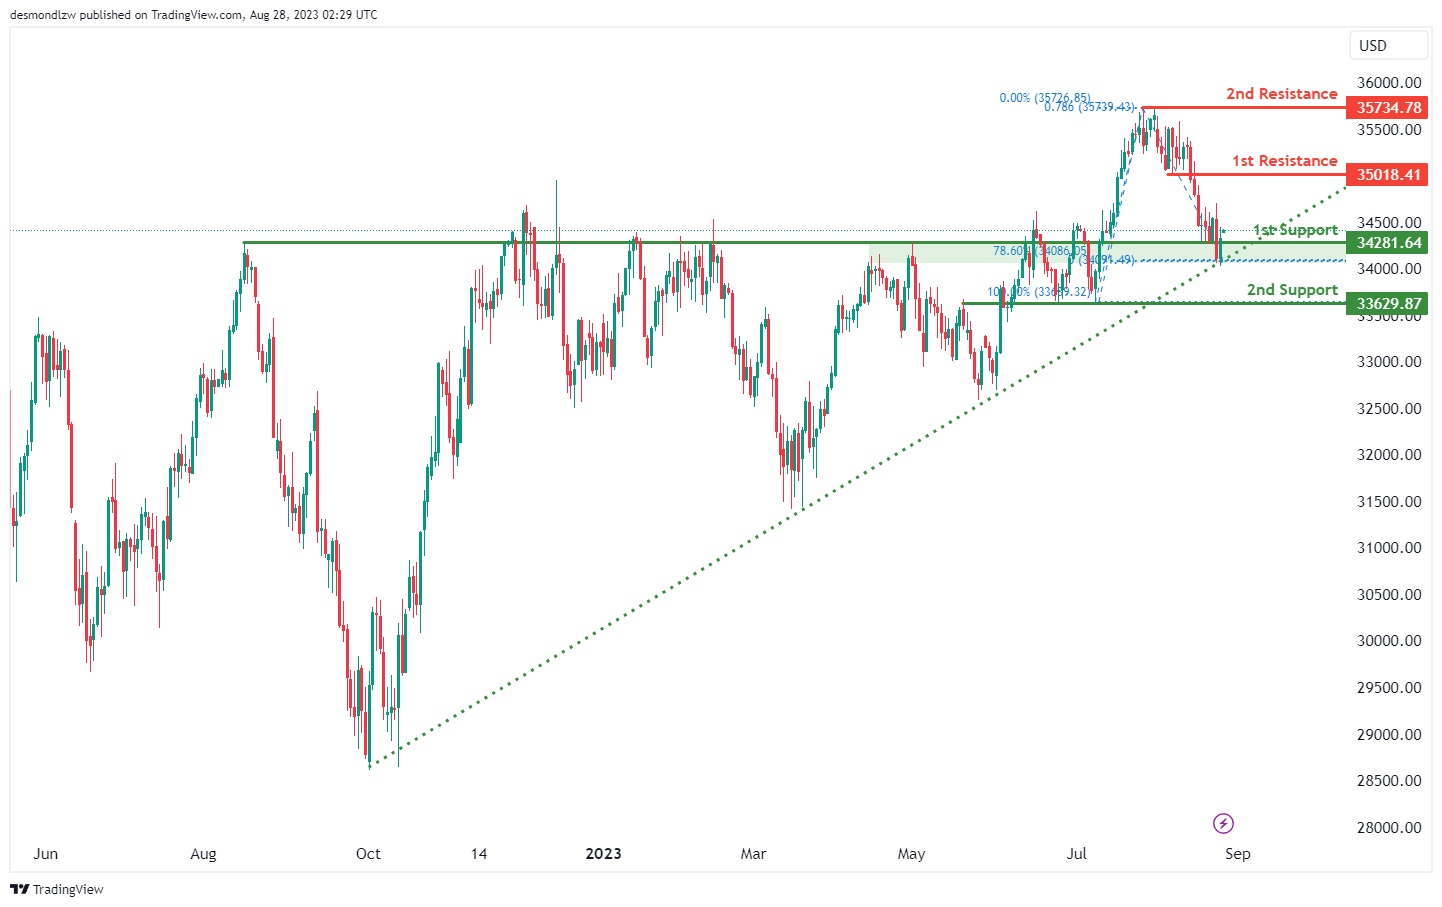
DJ30:
The DJ30 (Dow Jones Industrial Average) chart indicates a bullish overall momentum, and there are factors contributing to this momentum, including the price being above a major ascending trend line, which suggests further bullish potential.
The potential scenario on the chart suggests a bullish continuation towards the first resistance level.
The first support at 34281.64 is valuable as it represents an overlap support and aligns with the 78.60% Fibonacci Retracement. The 2nd support at 33629.87 is also significant as it represents an overlap support.
On the resistance side, the first resistance level at 35018.41 is noteworthy as it represents a pullback resistance. The 2nd resistance at 35734.78 is valuable as it coincides with a swing high resistance and the 78.60% Fibonacci Projection.
GER30:
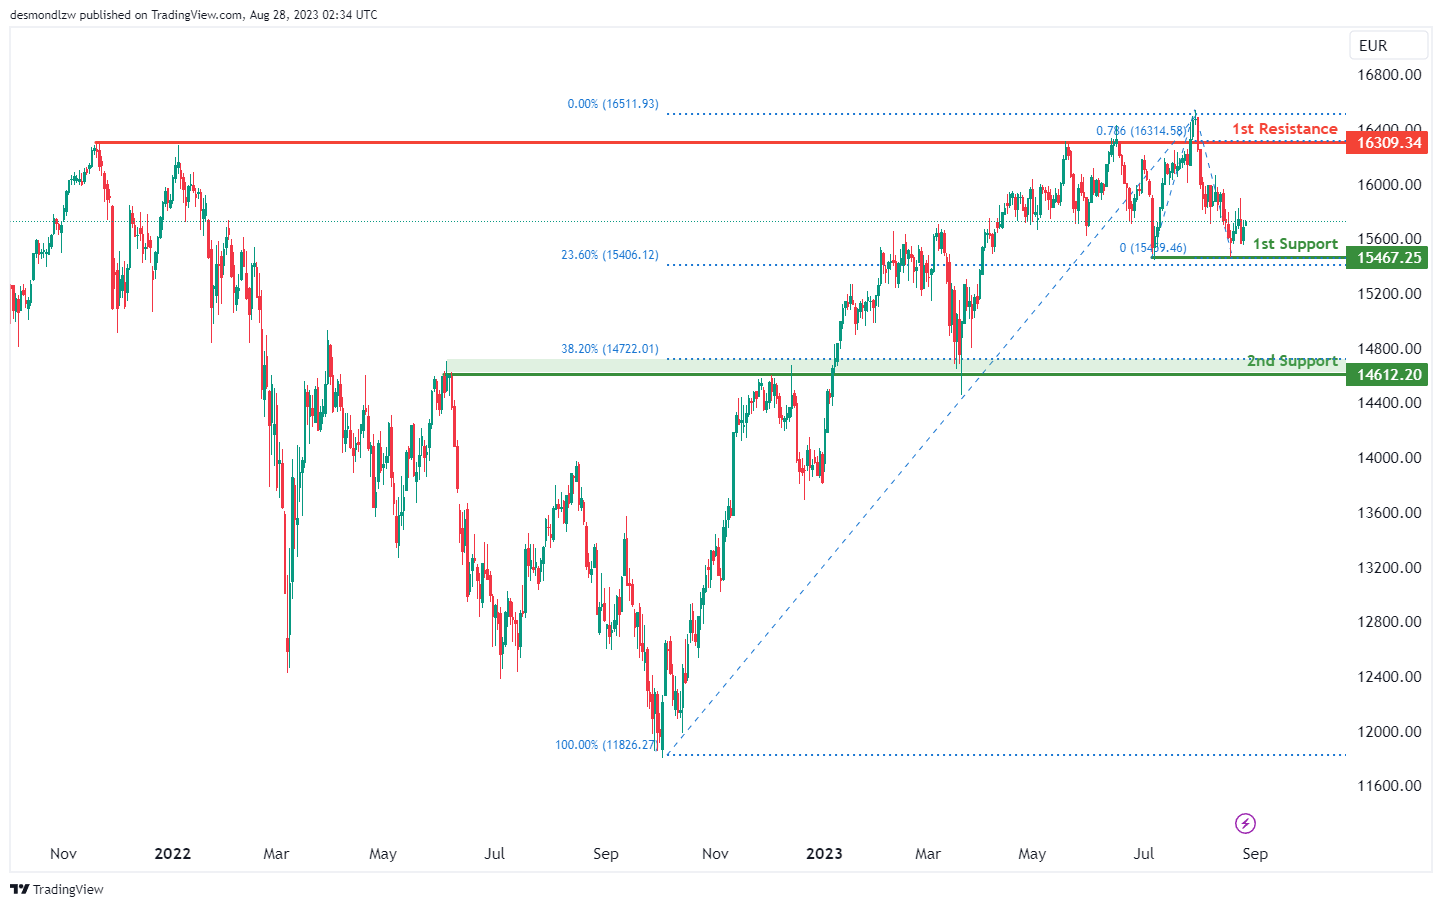
The GER30 (Germany 30) chart still maintains a bullish overall momentum. The potential scenario on the chart indicates a bullish continuation towards the first resistance level.
The first support at 15467.25 holds its value as a multi-swing low support, and it’s further supported by the presence of the 23.60% Fibonacci Retracement.
The 2nd support at 14612.20 is also significant, representing an overlap support and aligning with the 38.20% Fibonacci Retracement.
Regarding resistance levels, the first resistance at 16309.34 remains noteworthy due to its overlap resistance characteristics and confluence with the 78.60% Fibonacci Projection.
US500
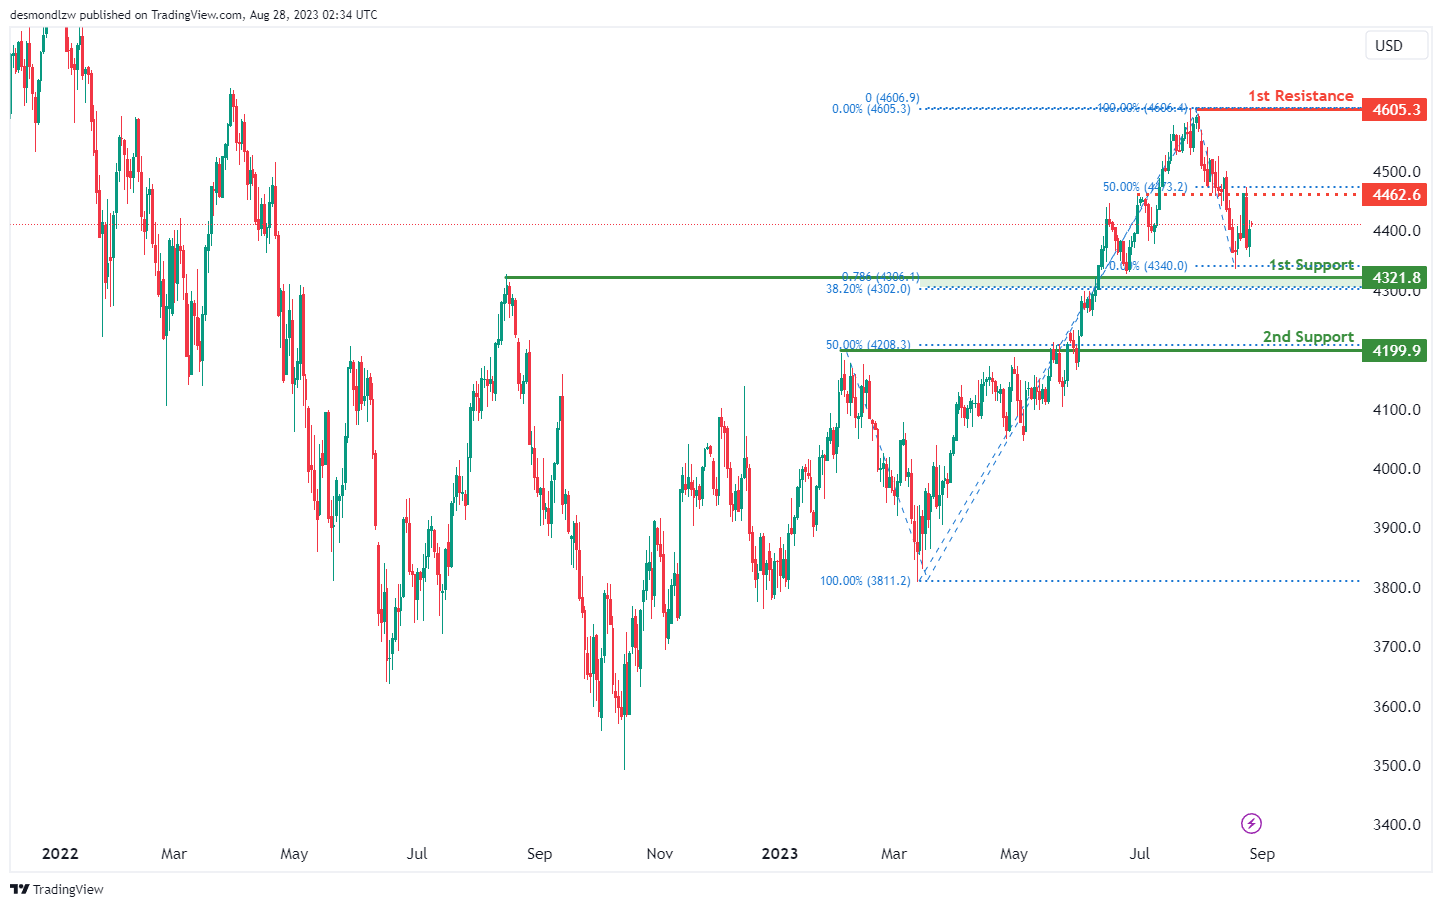
The US500 (S&P 500) chart is maintaining a bullish overall momentum and is within the bullish Ichimoku cloud. Based on the current analysis, there’s a potential scenario for a bullish continuation towards the first resistance level.
The first support at 4327.3 is supported by its overlap support characteristics and also coincides with the 38.20% Fibonacci Retracement. The 2nd support at 4199.9 is significant as it represents an overlap support and aligns with the 50% Fibonacci Retracement.
Regarding resistance levels, the first resistance at 4605.3 stands out due to its swing high resistance attributes. An intermediate resistance at 4462.6 is also important, being an overlap resistance and also aligning with the 50% Fibonacci Retracement.
BTC/USD:
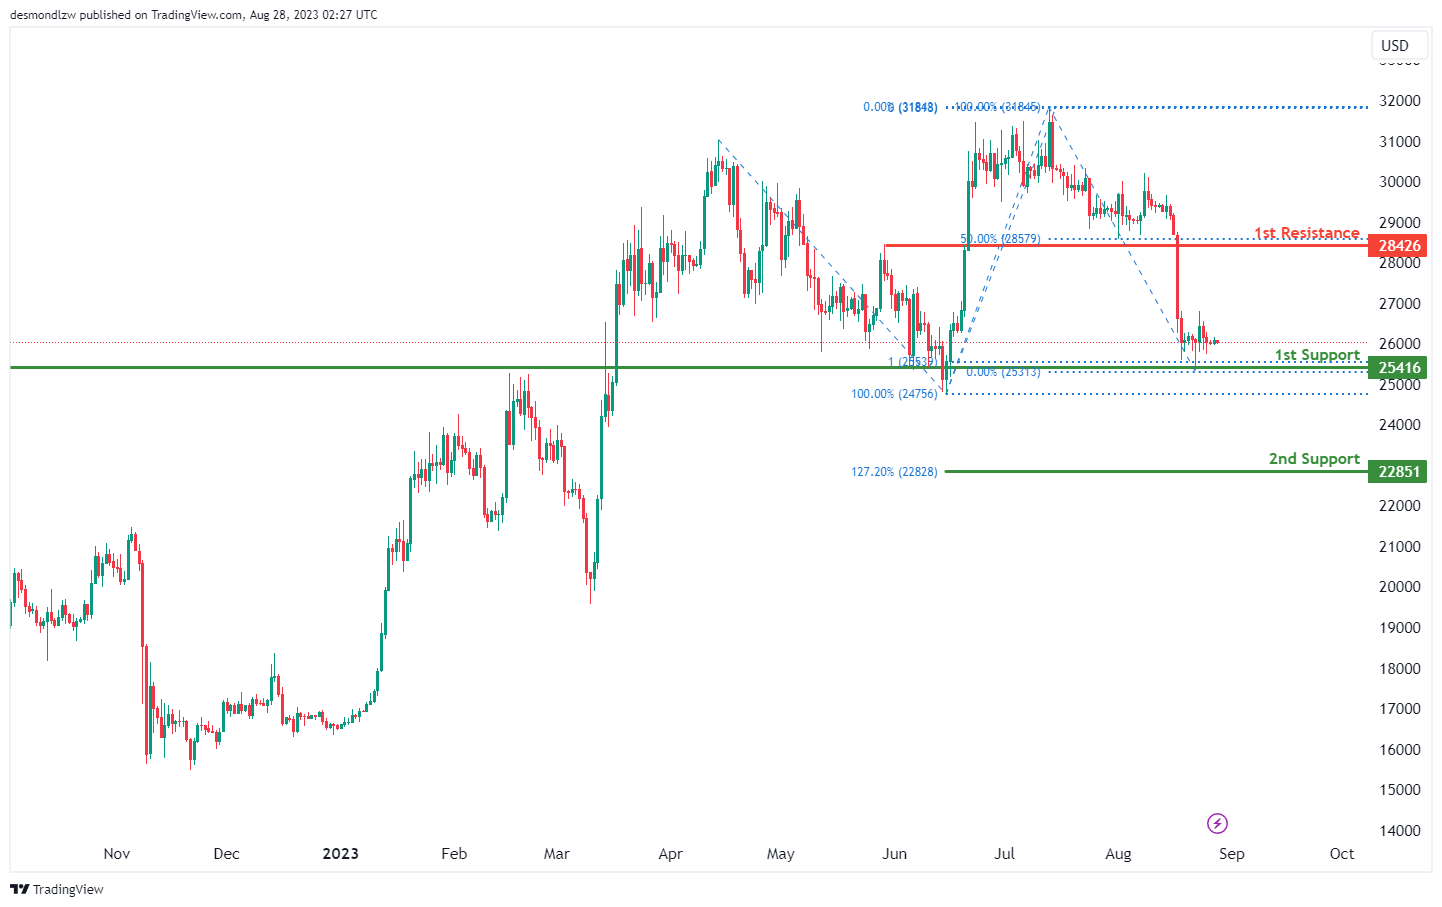
The BTC/USD chart indicates a bullish overall momentum, and there is a possibility of a bullish continuation towards the first resistance level.
The first support at 25416 is significant as it represents an overlap support, and it aligns with the 100% Fibonacci Projection.
The 2nd support at 22851 is noteworthy as it aligns with the 127.20% Fibonacci Extension.
On the resistance side, the first resistance level at 28426 is important as it represents a pullback resistance and coincides with the 50% Fibonacci Retracement.
ETH/USD:
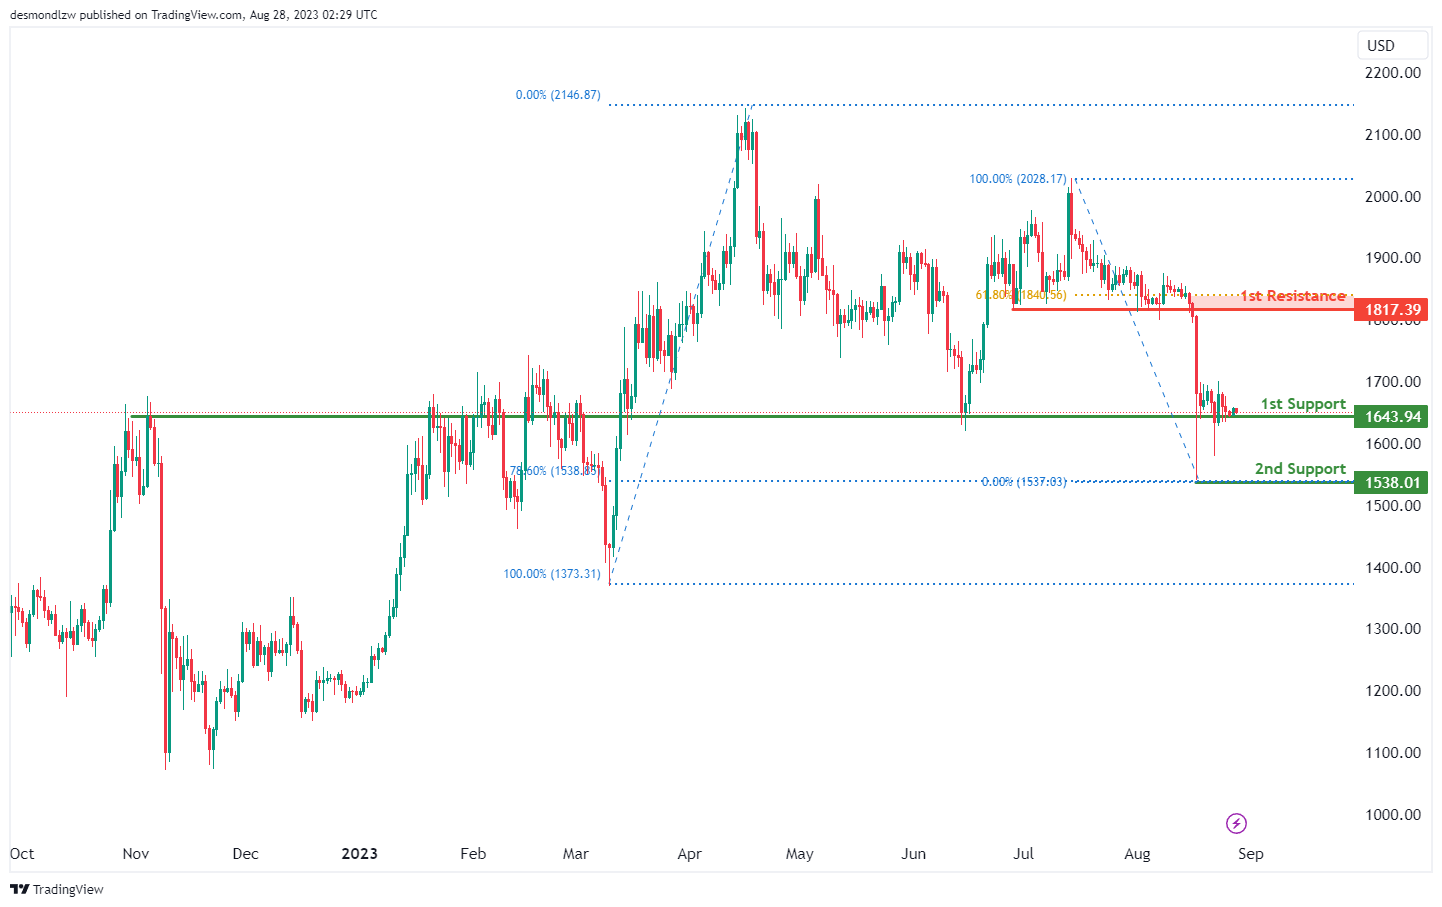
The ETH/USD chart indicates a bullish overall momentum, and there is a potential for a bullish bounce off the first support level with a subsequent move towards the first resistance level.
The first support at 1643.94 is significant as it represents an overlap support.
The 2nd support at 1538.01 is valuable as it aligns with a swing low support and the 78.60% Fibonacci Retracement.
On the resistance side, the first resistance level at 1817.39 is noteworthy as it represents a pullback resistance and coincides with the 61.80% Fibonacci Retracement.
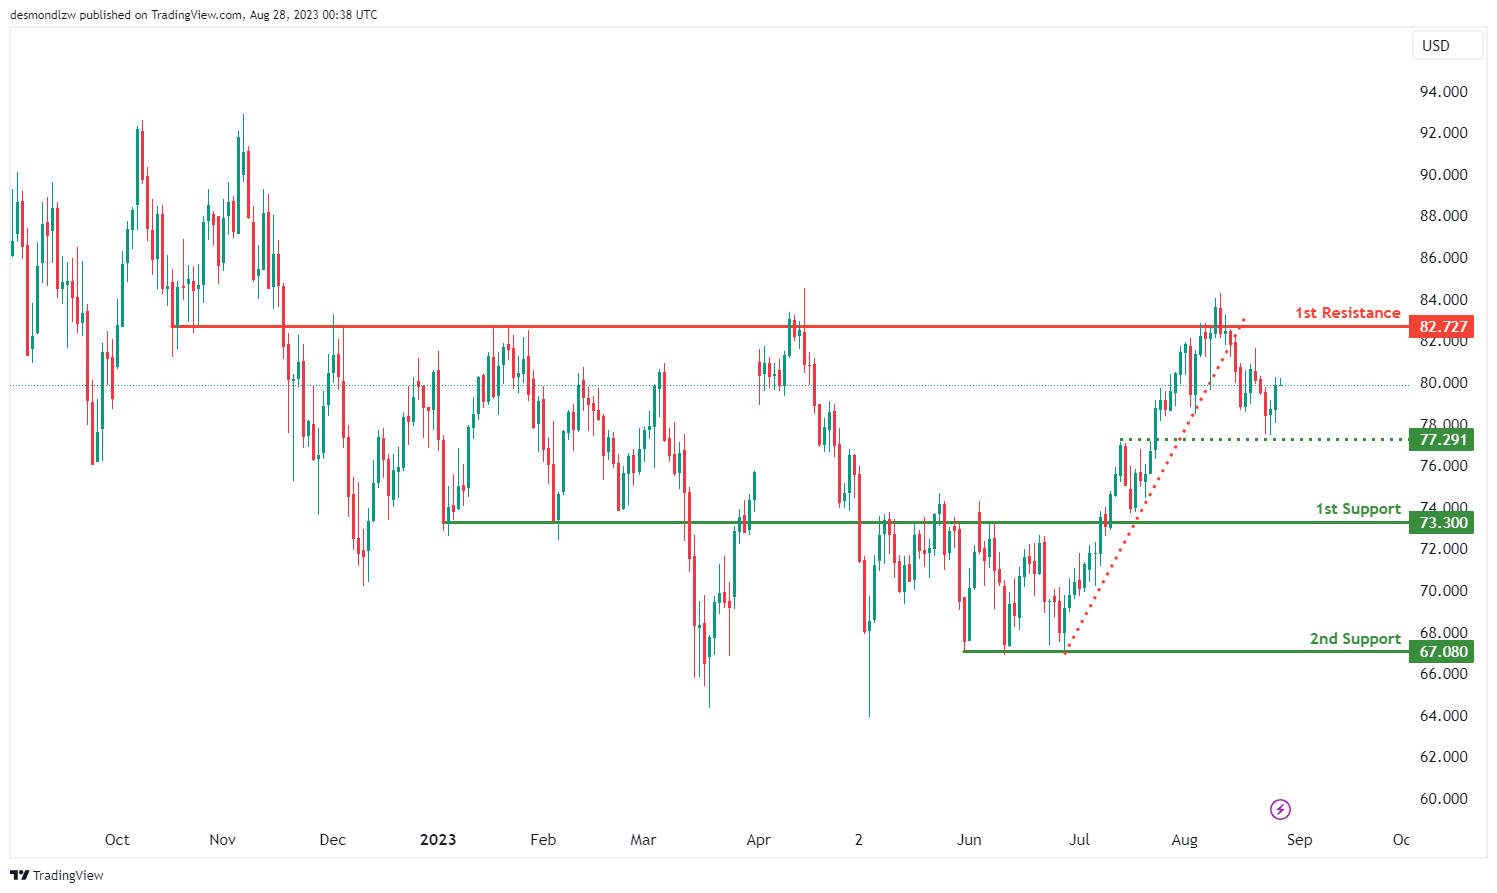
WTI/USD:
The overall momentum of the WTI (West Texas Intermediate) chart is currently bearish, indicating a prevailing trend of downward movement. In this context, there is a possibility that the price could continue its bearish trajectory towards the first support level should intermediate support level be broken. Although overall momentum is bearish, there is a possibility for price to rise towards the first resistance level before reversing to resume the downward movement.
The intermediate support level at 77.29 is identified as an overlap support. Should this level be broken, price could fall towards the first support level at 73.30 which is also identified as an overlap support. Furthermore, the 2nd support level at 67.08 holds importance as it is identified as a multi-swing low support.
To the upside, the first resistance level at 82.73 is identified as an overlap resistance, acting as a significant barrier of resistance since December of 2023.
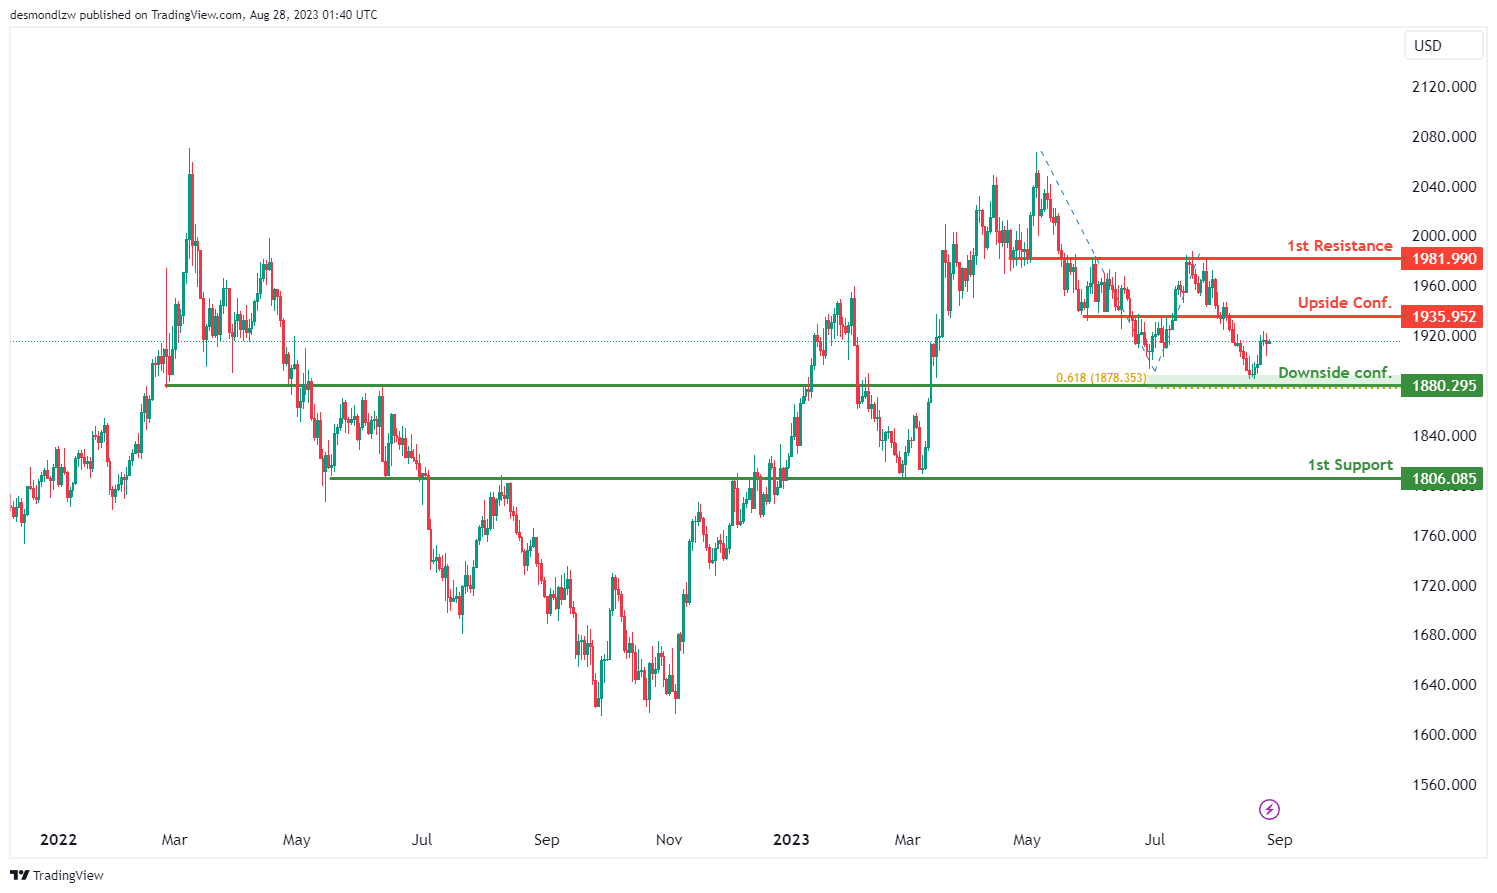
XAU/USD (GOLD):
The XAUUSD chart currently exhibits a neutral momentum. In light of this, the price is expected to fluctuate, potentially oscillating between the first resistance at 1981.99 and the first support at 1806.08.
The first support at 1806.08 stands out as an overlap support, highlighting its significance as a potential area where buying interest might emerge. Just above this level, at 1880.29, there’s another region of interest to consider. This particular point is awaiting downside confirmation and its relevance is accentuated due to its categorization as an overlap support. Furthermore, its alignment with the 61.80% Fibonacci Projection enhances its importance as a strategic level to watch.
On the upside, the first resistance is located at 1981.99 and is defined as an overlap resistance, which could act as a barrier to further upward movement. Before reaching this resistance, a key level at 1935.95 is poised for upside confirmation. This level is significant, being identified as a pullback resistance.


