
DXY:
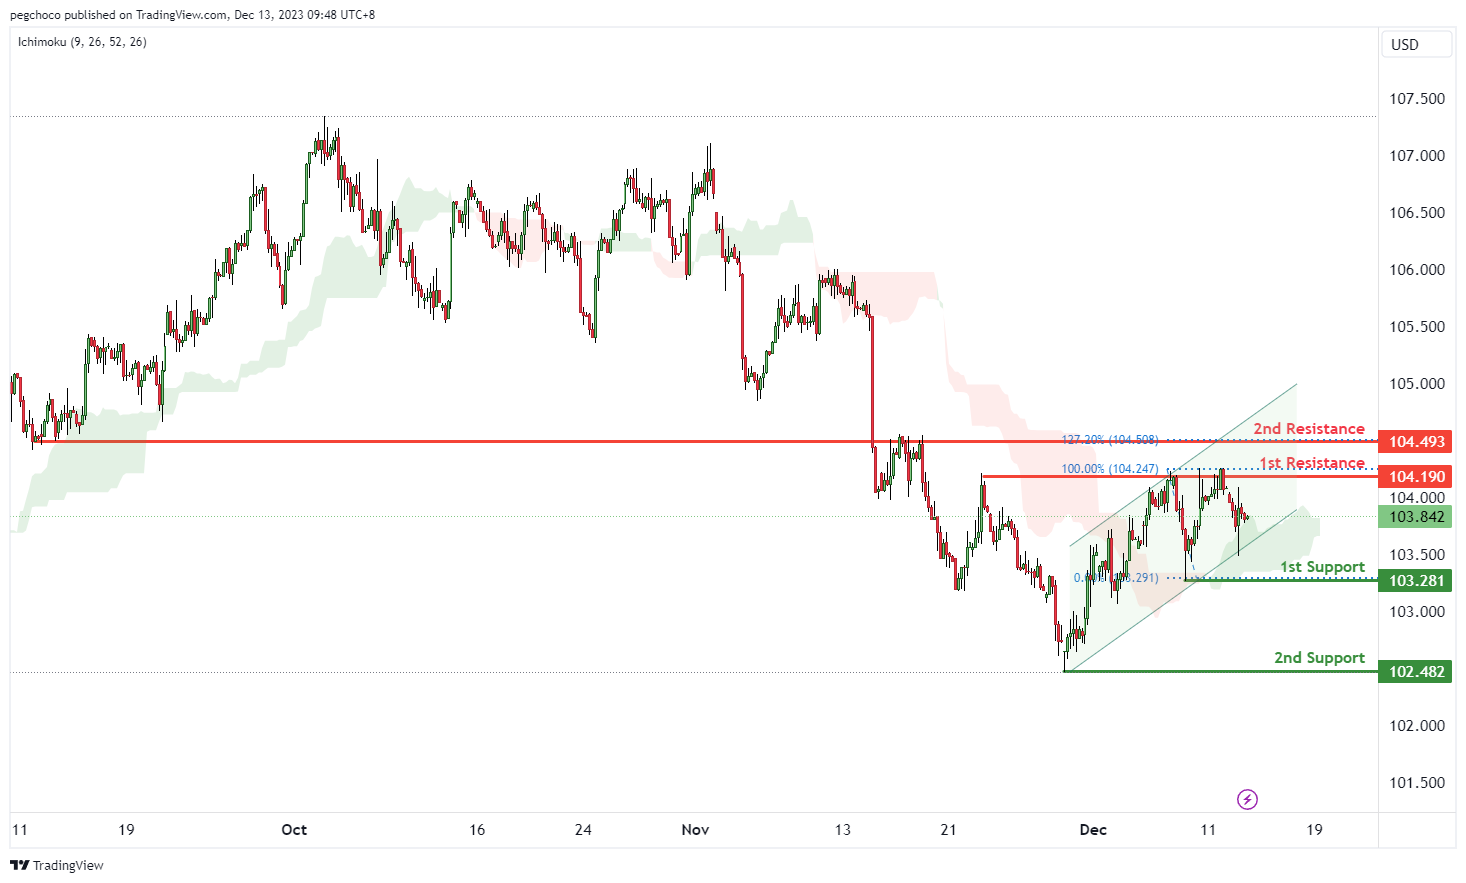
The DXY (US Dollar Index) chart currently has a bullish overall momentum, with price trading within a bullish ascending channel. In this scenario, price could potentially continue its bullish momentum towards the 1st resistance level.
The 1st support at 103.28 is considered a swing low support, indicating that it has previously acted as a level where buying interest emerged. Traders may look for potential buying opportunities or temporary support around this level.
Similarly, the 2nd support at 102.48 is another swing low support level, further reinforcing the potential for price to find support in this area.
On the resistance side, the 1st resistance at 104.19 is categorized as a multi-swing high resistance, suggesting that it has historically acted as a barrier to further upside movements. However, given the overall bullish momentum, traders may anticipate that price could break above this level.
Further up, the 2nd resistance at 104.49 is identified as an overlap resistance and coincides with the 127.20% Fibonacci Extension level, indicating a potential confluence of resistance factors. This level is likely to act as a substantial barrier where selling interest could intensify.
EUR/USD:
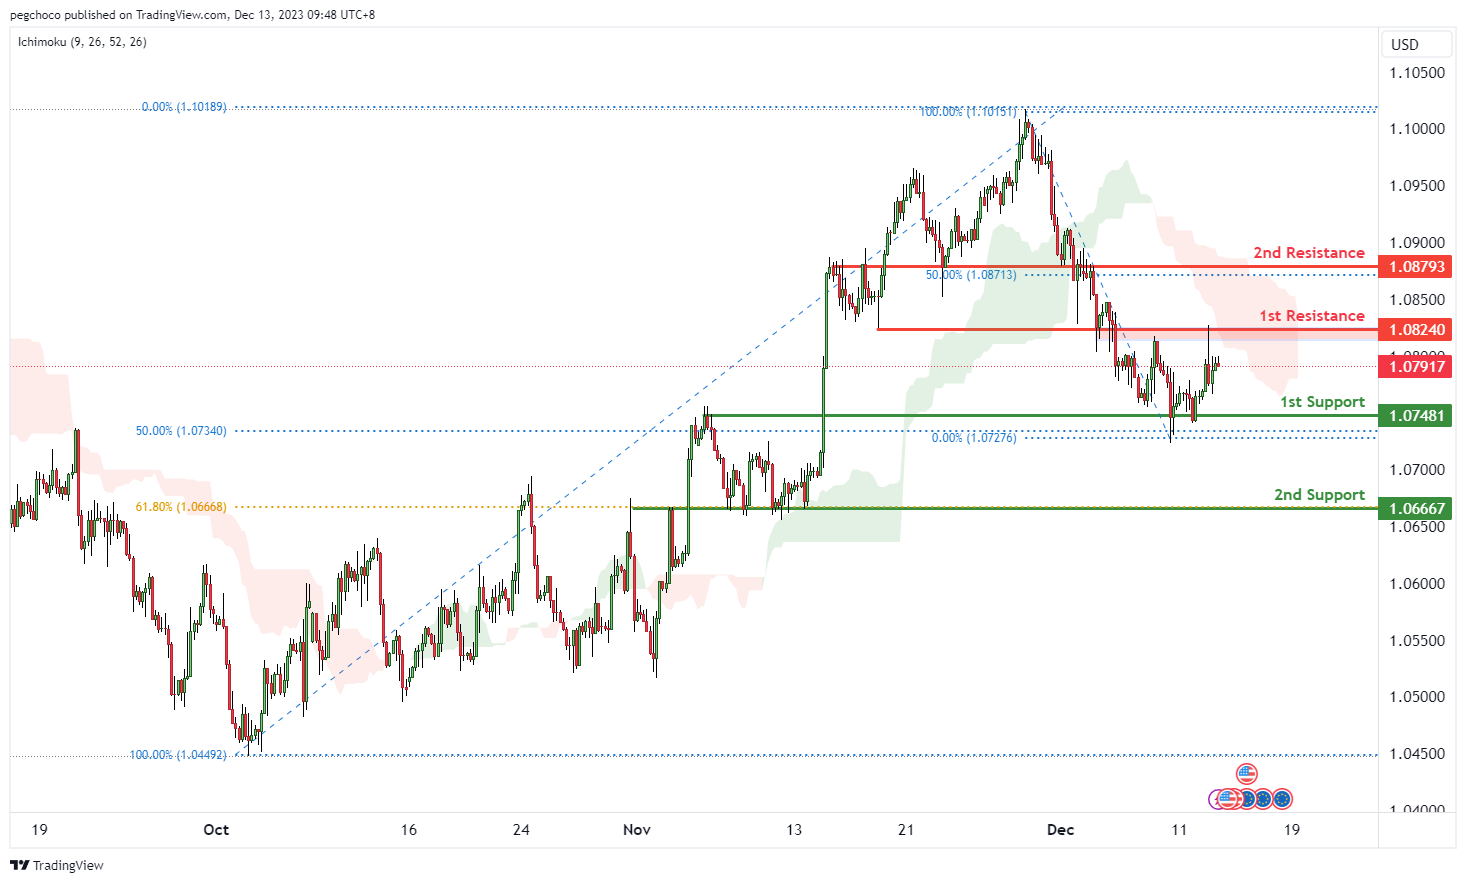
The EUR/USD chart currently has a bearish overall momentum, with price trading below the bearish Ichimoku cloud, indicating a bearish trend in place. In this scenario, price could potentially continue its bearish momentum towards the 1st support level.
The 1st support at 1.0748 is considered an overlap support and coincides with the 50% Fibonacci Retracement level. This level is significant as it suggests a potential area where buying interest may emerge, providing temporary support for EUR/USD.
Similarly, the 2nd support at 1.0666 is another overlap support level and aligns with the 61.80% Fibonacci Retracement level, further reinforcing the potential for price to find support in this area.
On the resistance side, the 1st resistance at 1.0824 is categorized as an overlap resistance. This level is likely to act as a barrier where selling interest could intensify, potentially preventing further upside movements.
Further up, the 2nd resistance at 1.0879 is identified as a pullback resistance and coincides with the 50% Fibonacci Retracement level, suggesting another level where selling pressure may increase.
EUR/JPY:
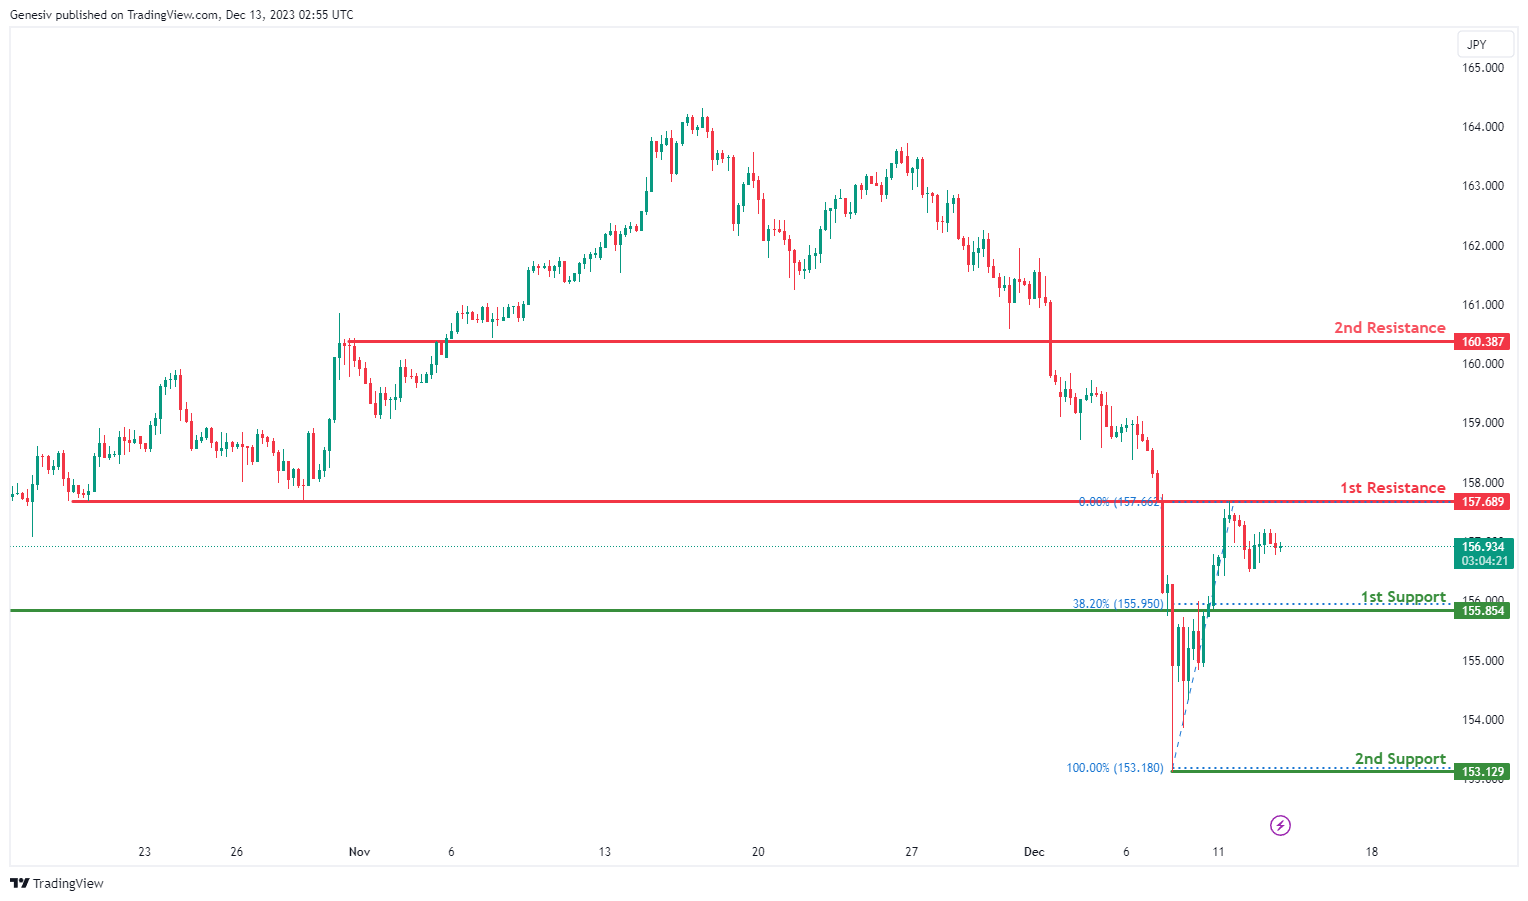
The EUR/JPY chart exhibits a bearish overall momentum, with the current price situated below the bearish Ichimoku cloud, signaling a prevailing bearish trend. Given this context, there is a potential continuation of the bearish momentum, targeting the 1st support level.
The 1st support at 155.85 holds significance as it represents an overlap support and aligns with the 38.20% Fibonacci Retracement level. This confluence suggests a key zone where buying interest may emerge, providing a potential area of temporary support for the currency pair.
Additionally, the 2nd support at 153.13 serves as another crucial level, characterized as a swing low support. This level adds further weight to the potential for support, strengthening the likelihood of a bounce or consolidation around this price point.
On the resistance front, the 1st resistance at 157.69 is identified as a pullback resistance. This level is expected to act as a barrier where selling interest may intensify, potentially impeding any significant upward movements.
Furthermore, the 2nd resistance at 160.39 is recognized as an overlap resistance, indicating a zone where selling pressure could increase. This level coincides with a previous area of interest, adding to its significance as a potential point of reversal for the currency pair.
EUR/GBP:
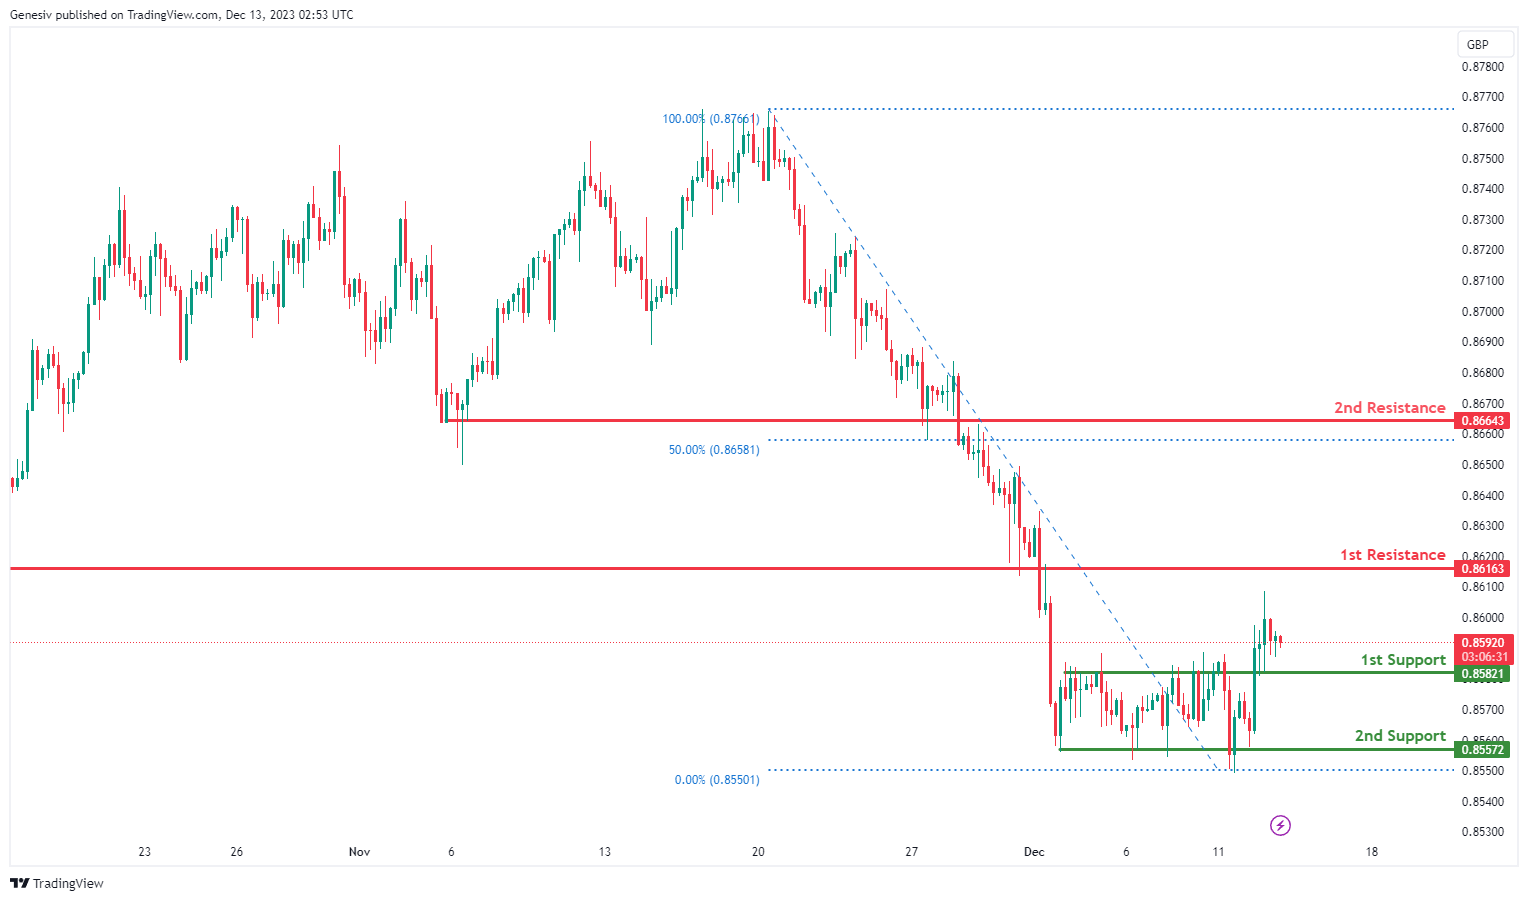
The EUR/GBP chart currently demonstrates a bearish overall momentum, suggesting a potential continuation of the bearish trend towards the 1st support.
The 1st support at 0.8582 is deemed significant due to its classification as an overlap support. This level indicates a convergence of historical price points, reinforcing its potential as a crucial zone where buying interest may emerge, serving as a plausible area for a bearish continuation to find temporary support.
Similarly, the 2nd support at 0.8557 holds importance as a multi-swing low support. This level, derived from multiple swing lows, adds strength to the potential for support, implying that it may act as a substantial level where the bearish momentum could temporarily halt or reverse.
On the resistance side, the 1st resistance at 0.8616 is identified as a pullback resistance. This level is likely to act as a barrier where selling interest could intensify, hindering any significant upward movements and supporting the overall bearish bias.
Furthermore, the 2nd resistance at 0.8664 is characterized as both a pullback resistance and a 50% Fibonacci Retracement level. This confluence enhances the significance of this level, indicating a potential area where selling pressure may increase, aligning with the Fibonacci retracement, a commonly observed technical level in financial markets.
GBP/USD:
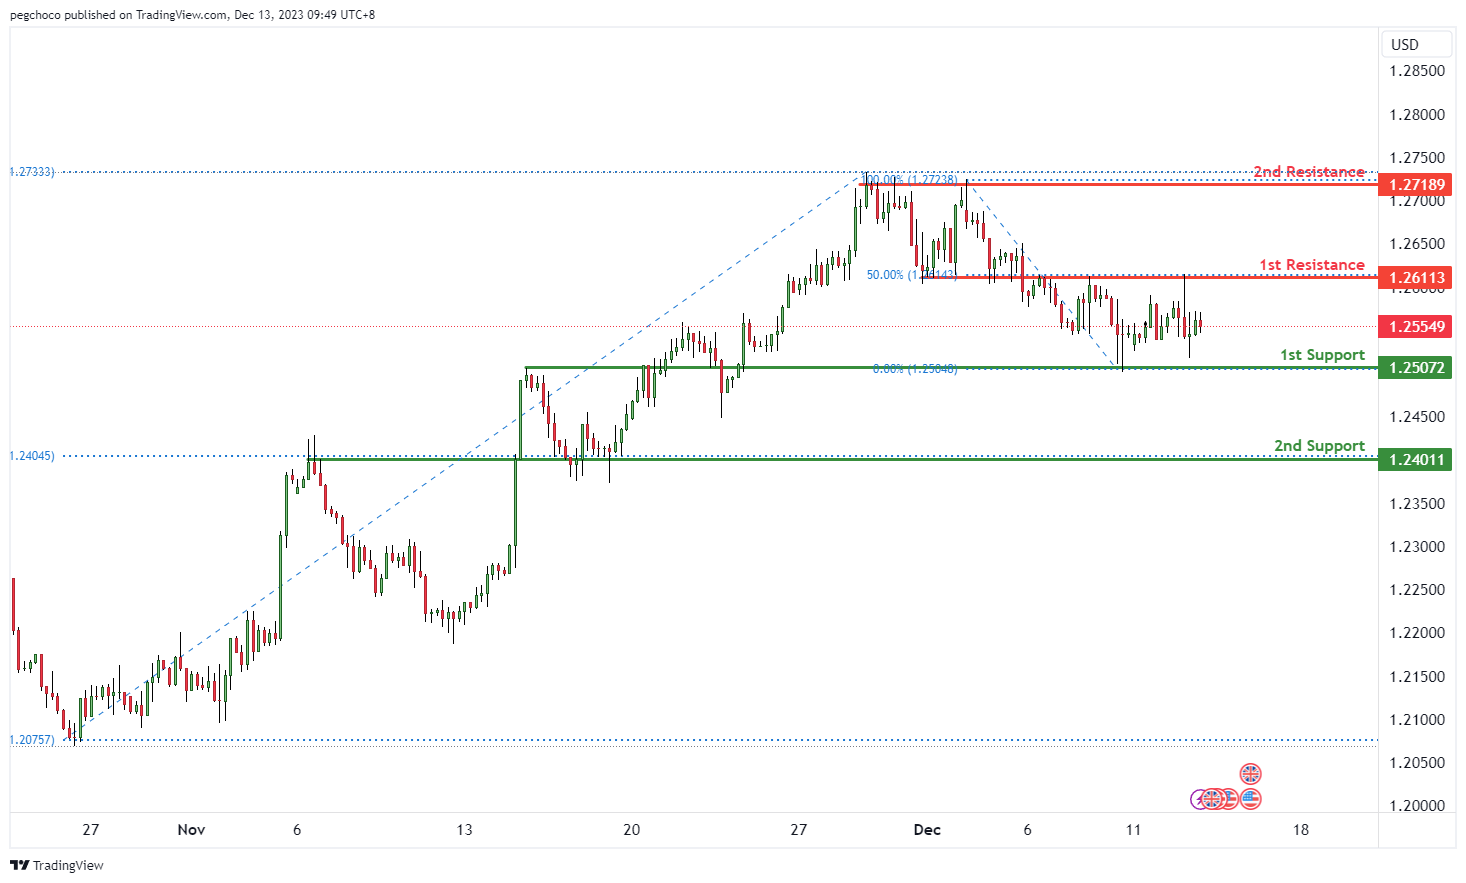
The GBP/USD chart currently has a neutral overall momentum, suggesting a lack of a clear directional bias in the near term. In this scenario, price could potentially fluctuate between the 1st resistance and 1st support levels, presenting a range-bound trading opportunity.
The 1st support at 1.2507 is categorized as an overlap support, and it may serve as a level where buying interest could emerge, providing temporary support for GBP/USD.
Similarly, the 2nd support at 1.2401 is another overlap support level and coincides with the 50% Fibonacci Retracement level, further reinforcing its potential as a support level.
On the resistance side, the 1st resistance at 1.2611 is identified as an overlap resistance, which may act as a barrier where selling interest could intensify, potentially preventing further upside movements.
Further up, the 2nd resistance at 1.2718 is categorized as a multi-swing high resistance, suggesting that it could be a significant level where selling pressure may increase.
GBP/JPY:
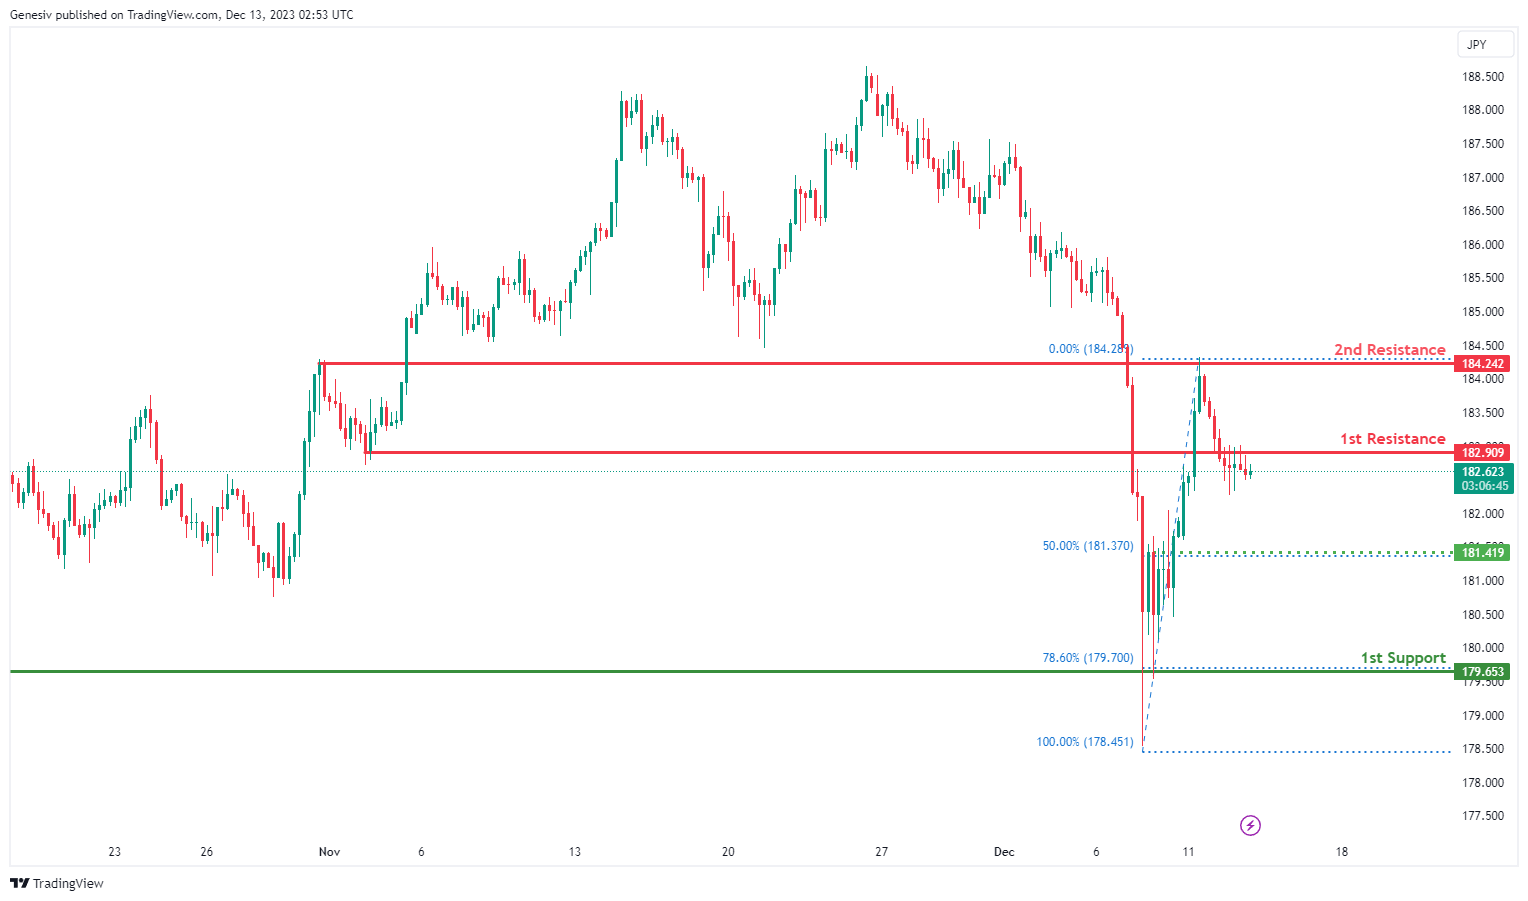
The GBP/JPY chart currently reflects a bearish overall momentum, and there is a possibility of a short-term rise towards the 1st resistance before a potential reversal and subsequent drop towards the 1st support.
The 1st support at 179.65 is considered significant due to its classification as a pullback support and its alignment with the 78.60% Fibonacci Retracement level. This confluence suggests a key area where buying interest may emerge, providing potential support for the currency pair.
Additionally, there is an intermediate support at 181.42, identified as a pullback support. This level further reinforces the potential for support, acting as an additional zone where buyers might step in after a pullback.
On the resistance side, the 1st resistance at 182.91 is categorized as a pullback resistance. This level is likely to act as a barrier where selling interest could intensify, potentially causing a reversal in the short-term rise before a drop.
Furthermore, the 2nd resistance at 184.24 is associated with both a swing high resistance and an additional factor. This further strengthens the resistance level, indicating a zone where selling pressure may increase, especially considering the presence of both swing high resistance and another technical factor.
USD/CHF:
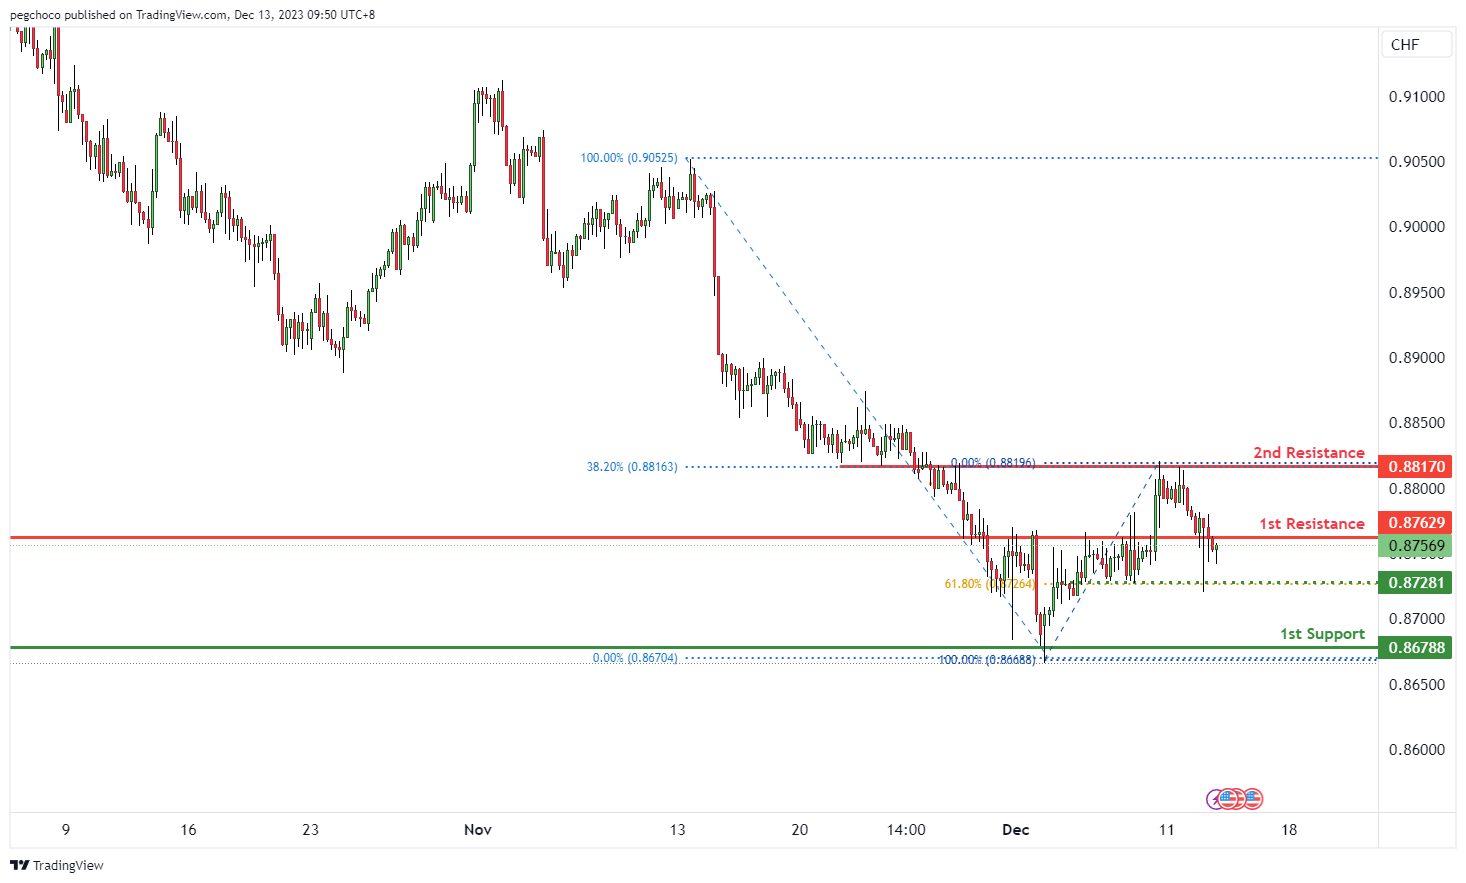
The USD/CHF chart currently has a bearish overall momentum, indicating a downward trend. Price could potentially make a bearish reaction off the 1st resistance and drop to the 1st support.
The 1st support at 0.8678 is considered a multi-swing low support level. This level has historical significance as it has previously acted as a level where buying interest emerged. It might serve as a temporary support zone for USD/CHF.
Intermediate support at 0.8728 is another level to watch. It’s categorized as an overlap support and coincides with the 61.80% Fibonacci Retracement level, suggesting potential Fibonacci confluence. This could add to its significance as a support level.
On the resistance side, the 1st resistance at 0.8762 is identified as a pullback resistance. This level could act as a significant barrier where selling interest may intensify, potentially causing a bearish reversal.
Further up, the 2nd resistance at 0.8817 is categorized as an overlap resistance and coincides with the 38.20% Fibonacci Retracement level. This level might also serve as a strong resistance zone where sellers could exert more pressure.
USD/JPY:
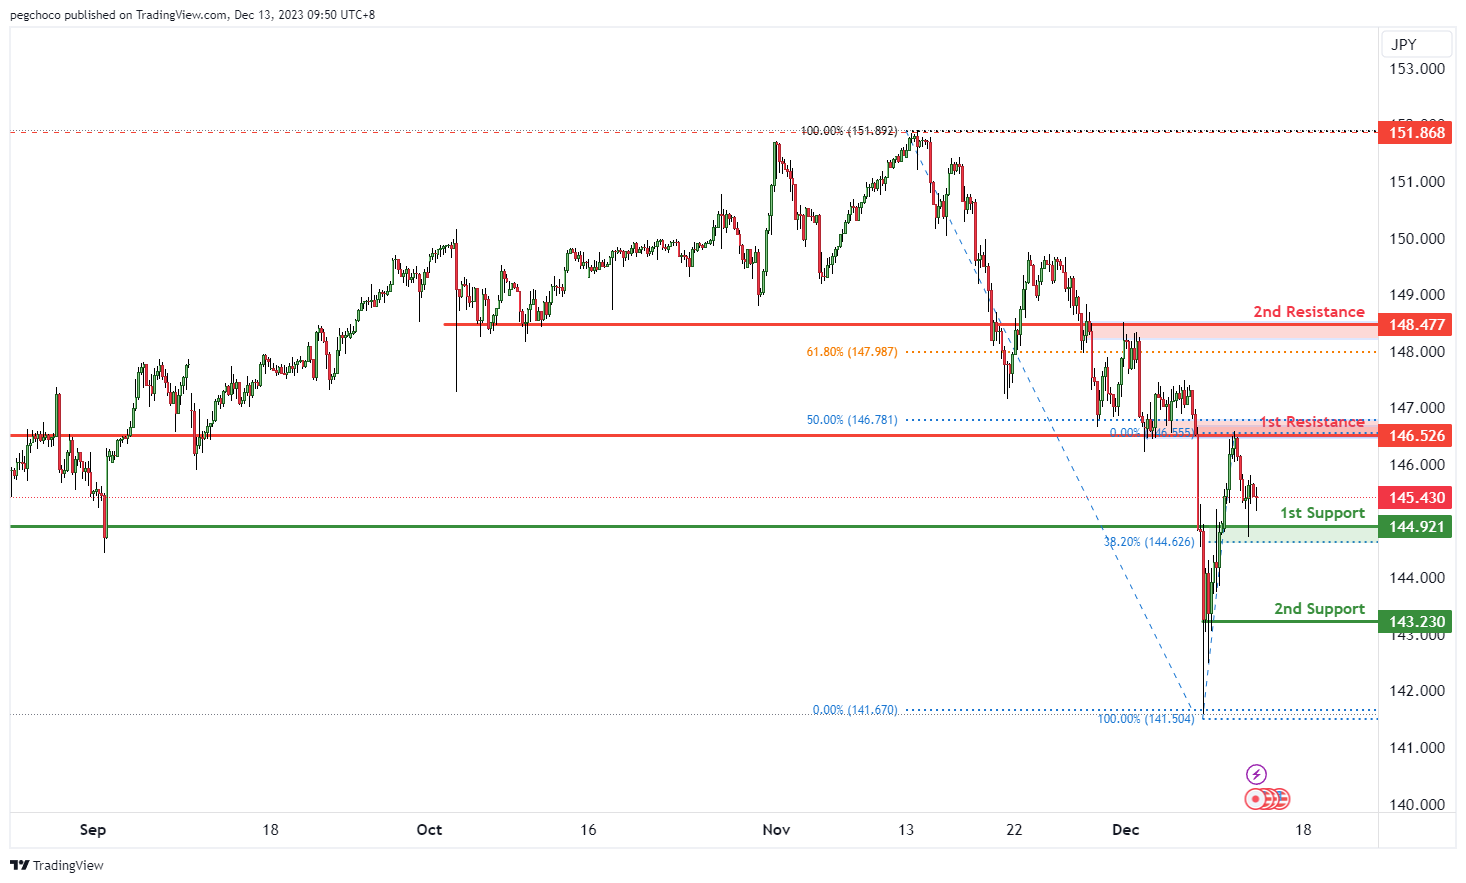
The USD/JPY chart currently has a bearish overall momentum, suggesting a downward trend. Price could potentially make a bearish break off the 1st support and drop towards the 2nd support.
The 1st support at 144.92 is considered an overlap support and also coincides with the 38.20% Fibonacci Retracement level. This level is significant as it has previously acted as a support level and aligns with Fibonacci retracement, adding to its potential importance as a support zone.
The 2nd support at 143.23 is categorized as a multi-swing low support. This level is another area to watch for potential support as it has historical significance and represents a lower level of price support.
On the resistance side, the 1st resistance at 146.52 is identified as an overlap resistance and coincides with the 50% Fibonacci Retracement level. This level could serve as a significant barrier where selling interest may intensify, potentially leading to a bearish reversal.
Further up, the 2nd resistance at 148.47 is also categorized as an overlap resistance and coincides with the 61.80% Fibonacci Retracement level. This level might also act as a strong resistance zone where sellers could exert more pressure.
USD/CAD:
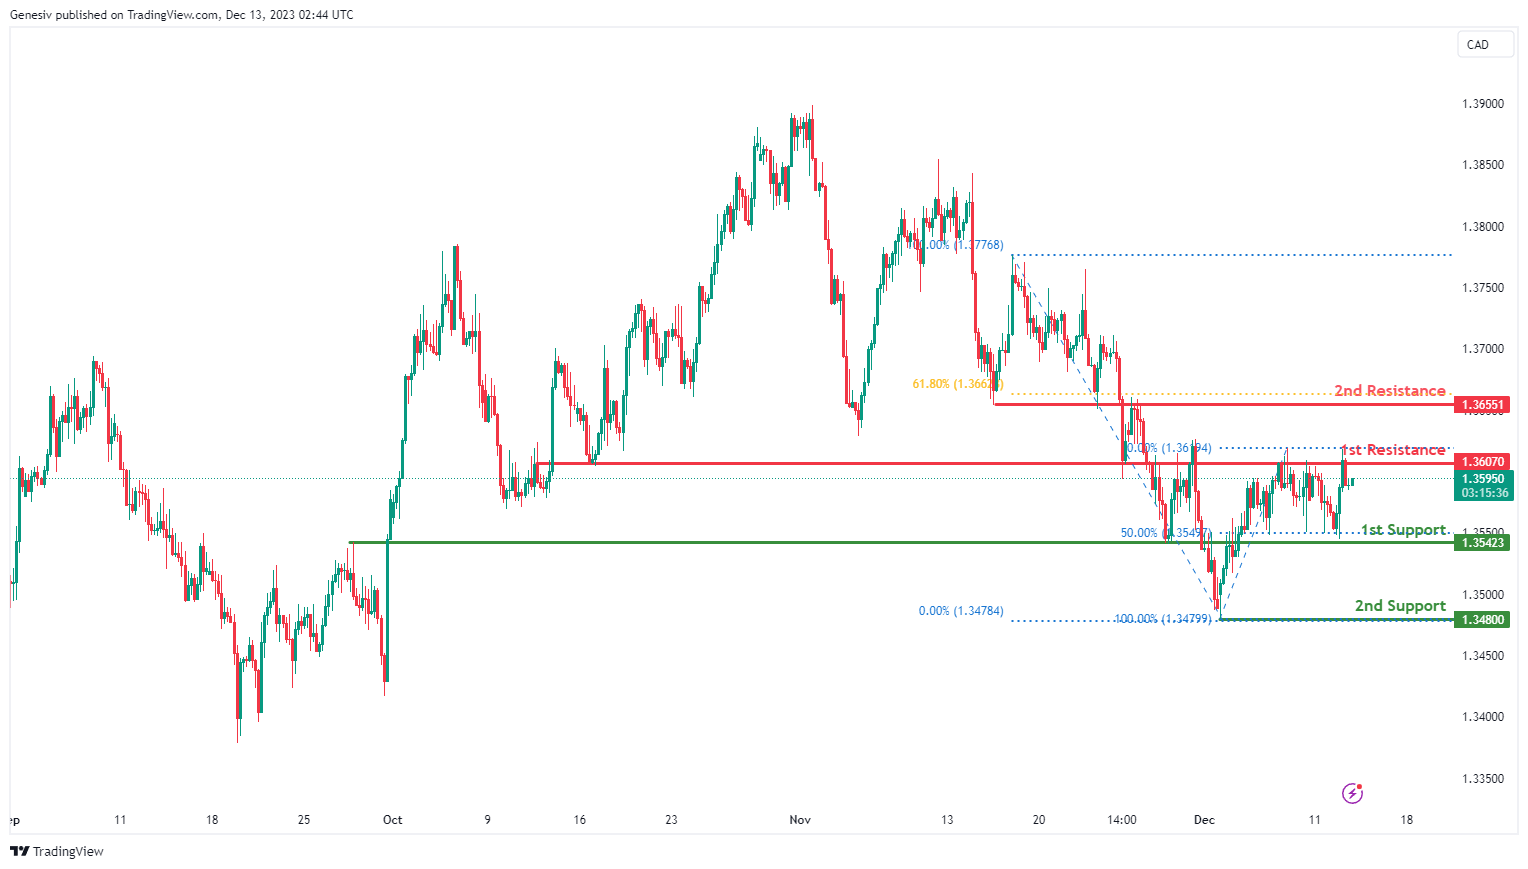
The USD/CAD chart currently exhibits an overall bullish momentum, indicating a prevailing upward trend. In this context, there is a potential scenario for price to make a bullish continuation towards the 1st resistance.
The 1st resistance level at 1.3607 is identified as an overlap resistance while the 2nd resistance level at 1.3655 is also noted as an overlap resistance that aligns close to the 61.80% Fibonacci retracement level, suggesting a potential barrier for further upside movement.
To the downside, the 1st support level at 1.3542 is identified as an overlap support that coincides with the 50.00% Fibonacci retracement level. Further below, the 2nd support level at 1.3480 is marked as a swing-low support, further reinforcing its importance as a key support level.
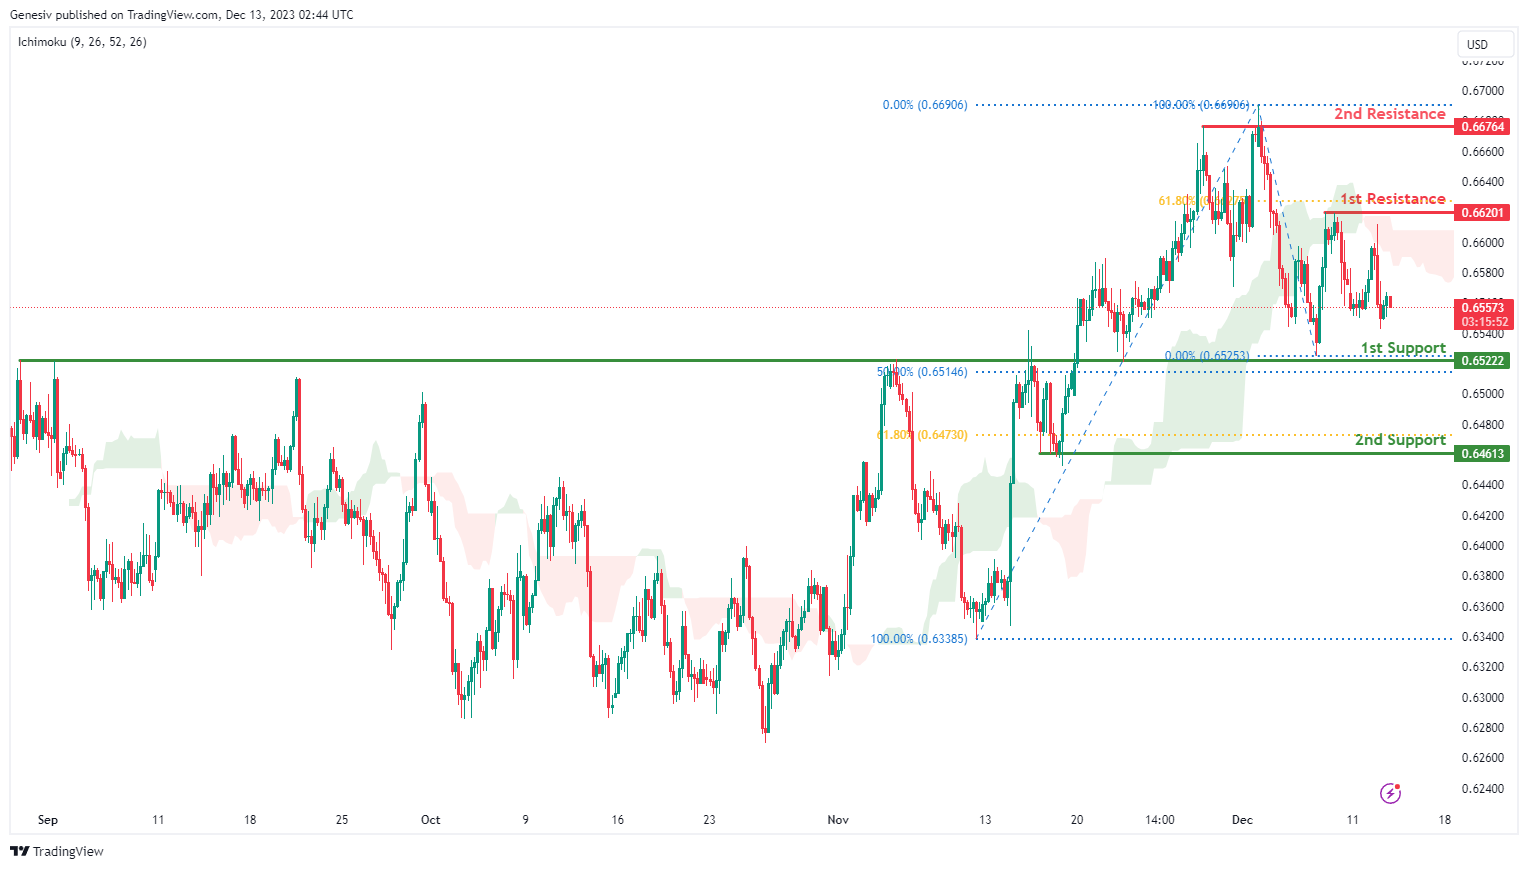
AUD/USD:
The AUD/USD chart currently exhibits an overall bearish momentum, indicating a prevailing downward trend with price trading under the bearish Ichimoku cloud. In this context, there is a potential scenario for price to make a bearish continuation towards the 1st support.
The 1st support level at 0.6522 is identified as an overlap support that aligns close to the 50.00% Fibonacci retracement level. Further below, the 2nd support level at 0.6461 is noted as a pullback support that aligns close to the 61.80% Fibonacci retracement level, reinforcing its importance as a significant support level.
On the resistance side, the 1st resistance level at 0.6620 is identified as a pullback resistance that aligns close to the 61.80% Fibonacci retracement level. Higher up, the 2nd resistance level at 0.6676 is also marked as a pullback resistance, indicating its potential significance as a resistance barrier for further upward movement.
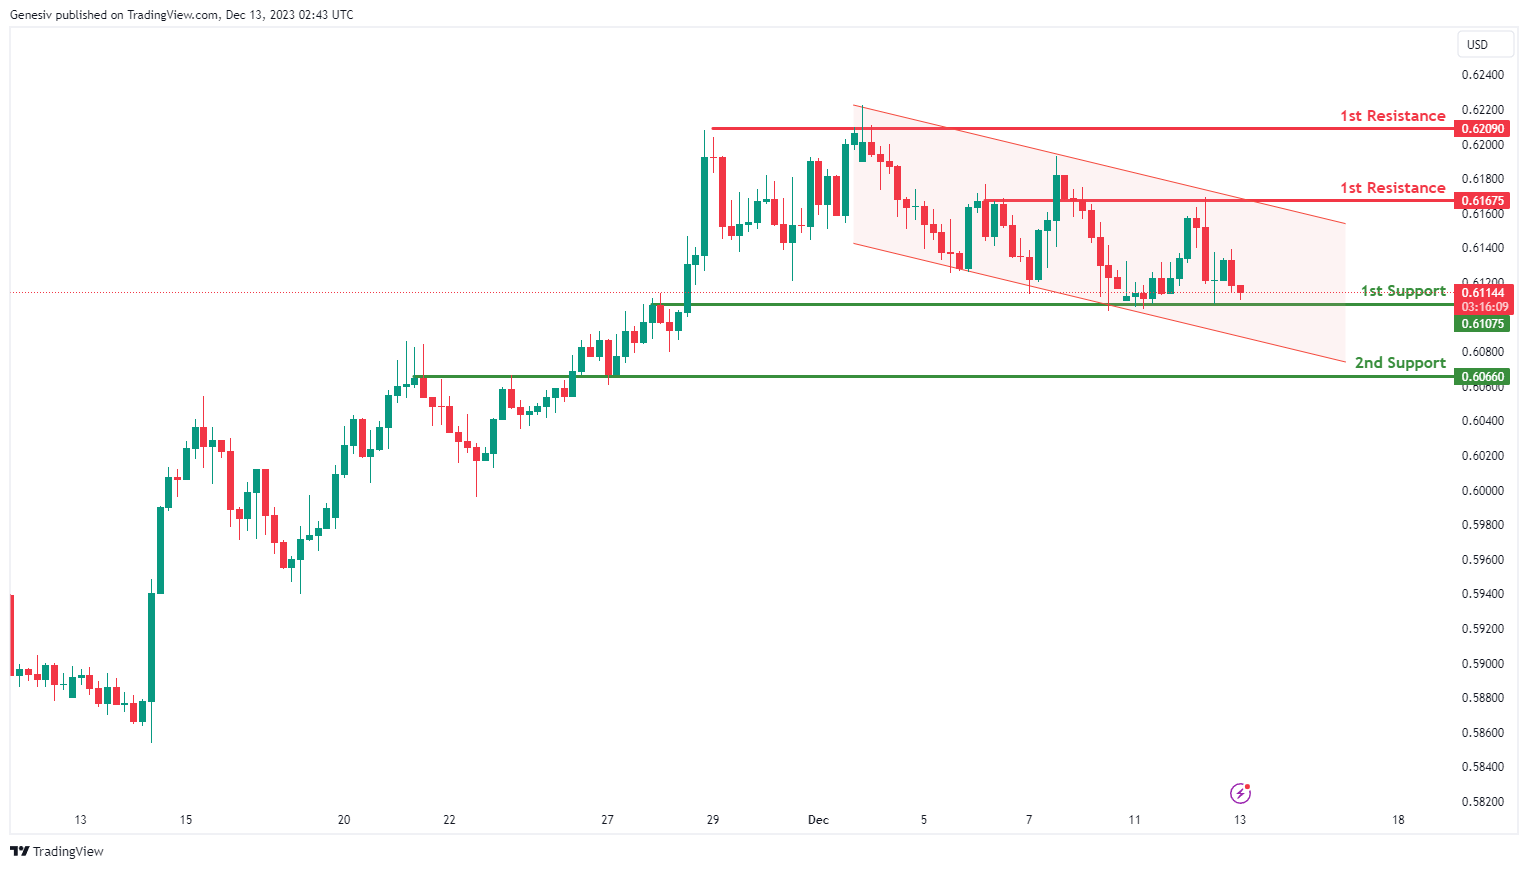
NZD/USD
The NZD/USD chart currently exhibits an overall bearish momentum, indicating a prevailing downward trend with price trading within the bearish channel. In this context, there is a potential scenario for price to break under the 1st support to make a bearish continuation towards the 2nd support.
The 1st support level at 0.6107 is identified as an overlap support while the 2nd support level at 0.6066 is also noted as an overlap support, further reinforcing its importance as a key support level.
On the resistance side, the 1st resistance level at 0.6167 is identified as a pullback resistance while the 2nd resistance level at 0.6209 is also marked as a pullback resistance, indicating its potential significance as barrier for further upward movement.
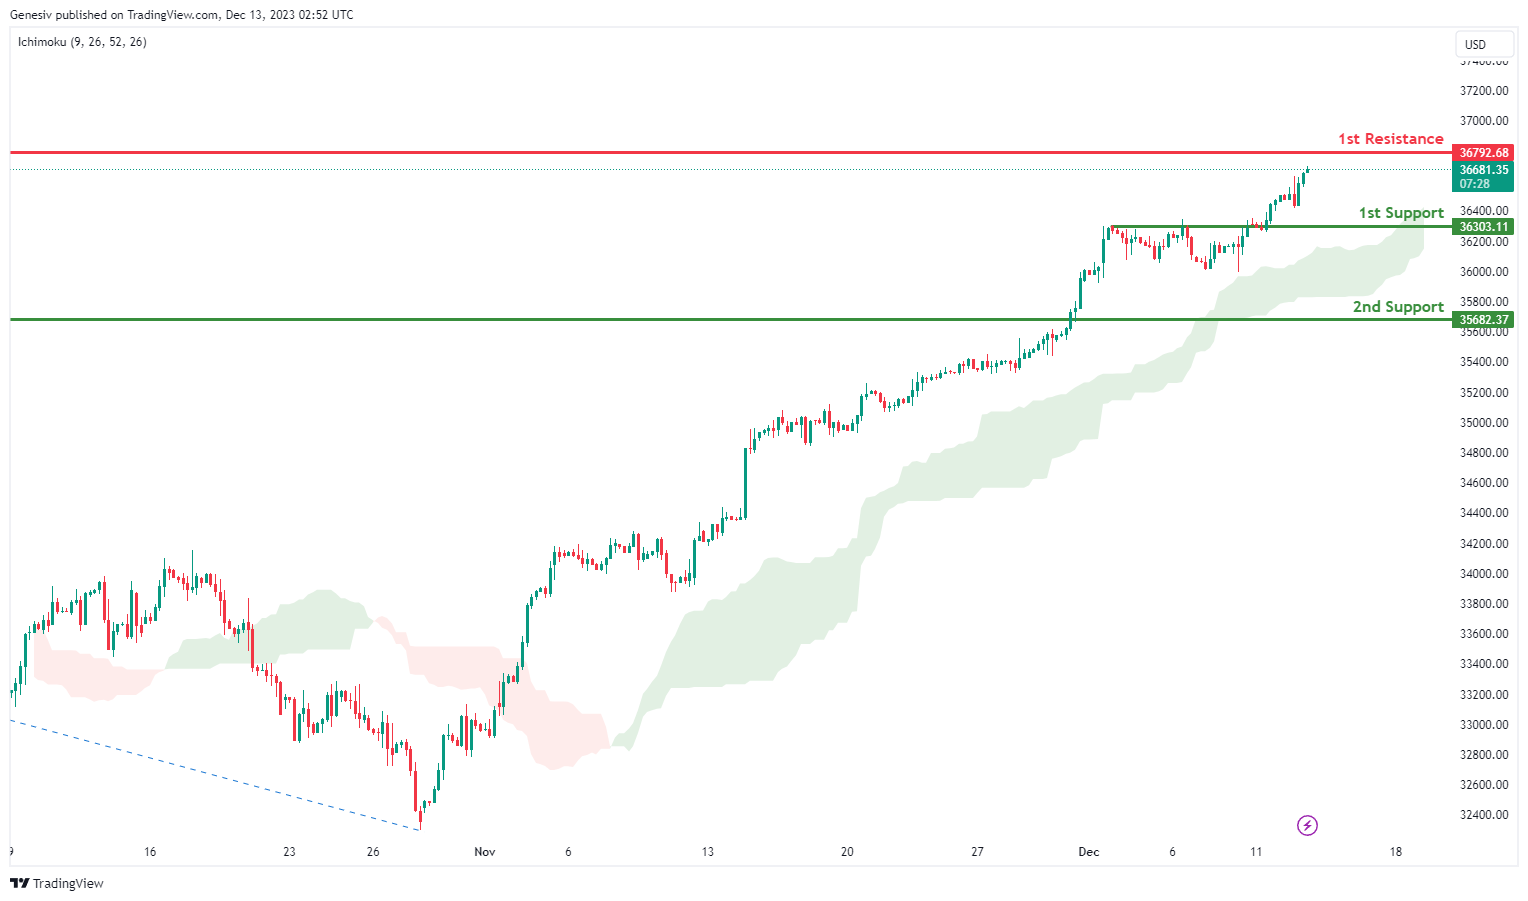
DJ30:
The DJ30 chart currently displays a bullish overall momentum, driven by the fact that the price is positioned above the bullish Ichimoku cloud, indicating favorable conditions for a potential bullish continuation.
In this scenario, the price could potentially continue its bullish momentum towards the 1st resistance.
The 1st support at 36303.11 is considered a significant level due to its classification as an overlap support. This suggests that historical price action aligns at this point, reinforcing its importance as a potential area where buying interest may emerge, providing support for the bullish trend.
Similarly, the 2nd support at 35682.37 is identified as a pullback support. This level represents a potential zone where the price could find support after a pullback, adding to the robustness of the overall support structure for the bullish momentum.
On the resistance side, the 1st resistance at 36792.68 is recognized as a swing high resistance. This level is likely to act as a barrier where selling interest could intensify, potentially causing a pause or reversal in the bullish trend.
Additionally, there is an intermediate resistance at 37842.61, associated with the 161.80% Fibonacci Extension. This Fibonacci level adds further significance to the resistance, indicating a potential area where selling pressure may increase, especially considering the extended nature of the move.
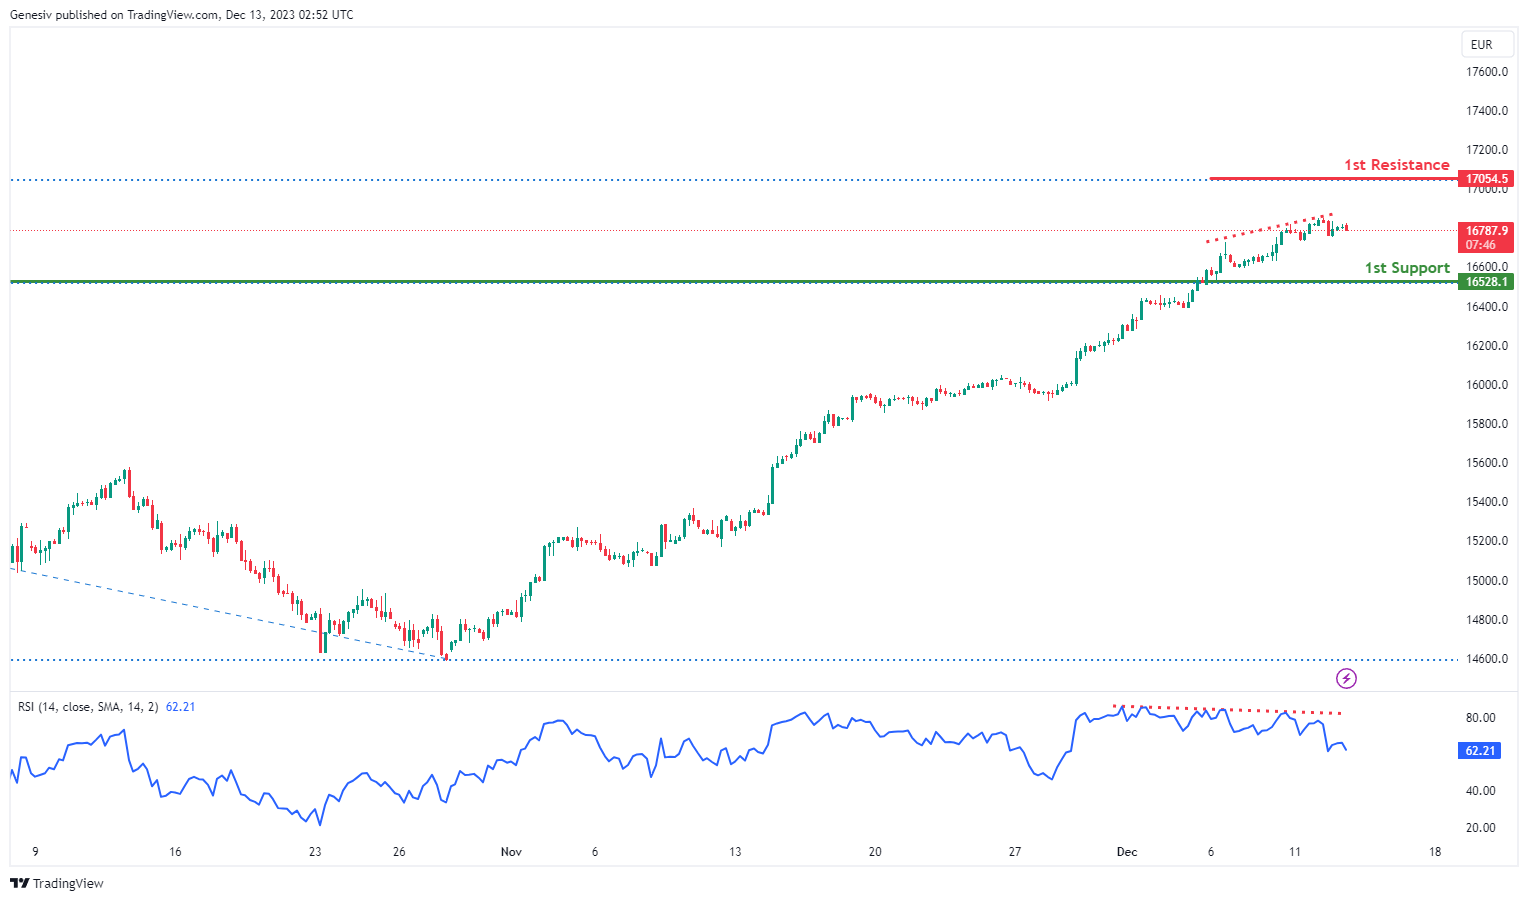
GER40:
The GER40 chart currently exhibits a bearish overall momentum, driven by bearish divergence signals. In this context, there is a potential for a bearish continuation towards the 1st support.
The 1st support at 16528.10 is considered significant as it represents a pullback support. This level indicates a potential area where buying interest may emerge after a pullback, providing support for the bearish continuation.
On the resistance side, the 1st resistance at 17054.50 is associated with the 127.20% Fibonacci Extension. This Fibonacci level adds importance to the resistance, suggesting that it could act as a barrier where selling interest might intensify, potentially causing a pause or reversal in the bearish trend.
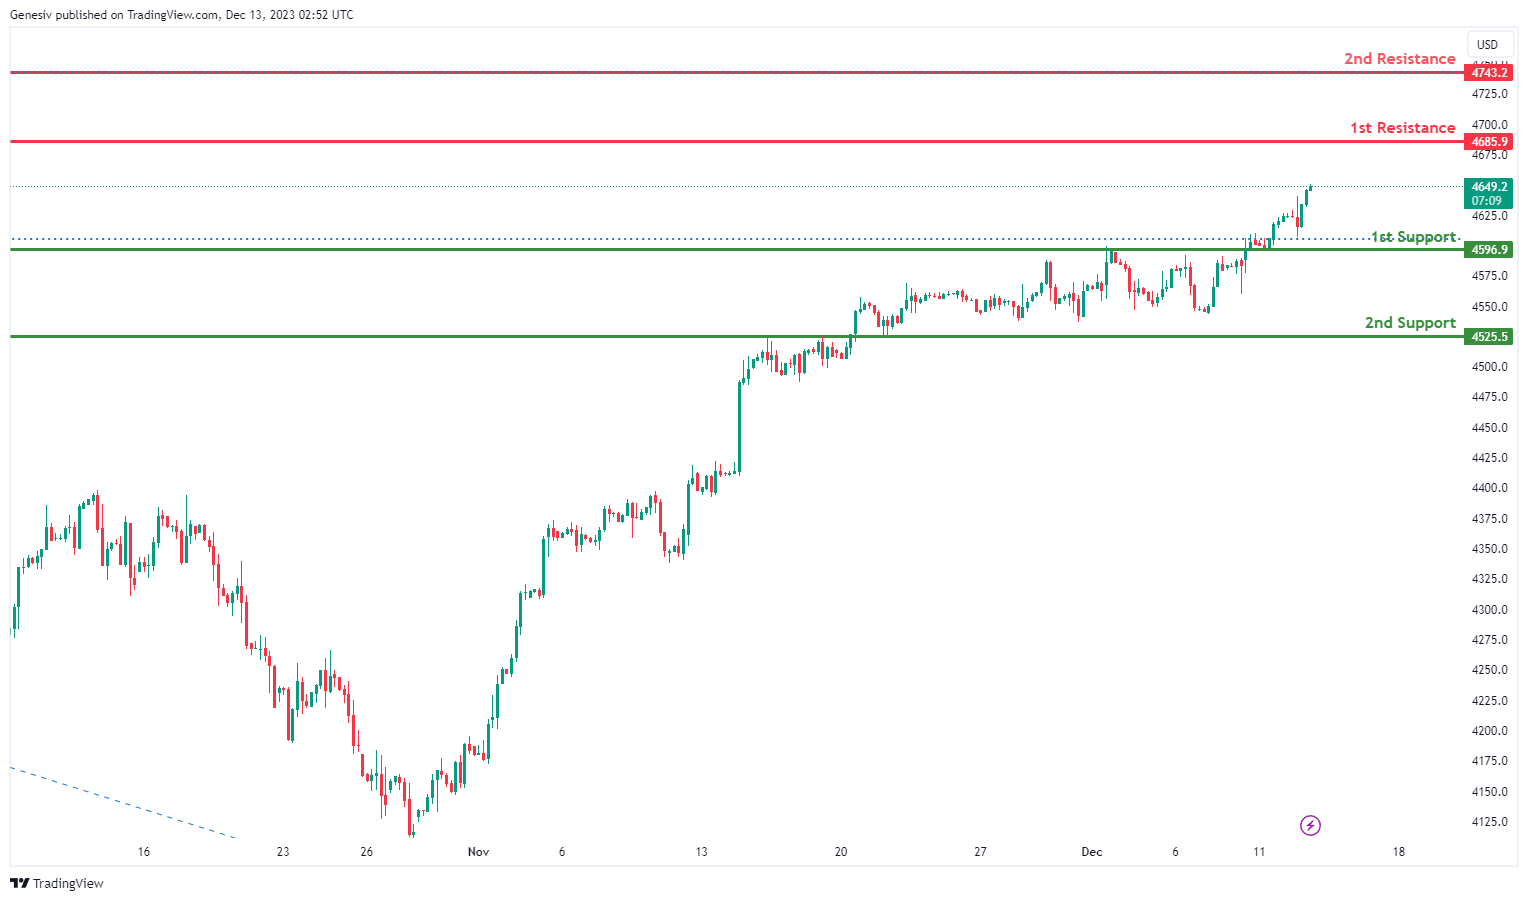
US500:
The US500 chart currently demonstrates a bullish overall momentum, suggesting a potential for a bullish continuation towards the 1st resistance.
The 1st support at 4596.9 holds significance as an overlap support. This level indicates a convergence of historical price points, reinforcing its potential as a crucial zone where buying interest may emerge. The overlap support suggests a strong foundation for the bullish trend to potentially find temporary support.
Similarly, the 2nd support at 4525.5 is also categorized as an overlap support. This further solidifies the support structure, indicating another zone where buying interest may be present. The dual presence of overlap support levels strengthens the overall support for a potential bullish continuation.
On the resistance side, the 1st resistance at 4685.9 is identified as a pullback resistance. This level is likely to act as a barrier where selling interest could intensify, potentially causing a pause or reversal in the bullish trend before pushing higher.
Furthermore, the 2nd resistance at 4743.2 is associated with both a swing high resistance and the 127.20% Fibonacci Extension. This confluence adds significant weight to the resistance, suggesting a potential area where selling pressure may increase, especially considering the presence of both technical and Fibonacci-based resistance.
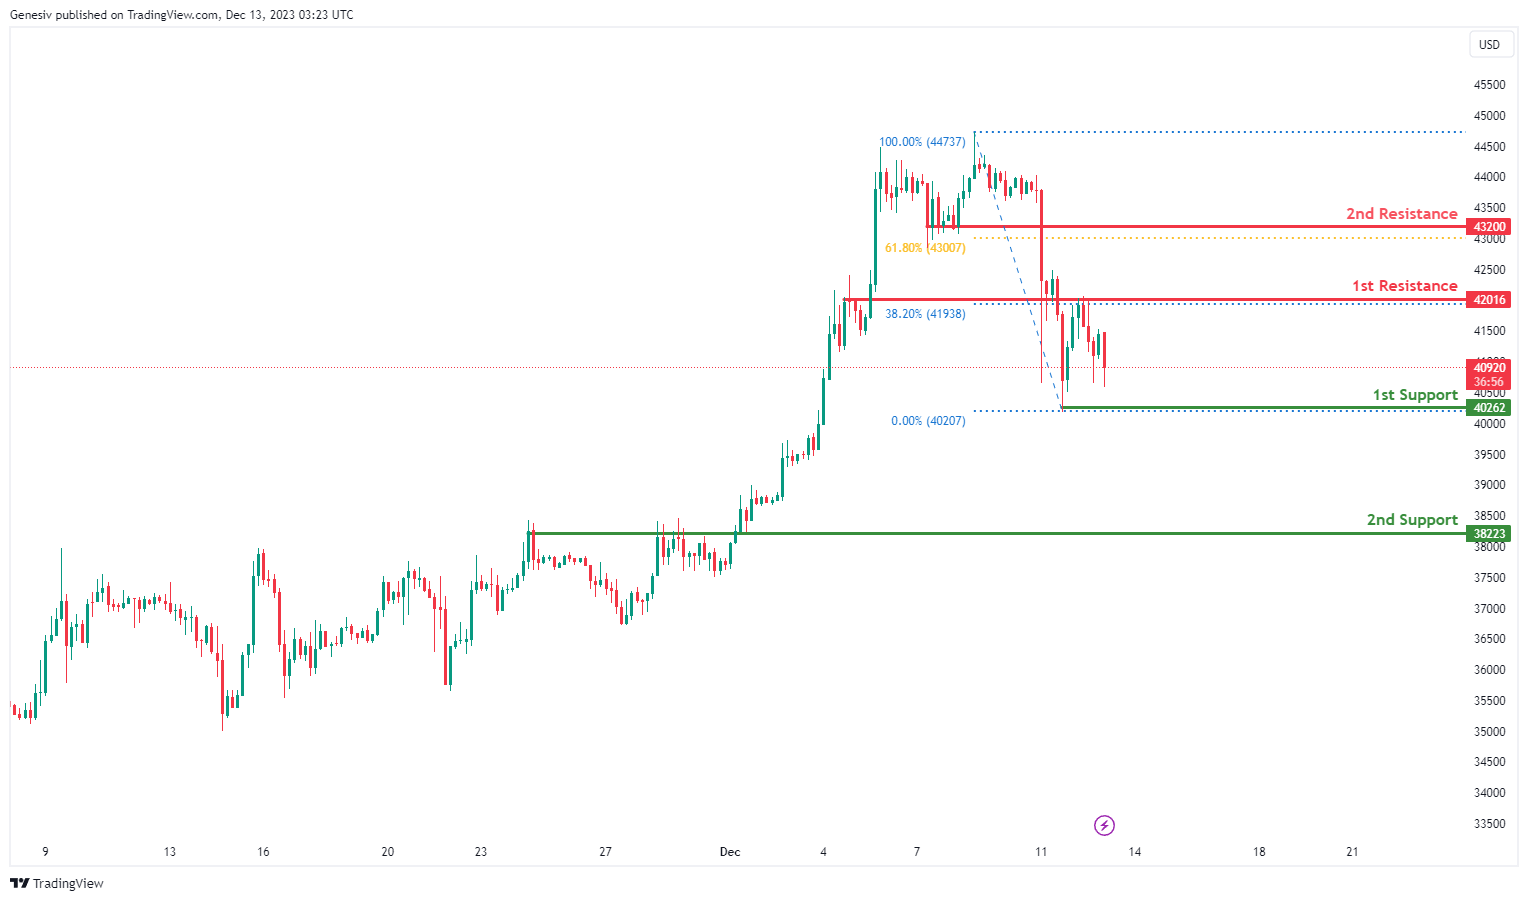
BTC/USD:
The BTC/USD chart currently exhibits a bearish overall momentum, and there is a potential scenario where the price reacts bearishly off the 1st resistance and drops towards the 1st support.
The 1st support at 40262 is considered significant as it represents a pullback support. This level suggests a potential area where buying interest may emerge, providing support for the cryptocurrency and potentially causing a bounce or reversal from the bearish trend.
Similarly, the 2nd support at 38223 is categorized as an overlap support. This adds an additional layer of significance to the support level, indicating a convergence of historical price points and strengthening the potential for this zone to act as a crucial area for buyers.
On the resistance side, the 1st resistance at 42016 is identified as both a pullback resistance and the 38.20% Fibonacci Retracement level. This confluence adds weight to the resistance, suggesting a potential area where selling interest may intensify, leading to a bearish reaction and a subsequent drop in price.
Furthermore, the 2nd resistance at 43200 is associated with both a pullback resistance and the 61.80% Fibonacci Retracement level. This level further strengthens the resistance, indicating another zone where selling pressure may increase, aligning with the Fibonacci retracement, a commonly observed technical level.
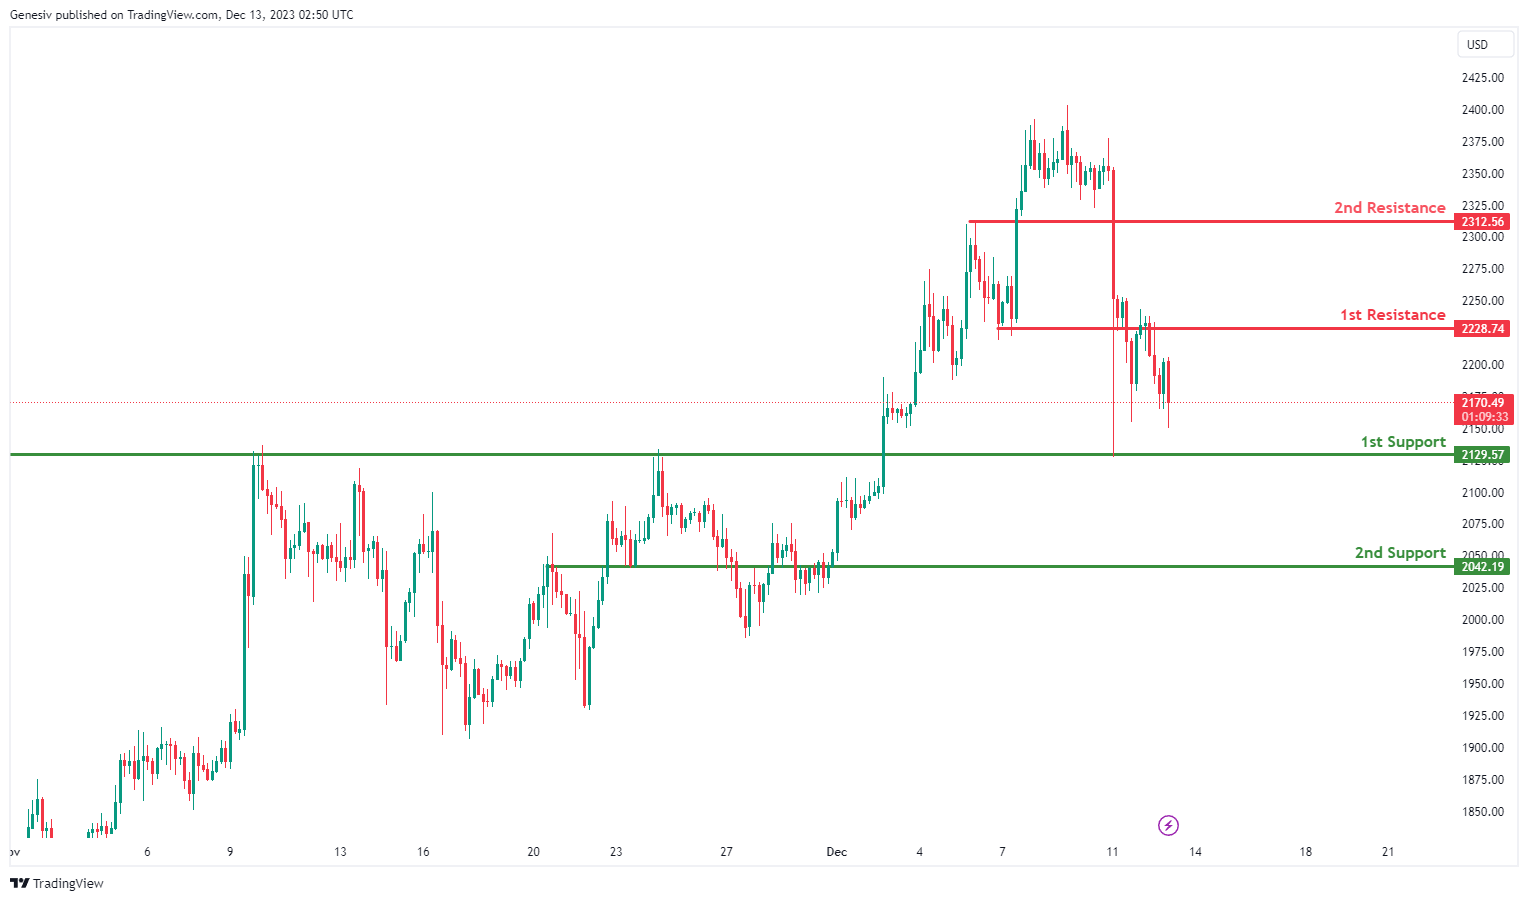
ETH/USD:
The ETH/USD chart currently exhibits a bullish overall momentum, indicating a potential for a bullish continuation towards the 1st resistance.
The 1st support at 21229.57 is considered significant as it represents an overlap support. This level suggests a convergence of historical price points, reinforcing its potential as a crucial area where buying interest may emerge, providing support for the cryptocurrency.
Similarly, the 2nd support at 2042.19 is categorized as an overlap support. This adds an additional layer of significance to the support level, indicating a zone where historical price action aligns, and buyers may find significant interest.
On the resistance side, the 1st resistance at 2228.74 is identified as an overlap resistance. This level may act as a barrier where selling interest could intensify, potentially causing a temporary pause or reversal in the bullish trend.
Furthermore, the 2nd resistance at 2312.56 is associated with a swing high resistance. This level further strengthens the resistance, indicating a potential area where selling pressure may increase, especially considering its alignment with a previous swing high.
WTI/USD:
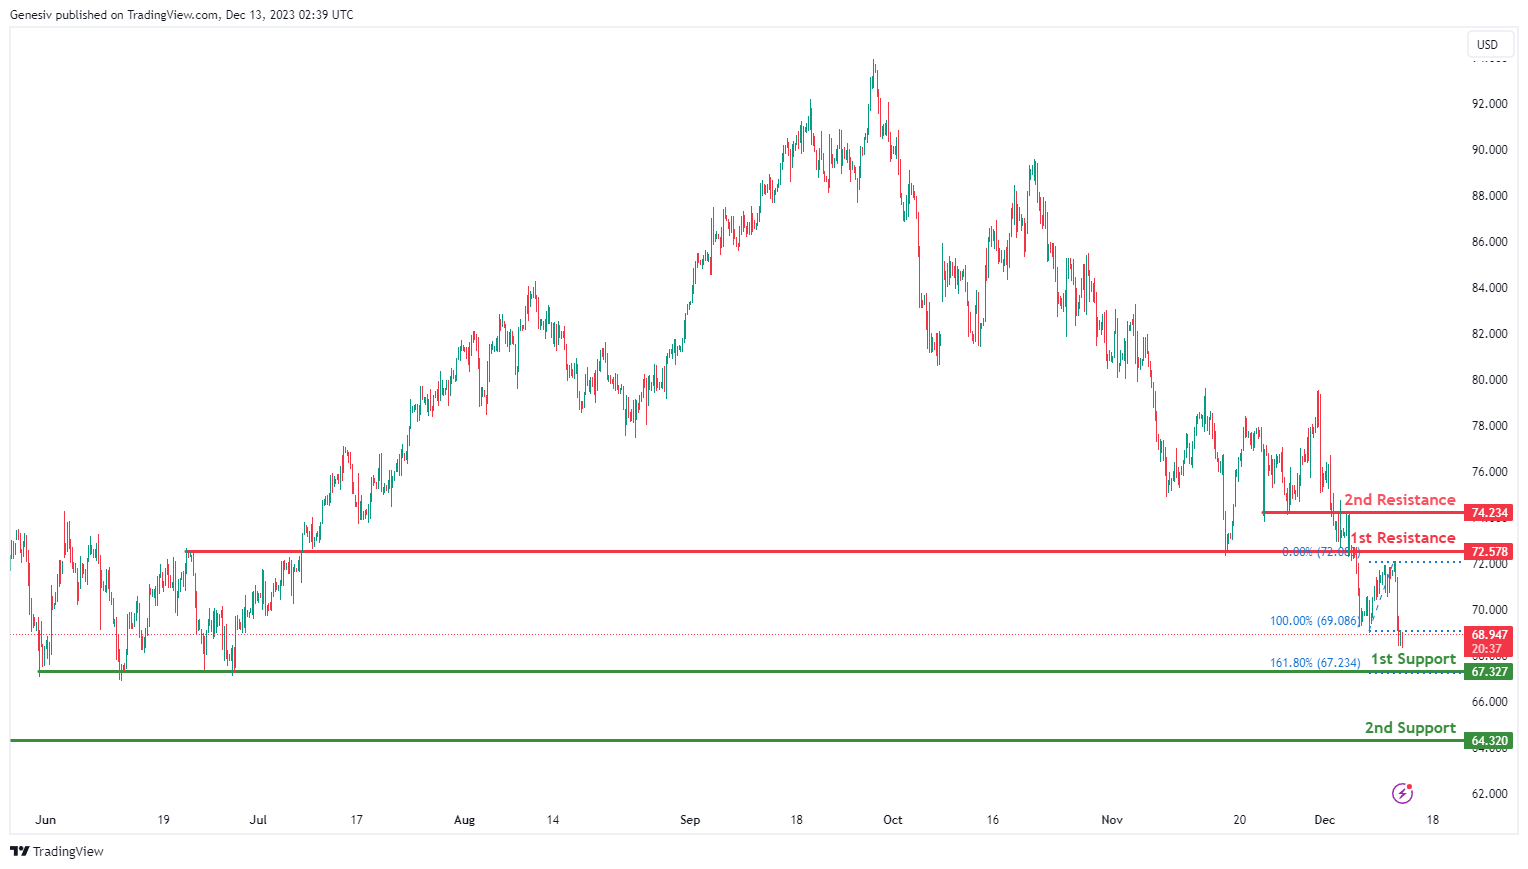
The WTI chart currently exhibits an overall bearish momentum, suggesting a prevailing downward trend. Within this context, there is a potential for price to make a bearish continuation towards the 1st support.
The 1st support level at 67.32 is identified as a pullback support that aligns with the 161.80% Fibonacci extension level. Further below, the 2nd support level at 64.32 is noted as multi-swing-low support, reinforcing its importance as a key support level.
On the resistance side, the 1st resistance level at 72.57 is identified as an overlap resistance. Higher up, the 2nd resistance level at 74.23 is also marked as an overlap resistance, further indicating its potential significance as a barrier for further upward movement.
XAU/USD (GOLD):
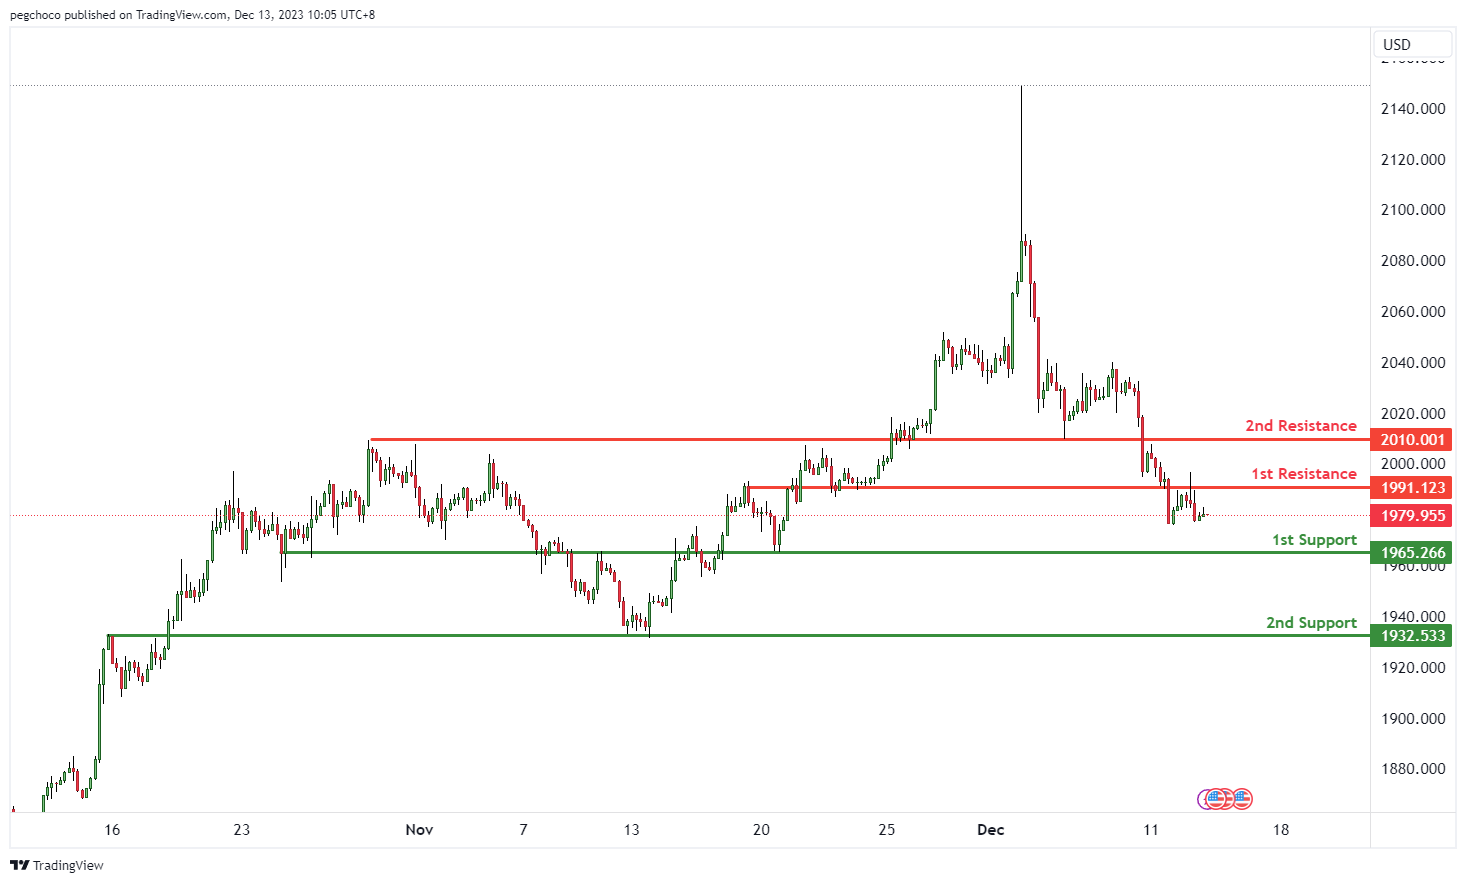
The XAU/USD chart currently exhibits a bearish overall momentum, indicating a downward trend. Price could potentially continue in a bearish direction towards the 1st support level.
The 1st support at 1965.26 is identified as an overlap support, which means it has previously acted as a significant price level where buying interest emerged. This level is worth monitoring as it could potentially provide a temporary pause in the downward movement.
The 2nd support at 1932.53 is also categorized as an overlap support and is another area to watch for potential support. It has historical significance as a price level where buyers have stepped in before.
On the resistance side, the 1st resistance at 1991.12 is identified as an overlap resistance, indicating a level where selling interest may increase, potentially causing a bearish continuation.
Further up, the 2nd resistance at 2010.00 is also categorized as an overlap resistance and represents another potential barrier where selling pressure could intensify.


