
DXY:
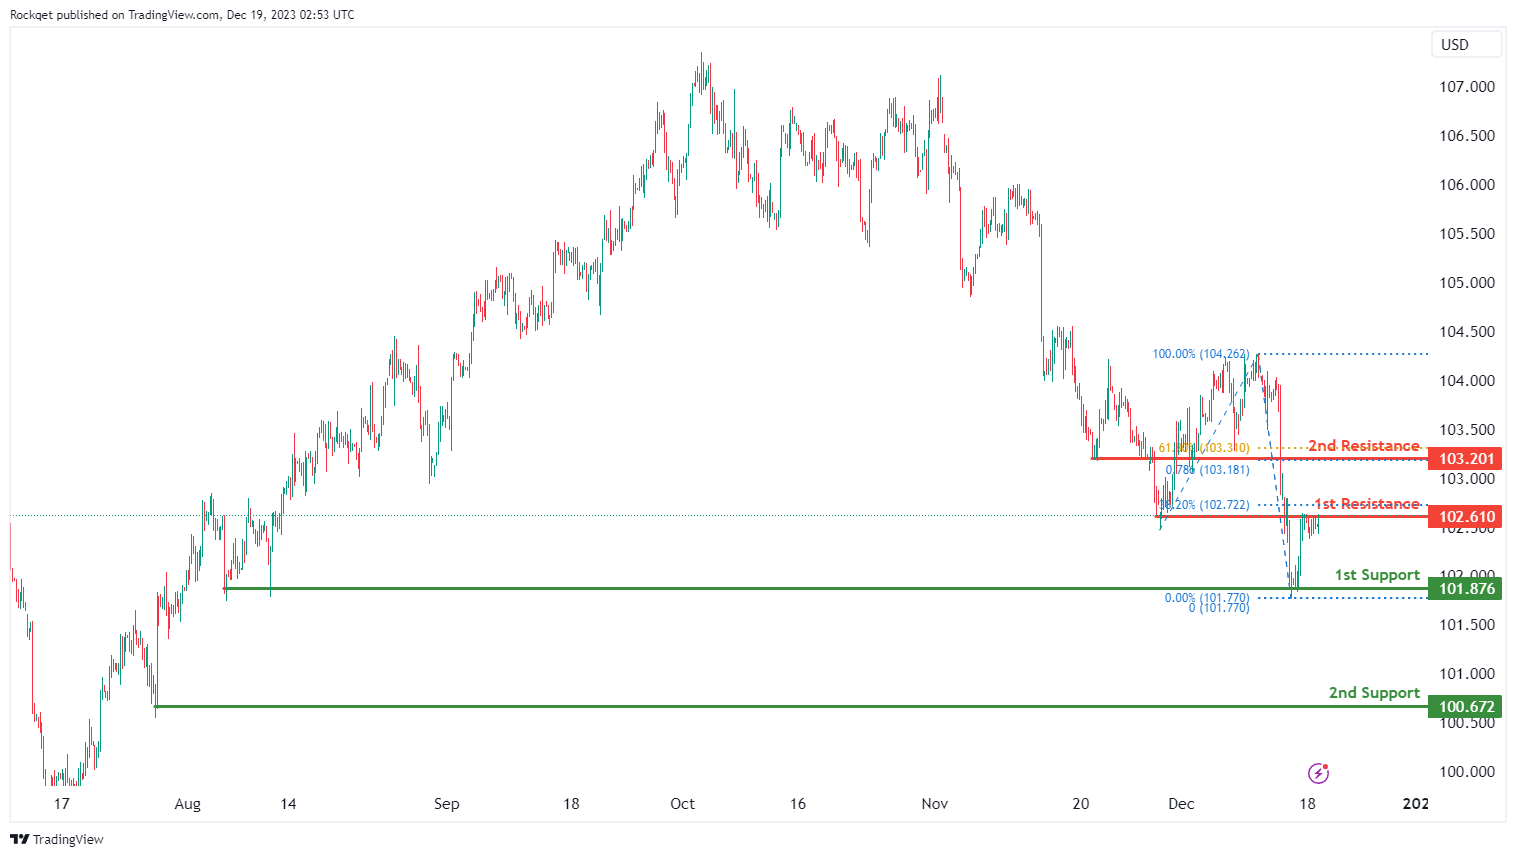
The DXY (US Dollar Index) chart currently shows an overall bearish momentum, indicating a potential for price to make a bearish reaction off the 1st resistance and fall towards the 1st support.
The 1st resistance level at 102.61 is identified as an overlap resistance that aligns close to the 38.20% Fibonacci retracement level. Higher up, the 2nd resistance level at 103.20 is also marked as an overlap resistance that aligns with a confluence of Fibonacci levels i.e. the 61.80% retracement and the 78.60% projection levels, suggesting a potential barrier for further upside movement.
To the downside, the 1st support level at 101.87 is identified as a multi-swing-low support. Further below, the 2nd support level at 100.67 is noted as a swing-low, further reinforcing its importance as a potential key support level.
EUR/USD:
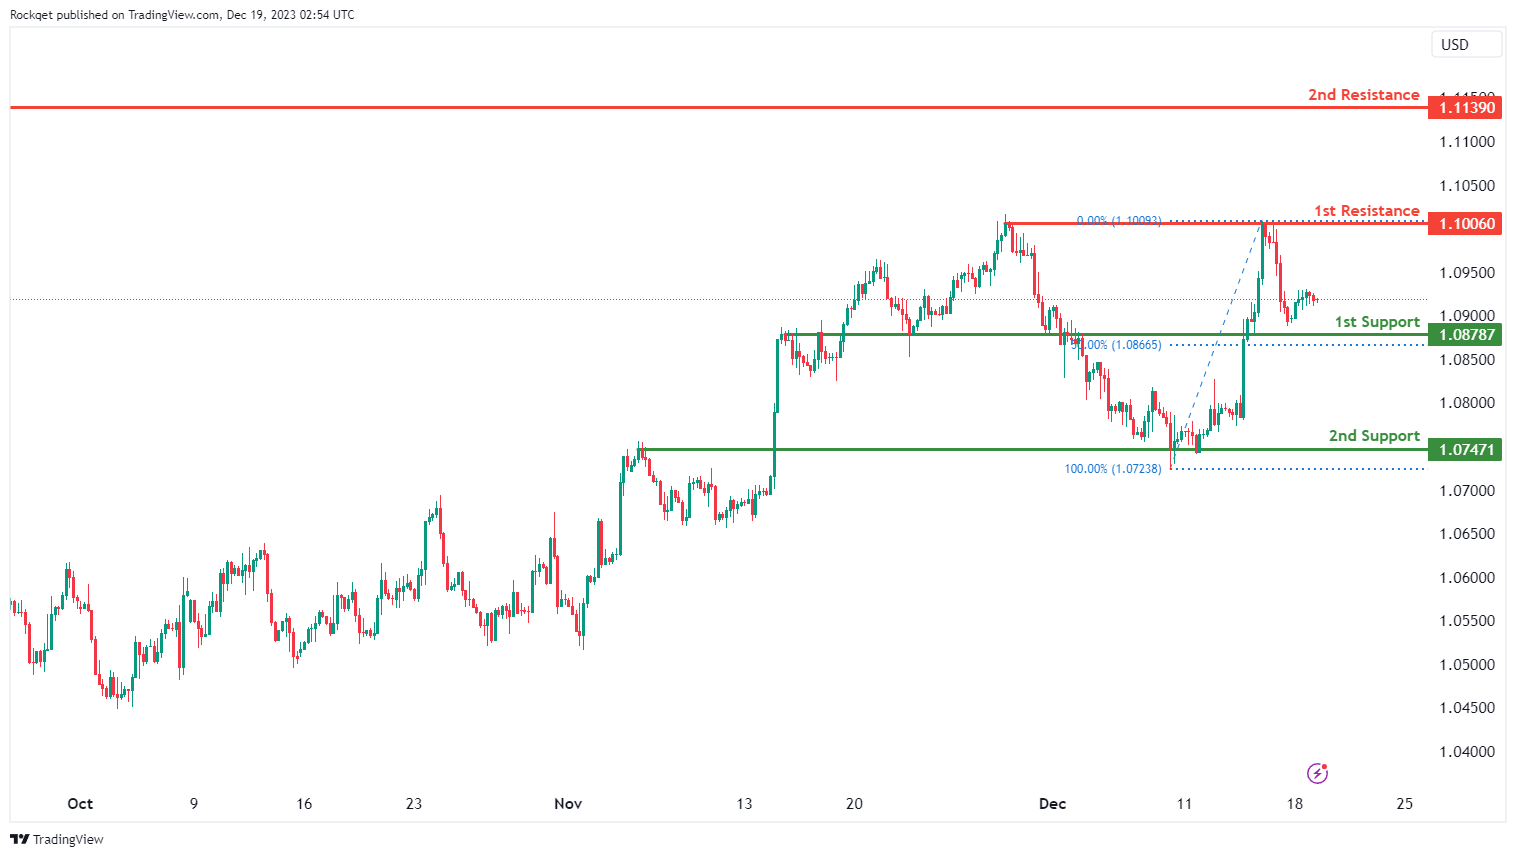
The EUR/USD chart currently exhibits an overall bearish momentum. In this context, there is a potential scenario for price to make a bearish continuation towards the 1st support.
The 1st support level at 1.0878 is identified as an overlap support that aligns close to the 50.00% Fibonacci retracement level. Further below, the 2nd support level at 1.0747 is also marked as an overlap support, further reinforcing its importance as a potential key support level.
To the upside, the 1st resistance level at 1.1006 is identified as a multi-swing-high resistance. Higher up, the 2nd resistance level at 1.1139 is noted as a swing-high resistance, suggesting a potential barrier for further upside movement.
EUR/JPY:
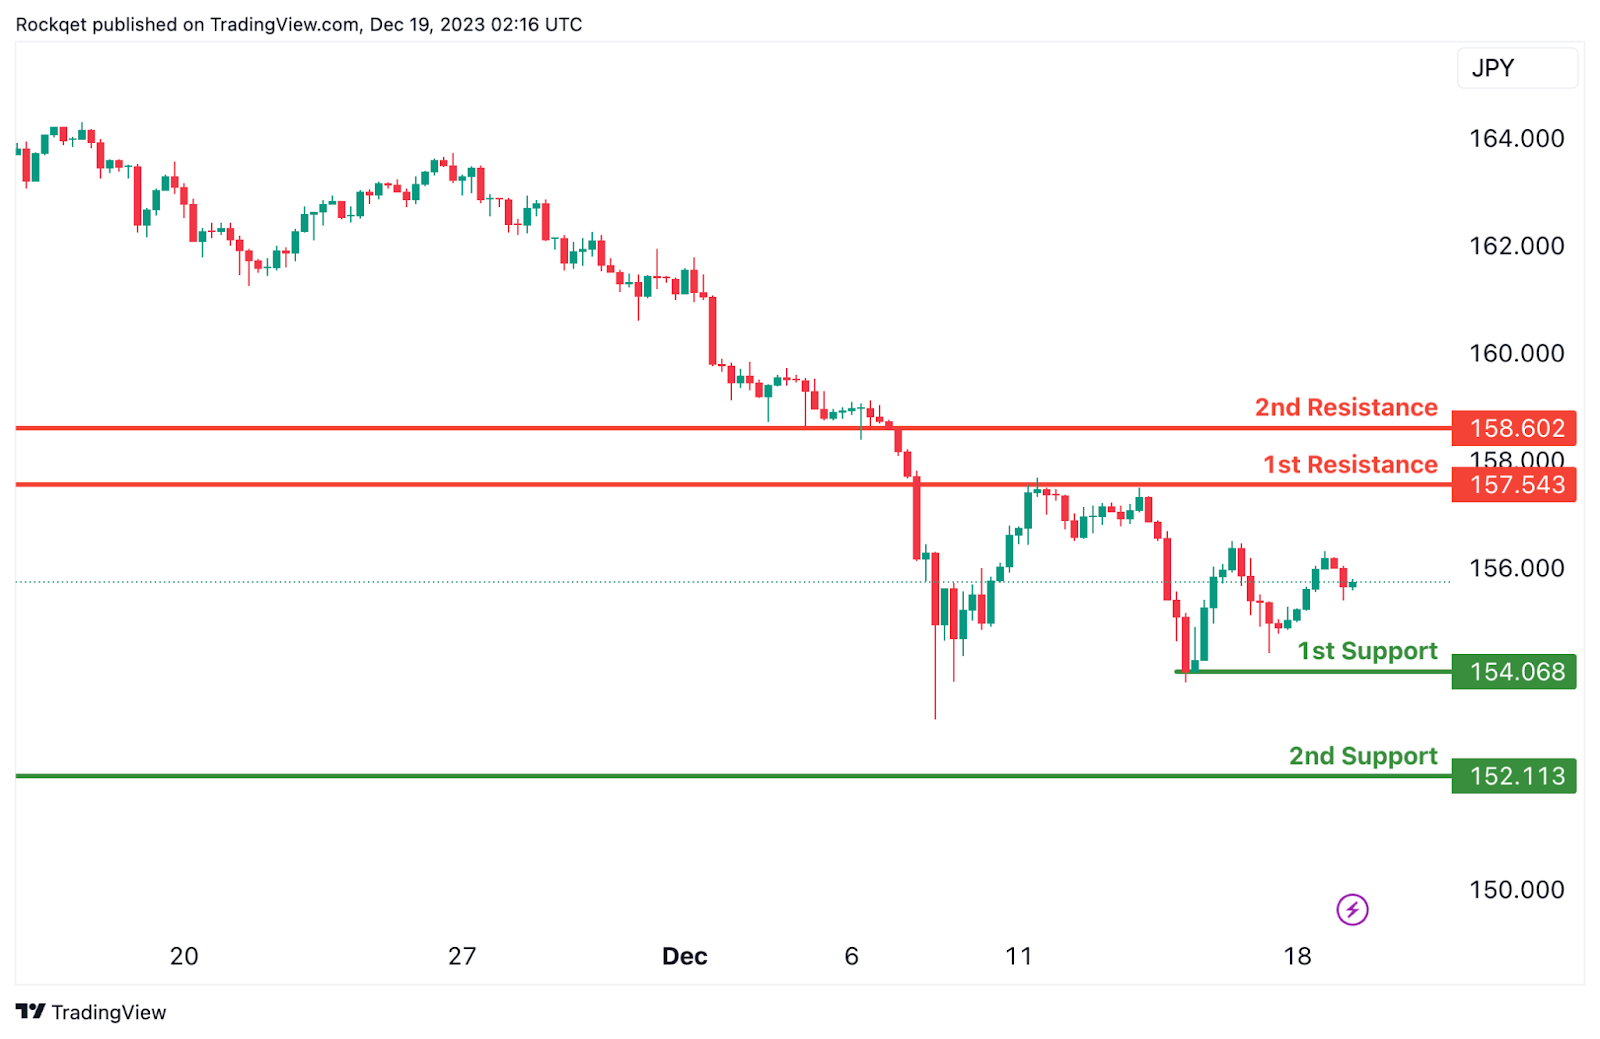
The EUR/JPY chart currently exhibits a neutral overall momentum, suggesting a potential scenario where the price could fluctuate between the 1st resistance and the 1st support level.
The 1st support at 154.07 is considered significant as it represents a pullback support. This level indicates a potential area where buying interest may emerge after a pullback, providing support for the currency pair.
Similarly, the 2nd support at 152.11 is identified as a swing low support. This adds another layer of potential support for EUR/JPY, indicating a zone where buying interest may be present, particularly considering its alignment with a swing low.
On the resistance side, the 1st resistance at 157.54 is associated with a pullback resistance. This level may act as a barrier where selling interest could intensify, potentially causing a temporary pause or reversal in the neutral trend.
Furthermore, the 2nd resistance at 158.60 is characterized as an overlap resistance. This adds another layer of significance to the resistance, suggesting a potential area where selling pressure may increase, especially considering its alignment with an overlap level.
EUR/GBP:
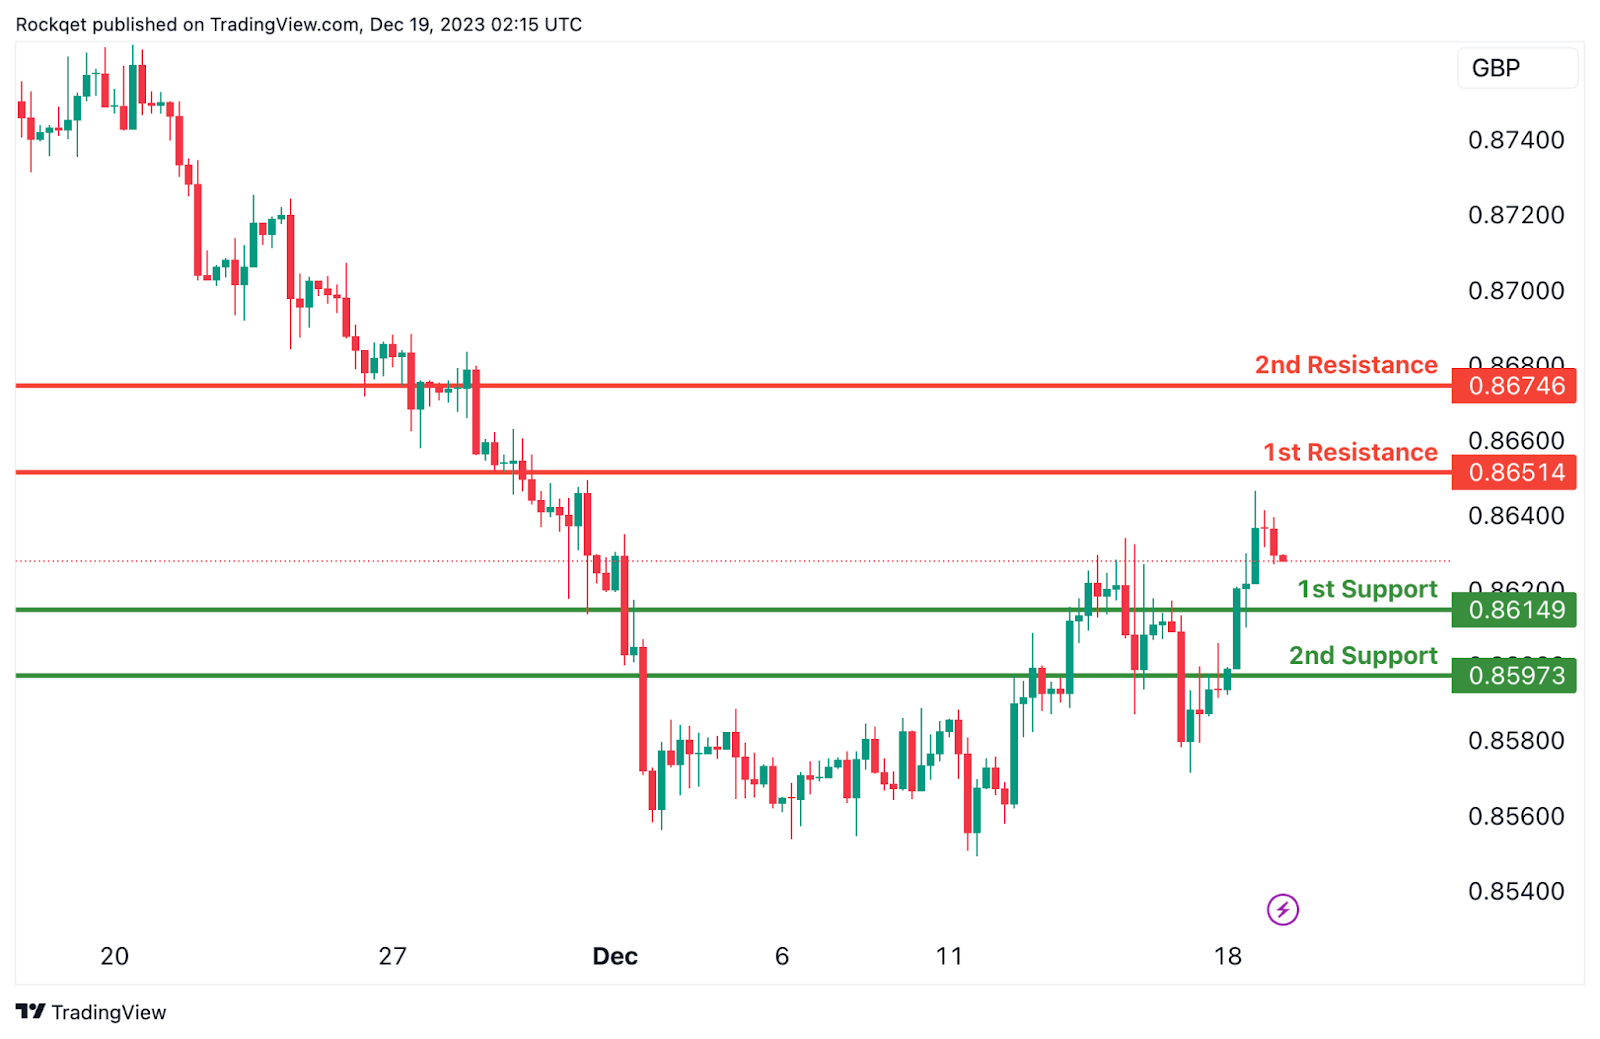
The EUR/GBP chart currently has a bearish overall momentum, and there is a potential scenario for a bearish continuation towards the 1st support.
The 1st support at 0.8615 is considered significant as it represents an overlap support. This level indicates a historical area where buying interest has been present, reinforcing its potential as a crucial support zone.
Similarly, the 2nd support at 0.8597 is identified as a pullback support. This adds another layer of potential support for the currency pair, indicating a zone where buying interest may emerge after a pullback.
On the resistance side, the 1st resistance at 0.8651 is associated with a pullback resistance. This level may act as a barrier where selling interest could intensify, potentially causing a temporary pause or reversal in the bearish trend.
Furthermore, the 2nd resistance at 0.8675 is characterized as an overlap resistance. This adds another layer of significance to the resistance, suggesting a potential area where selling pressure may increase, especially considering its alignment with an overlap level.
GBP/USD:
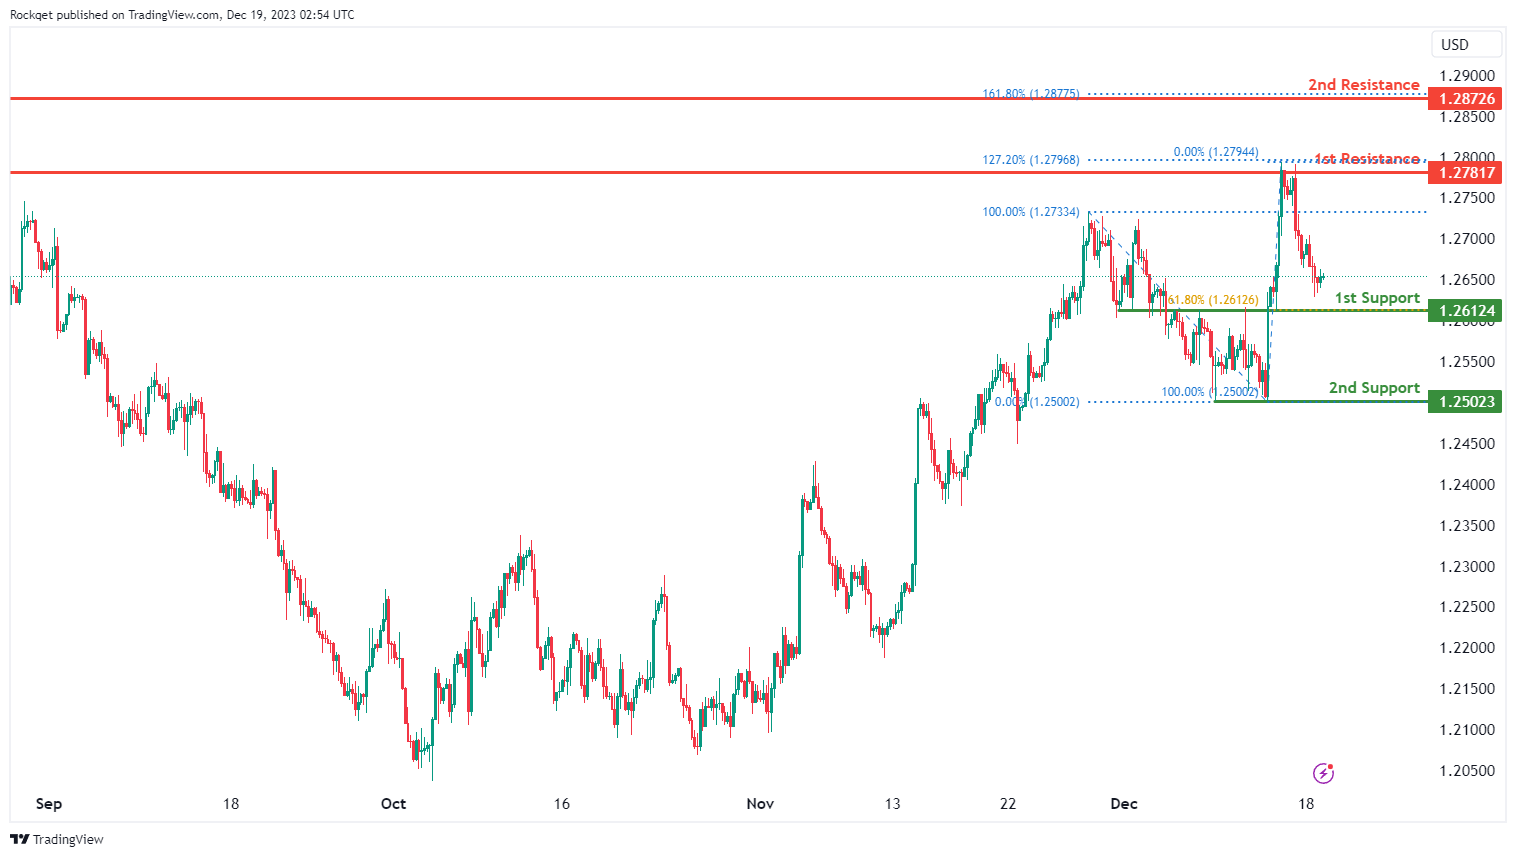
The GBP/USD chart currently exhibits an overall bearish momentum. In this context, there is a potential scenario for price to make a bearish continuation towards the 1st support.
The 1st support level at 1.2612 is identified as an overlap support that aligns with the 61.80% Fibonacci retracement level. Further below, the 2nd support level at 1.2502 is marked as a swing-low support, further reinforcing its importance as a potential key support level.
To the upside, the 1st resistance level at 1.2781 is identified as a multi-swing-high resistance that aligns with the 127.20% Fibonacci extension level. Higher up, the 2nd resistance level at 1.2872 is noted as a pullback resistance that aligns with the 161.80% Fibonacci extension level, suggesting a potential barrier for further upside movement.
GBP/JPY:
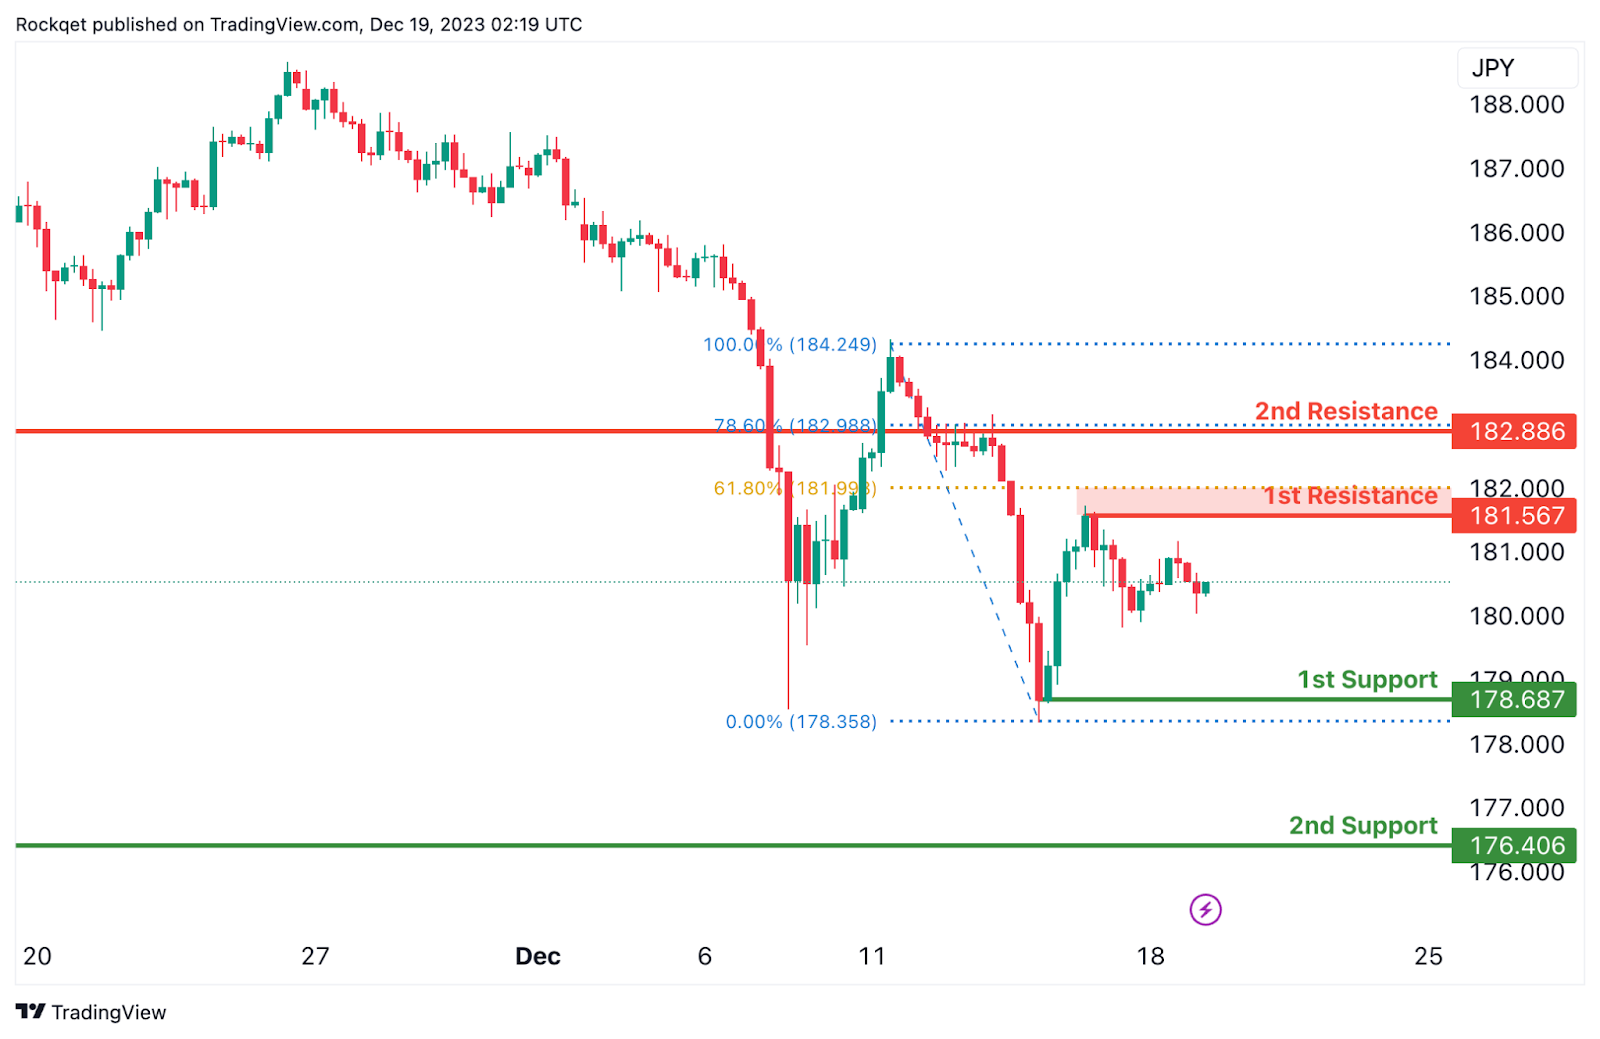
The GBP/JPY chart currently has a bearish overall momentum, suggesting a potential scenario for a bearish continuation towards the 1st support.
The 1st support at 178.69 is considered significant as it represents a swing low support. This level indicates a historical area where buying interest has been present, reinforcing its potential as a crucial support zone.
Similarly, the 2nd support at 176.41 is identified as a pullback support. This adds another layer of potential support for the currency pair, indicating a zone where buying interest may emerge after a pullback.
On the resistance side, the intermediate resistance at 181.57 is associated with a pullback resistance and the 61.80% Fibonacci Retracement level. This level may act as a barrier where selling interest could intensify, potentially causing a temporary pause or reversal in the bearish trend.
Furthermore, the 1st resistance at 182.89 is characterized as an overlap resistance and coincides with the 78.60% Fibonacci Retracement level. This adds another layer of significance to the resistance, suggesting a potential area where selling pressure may increase.
USD/CHF:
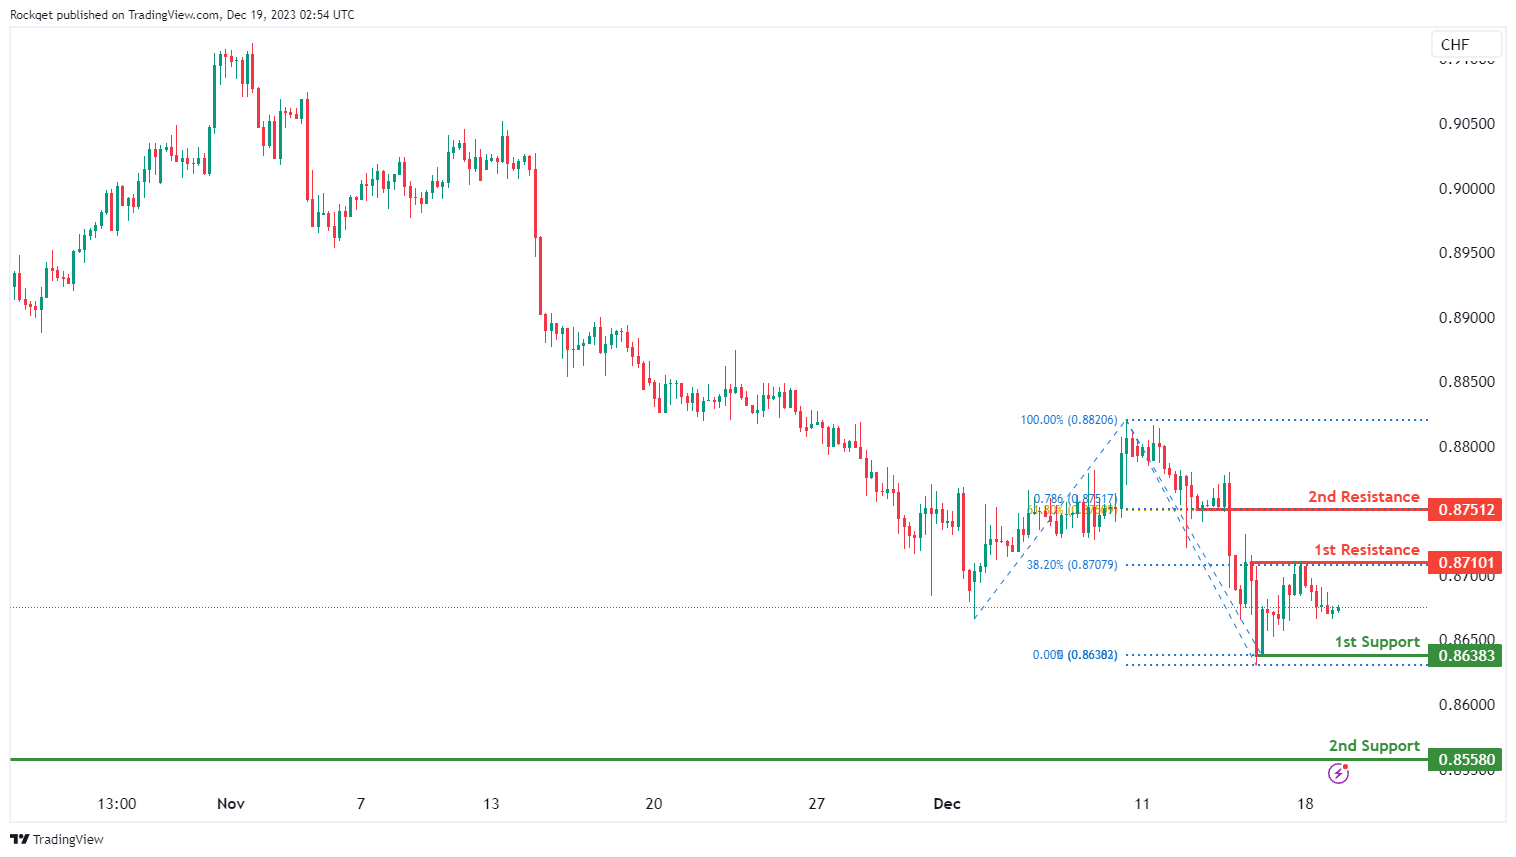
The USD/CHF chart currently exhibits an overall bearish momentum. In this context, there is a potential scenario for price to make a bearish continuation towards the 1st support.
The 1st support level at 0.8638 is identified as a pullback support. Further below, the 2nd support level at 0.8558 is noted as a multi-swing-low, further reinforcing its importance as a key support level.
To the upside, the 1st resistance level at 0.8710 is identified as a pullback resistance that aligns with the 38.20% Fibonacci retracement level. Higher up, the 2nd resistance level at 0.8751 is also marked as a pullback resistance that aligns with a confluence of Fibonacci levels i.e. the 61.80% retracement and the 78.60% projection levels, suggesting a potential barrier for further upside movement.
USD/JPY:
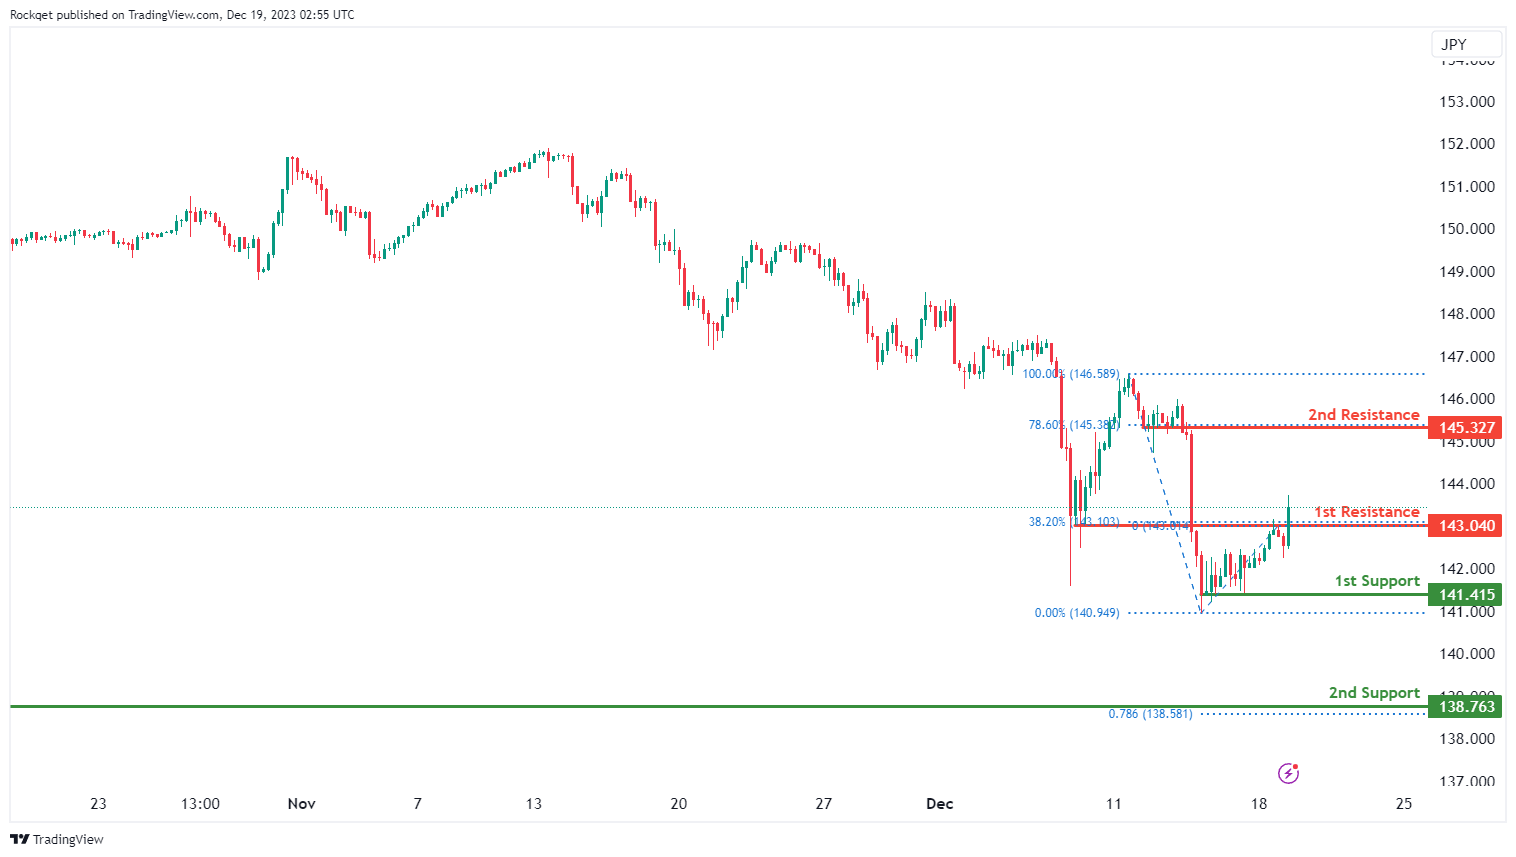
The USD/JPY chart currently exhibits an overall bullish momentum, indicating a potential for price to break above the 1st resistance and make a bullish continuation towards the 2nd resistance.
The 1st resistance level at 143.04 is identified as an overlap resistance that aligns with the 38.20% Fibonacci retracement level. Higher up, the 2nd resistance level at 145.32 is marked as a pullback resistance that aligns with the 78.60% Fibonacci retracement level, suggesting a potential barrier for further upside movement.
To the downside, the 1st support level at 141.41 is identified as a pullback support. Further below, the 2nd support level at 138.76 is noted as a swing-low support that aligns with the 78.60% Fibonacci projection level, further reinforcing its importance as a key support level.
USD/CAD:
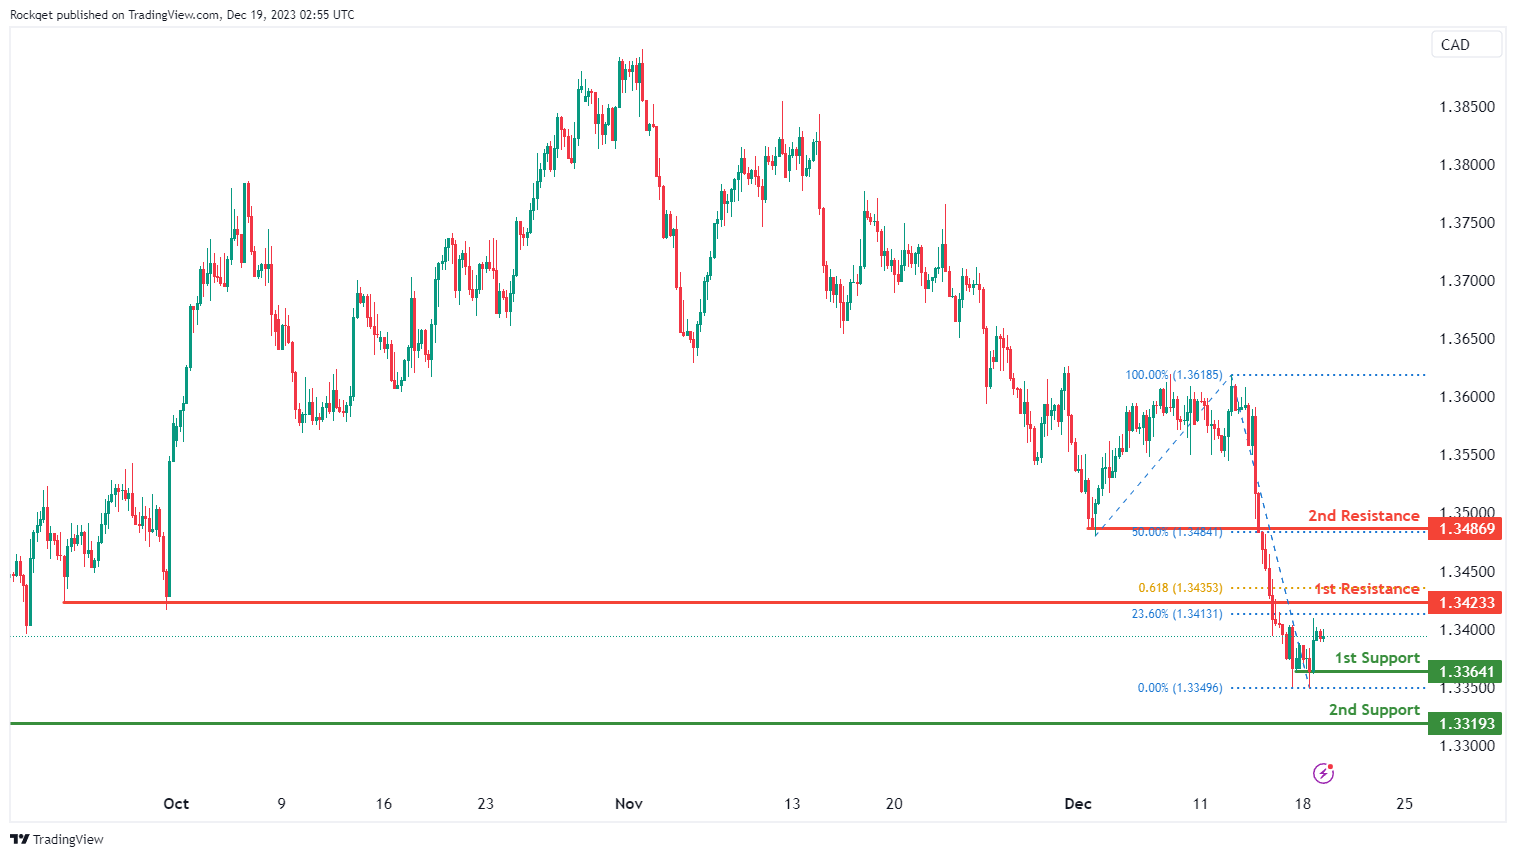
The USD/CAD chart currently exhibits an overall bearish momentum, indicating a potential for a drop towards the 1st support.
The 1st support level at 1.3364 is identified as a pullback support. Further below, the 2nd support level at 1.3319 is also noted as a pullback support, further reinforcing its importance as a key support level.
To the upside, the 1st resistance level at 1.3423 is identified as a pullback resistance that aligns with a confluence of Fibonacci levels i.e. the 23.60% retracement and the 61.80% projection levels. Higher up, the 2nd resistance level at 1.3486 is also marked as a pullback resistance that aligns with the 50.00% Fibonacci retracement level, suggesting a potential barrier for further upside movement.
AUD/USD:
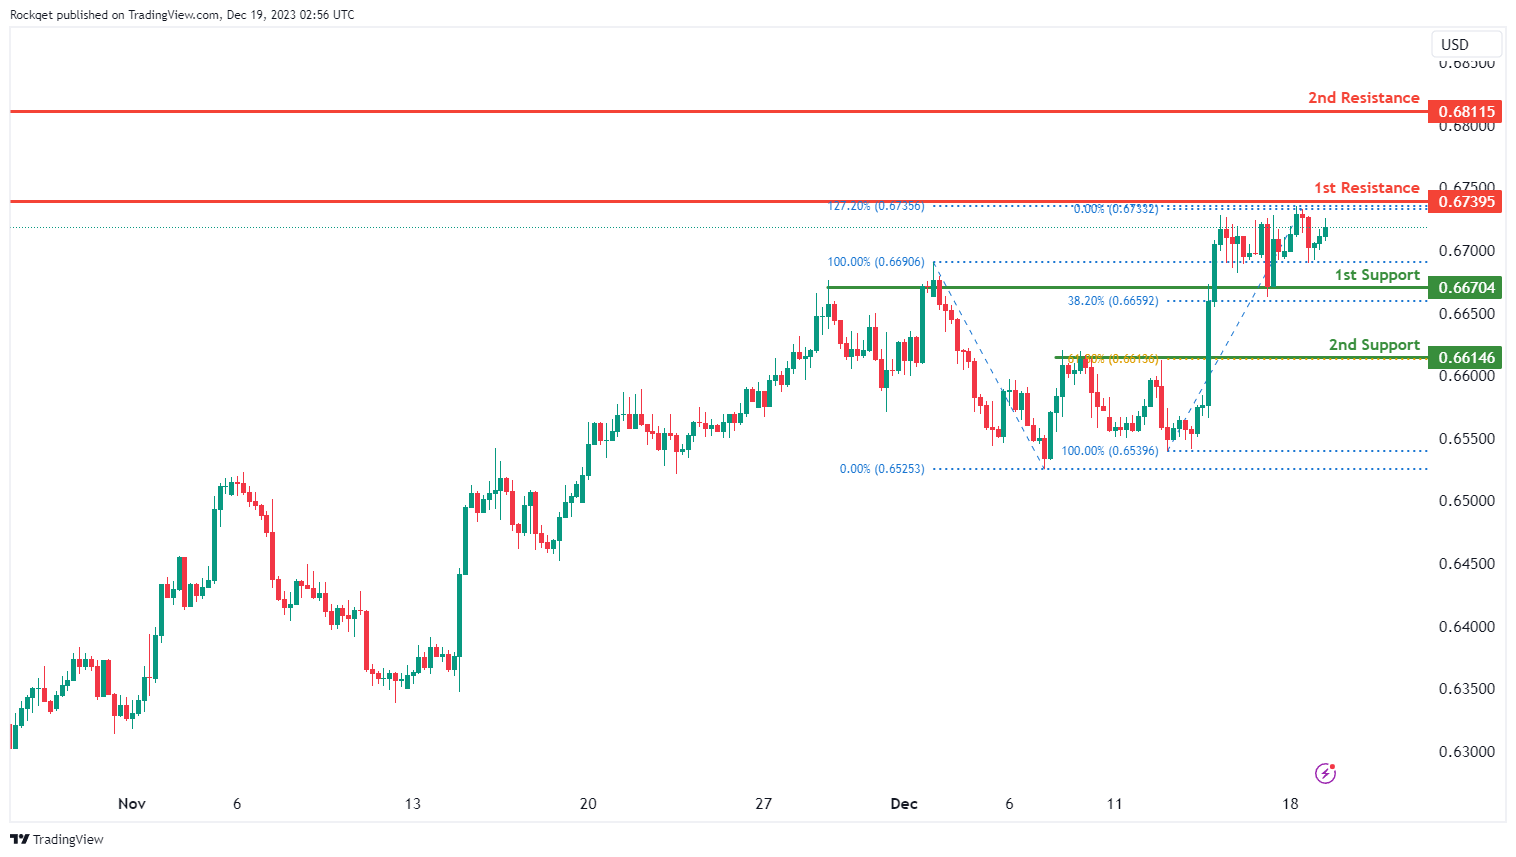
The AUD/USD chart currently exhibits an overall bullish momentum. In this context, there is a potential scenario for price to make a bullish continuation towards the 1st resistance.
The 1st resistance level at 0.6739 is identified as a swing-high resistance that aligns with the 127.20% Fibonacci extension level. Higher up, the 2nd resistance level at 0.6811 is also noted as a swing-high resistance, indicating its potential significance as a barrier for further upward movement.
To the downside, the 1st support level at 0.6670 is identified as an overlap support that aligns close to the 38.20% Fibonacci retracement level. Further below, the 2nd support level at 0.6614 is marked as a pullback support that aligns with the 61.80% Fibonacci retracement level, further reinforcing its importance as a key support level.
NZD/USD
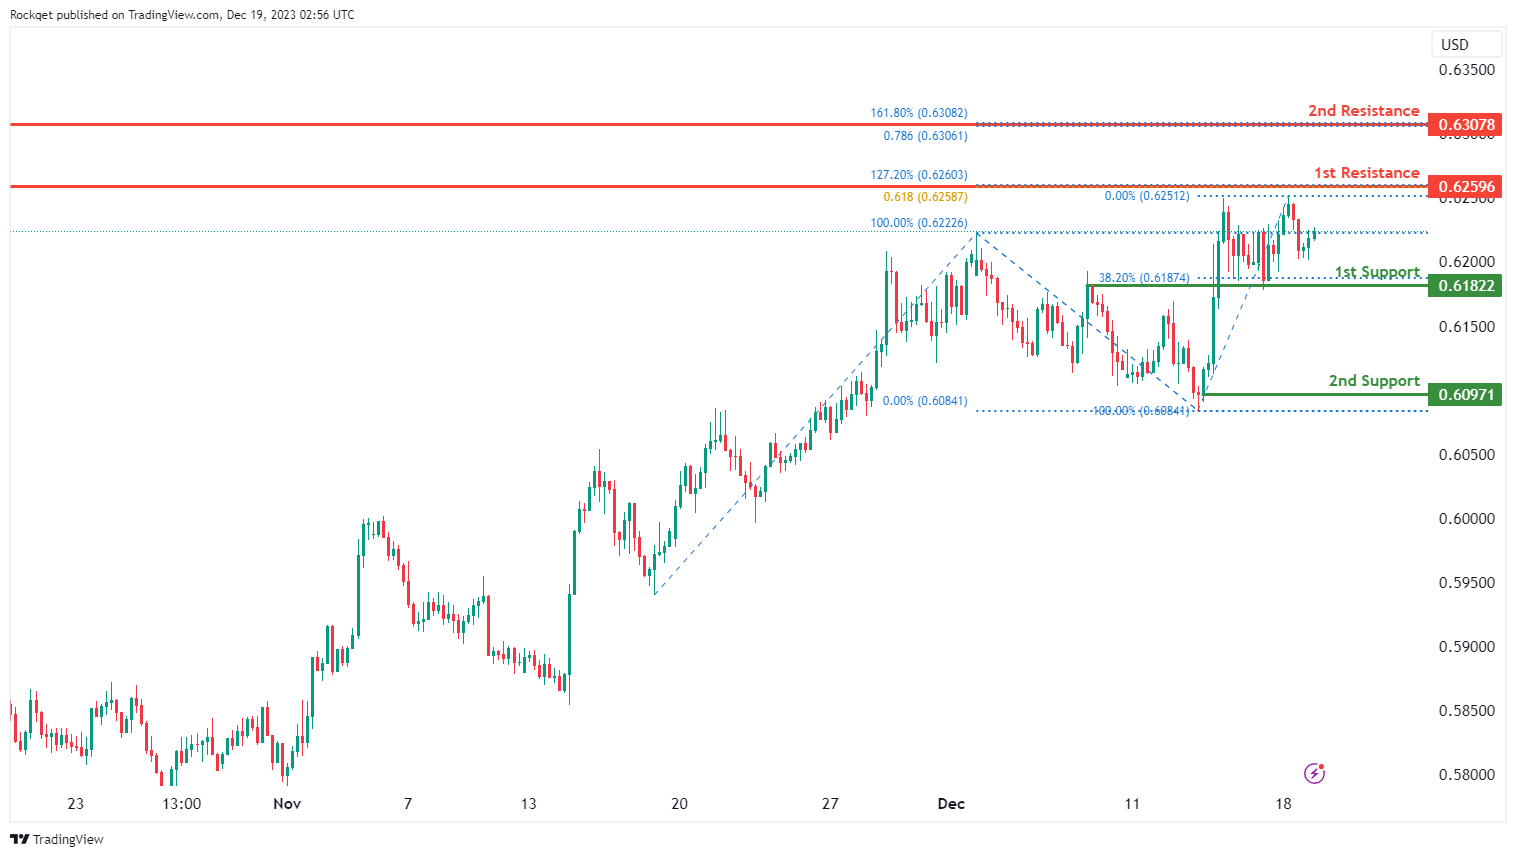
The NZD/USD chart currently exhibits an overall bullish momentum. In this context, there is a potential scenario for price to make a bullish continuation towards the 1st resistance.
The 1st resistance level at 0.6259 is identified as a swing-high resistance that aligns with a confluence of Fibonacci levels i.e. the 127.20% extension and the 61.80% projection levels. Higher up, the 2nd resistance level at 0.6307 is also marked as a swing-high resistance that aligns with a confluence of Fibonacci levels i.e. the 161.80% extension and the 78.60% projection levels, indicating its potential significance as a barrier for further upward movement.
To the downside, the 1st support level at 0.6182 is identified as an overlap support that aligns with the 38.20% Fibonacci retracement level. Further below, the 2nd support level at 0.6097 is noted as a swing-low support, further reinforcing its importance as a key support level.
DJ30:
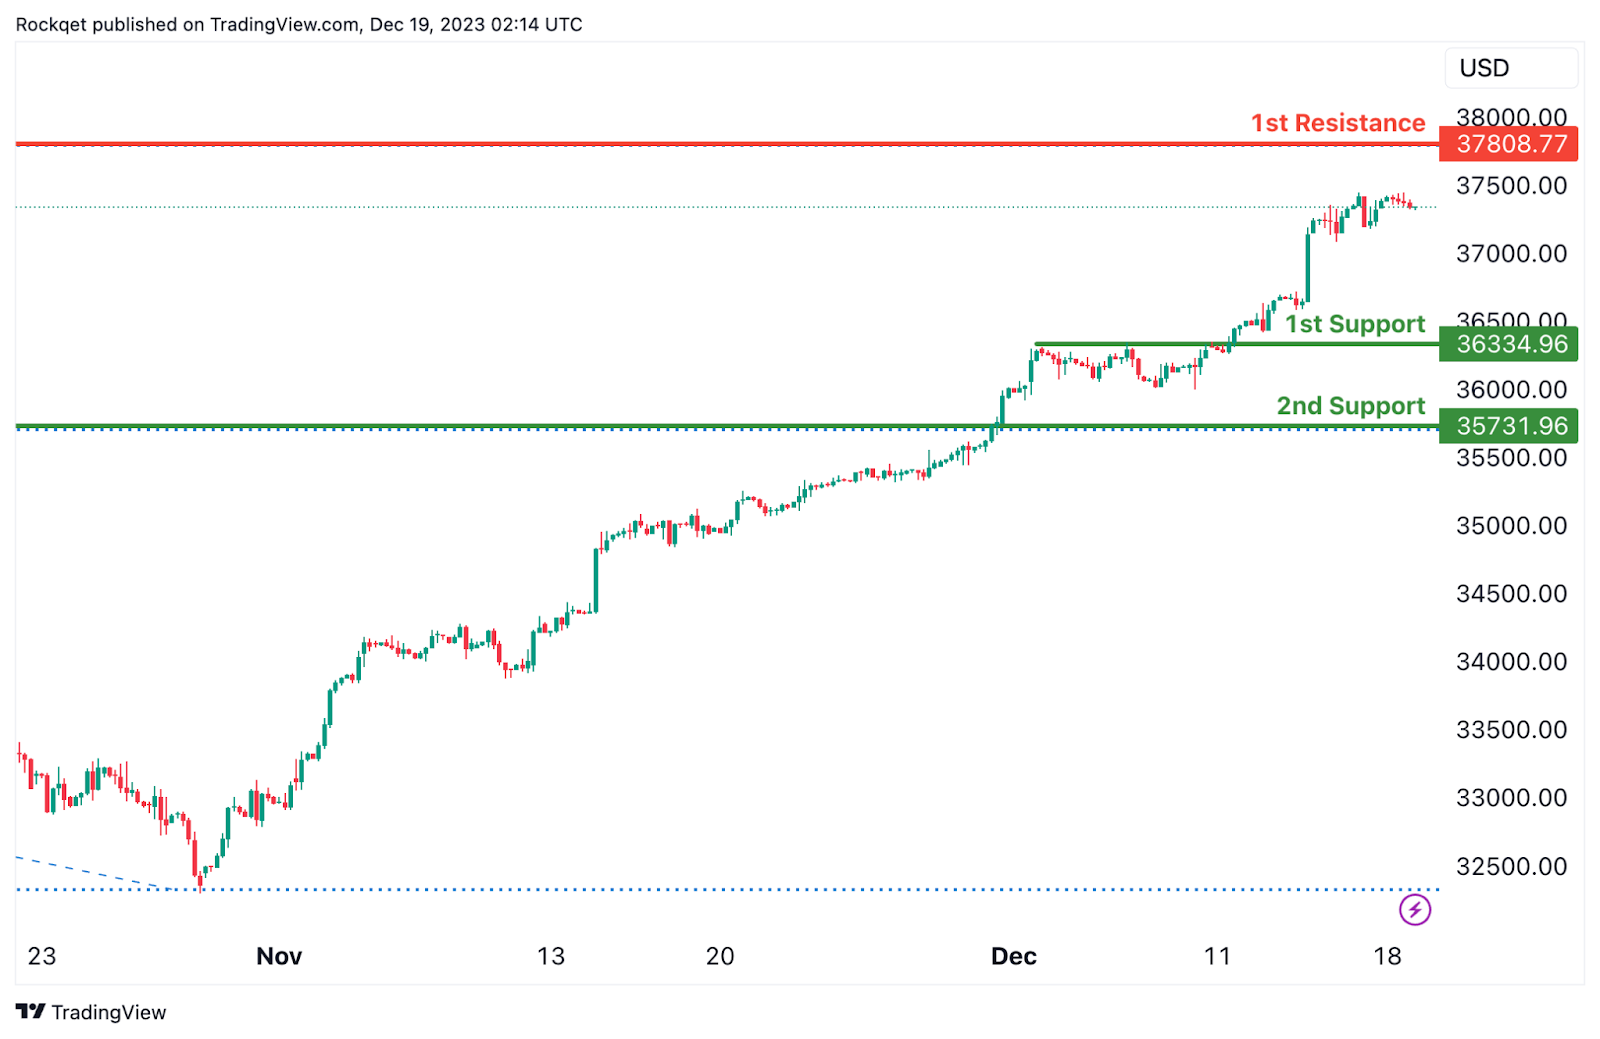
The DJ30 chart currently exhibits a bullish overall momentum, suggesting a potential scenario for a bullish continuation towards the 1st resistance.
The 1st support at 36334.96 is considered significant as it represents an overlap support. This level indicates a historical area where buying interest has been present, reinforcing its potential as a crucial support zone.
Similarly, the 2nd support at 35731.96 is identified as a pullback support. This adds another layer of potential support for the index, indicating a zone where buying interest may emerge after a pullback.
On the resistance side, the 1st resistance at 37808.77 is associated with the 161.80% Fibonacci Extension level. This level may act as a barrier where selling interest could intensify, potentially causing a temporary pause or reversal in the bullish trend.
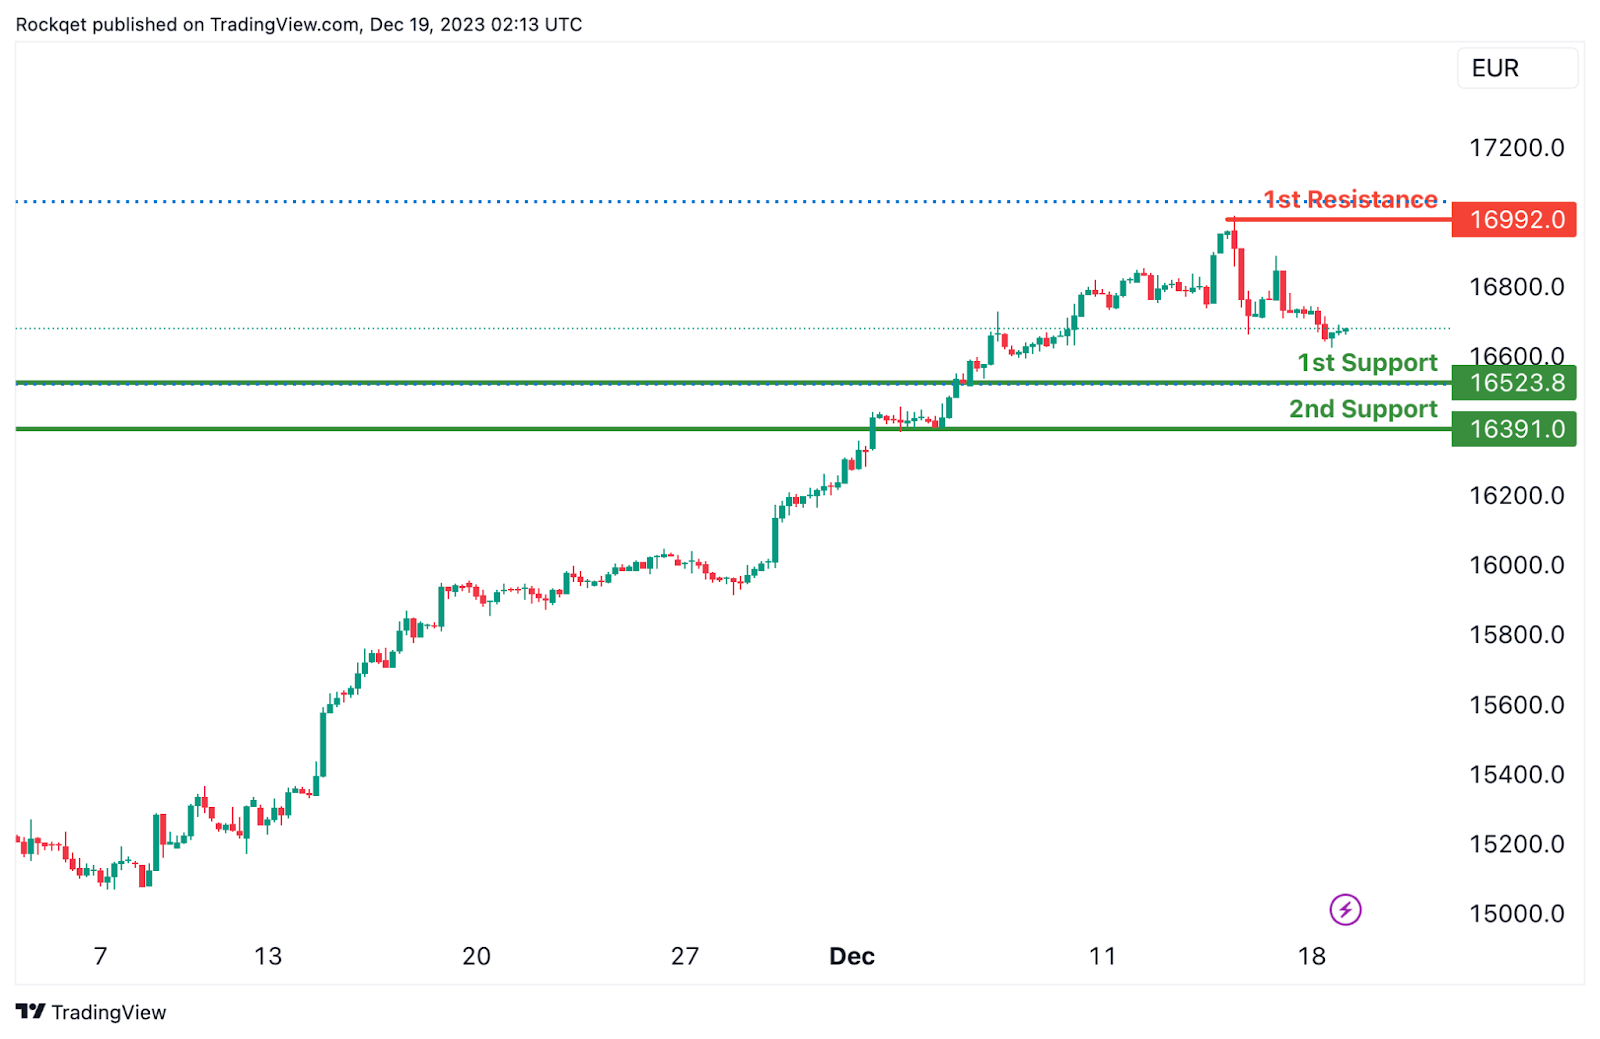
GER40:
The GER40 chart currently has a bearish overall momentum, and there is a potential scenario for a bearish continuation towards the 1st support.
The 1st support at 16523.80 is considered significant as it represents an overlap support. This level indicates a historical area where buying interest has been present, reinforcing its potential as a crucial support zone.
Similarly, the 2nd support at 16391.00 is identified as a pullback support. This adds another layer of potential support for the index, indicating a zone where buying interest may emerge after a pullback.
On the resistance side, the 1st resistance at 16992.00 is associated with the 127.20% Fibonacci Extension level. This level may act as a barrier where selling interest could intensify, potentially causing a temporary pause or reversal in the bearish trend.
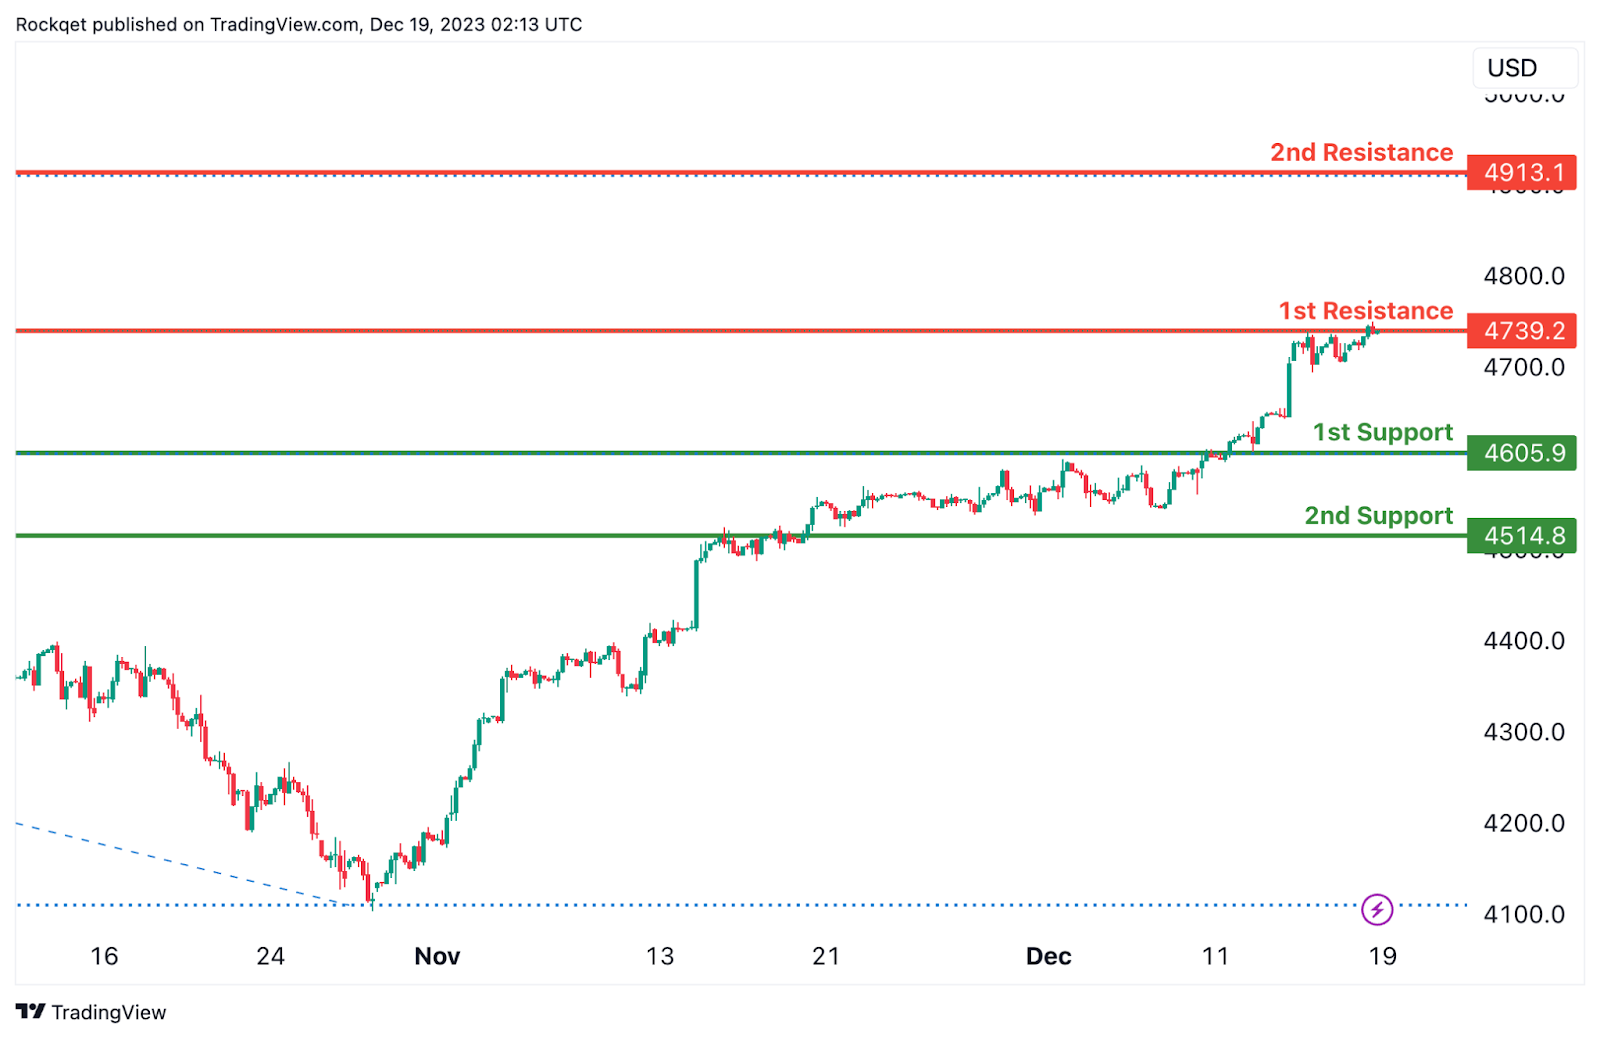
US500:
The US500 chart currently exhibits a bullish overall momentum, suggesting a potential scenario for a bullish continuation towards the 1st resistance.
The 1st support at 4605.9 is considered significant as it represents a pullback support. This level indicates a historical area where buying interest has been present, reinforcing its potential as a crucial support zone.
Similarly, the 2nd support at 4514.8 is identified as an overlap support. This adds another layer of potential support for the index, indicating a zone where buying interest may emerge after a pullback.
On the resistance side, the 1st resistance at 4739.2 is associated with a swing high resistance. This level may act as a barrier where selling interest could intensify, potentially causing a temporary pause or reversal in the bullish trend.
Furthermore, the 2nd resistance at 4913.1 is characterized as a swing high resistance and coincides with the 161.80% Fibonacci Extension level. This adds another layer of significance to the resistance, suggesting a potential area where selling pressure may increase.
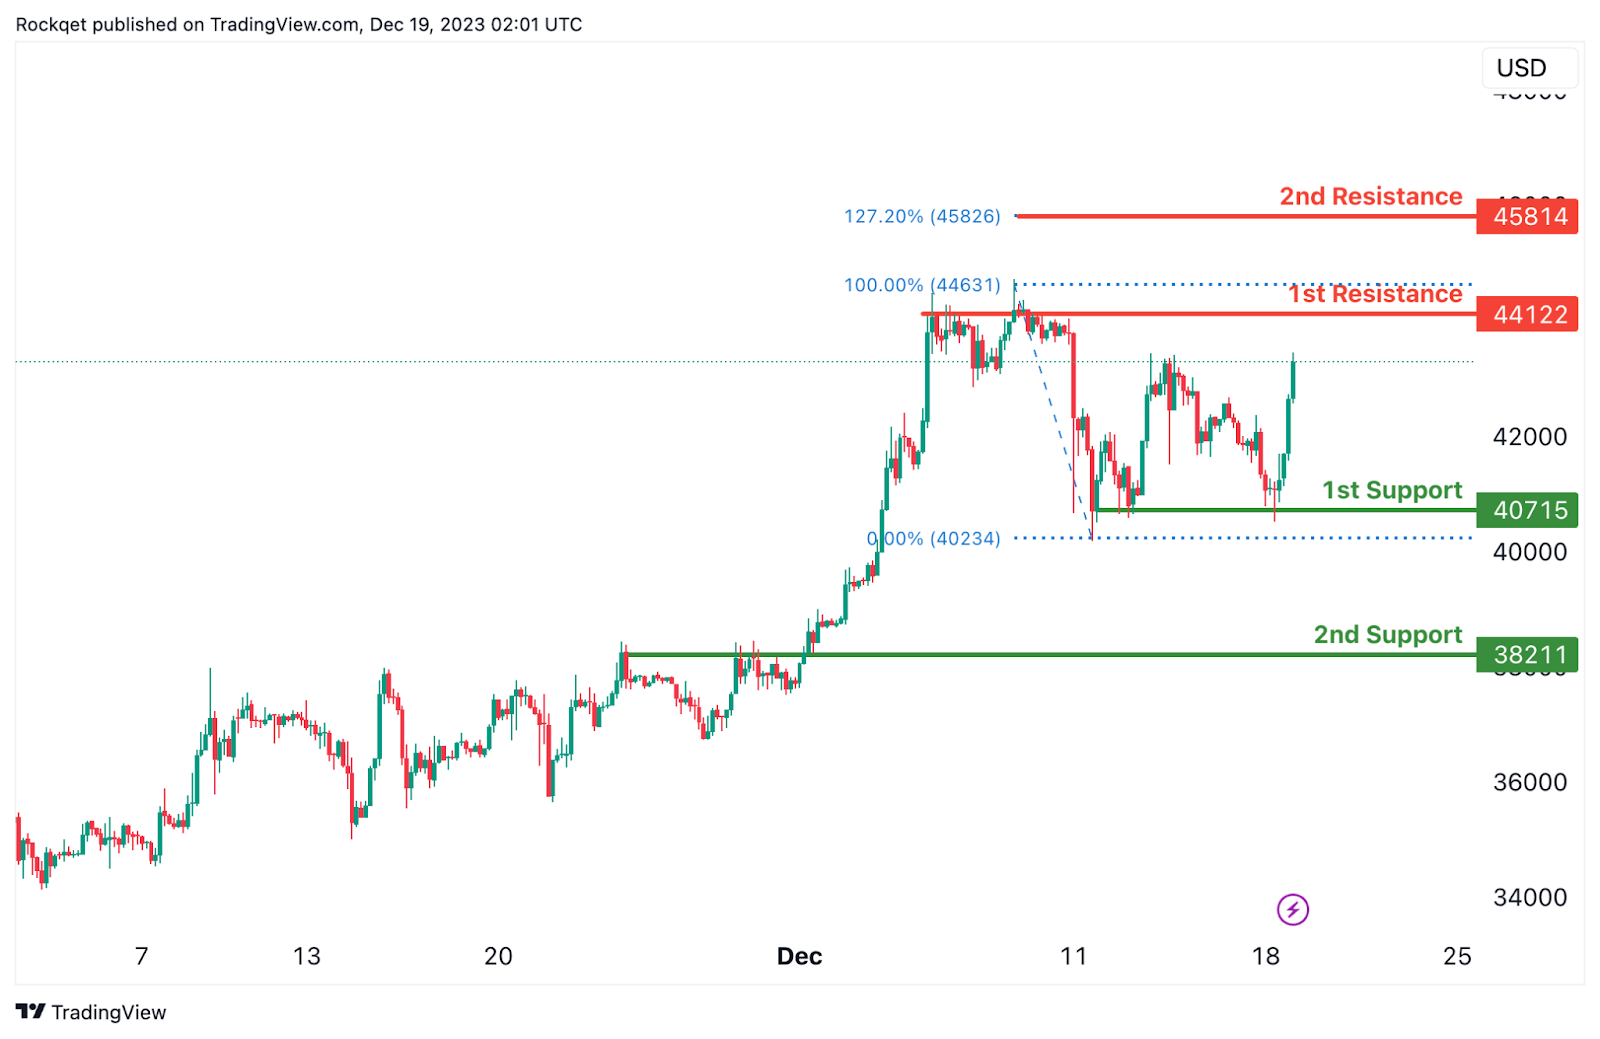
BTC/USD:
The BTC/USD chart currently has a bullish overall momentum, suggesting a potential scenario for a bullish continuation towards the 1st resistance.
The 1st support at 40715 is considered significant as it represents a pullback support. This level indicates a historical area where buying interest has been present, reinforcing its potential as a crucial support zone.
Similarly, the 2nd support at 38211 is identified as a pullback support. This adds another layer of potential support for the cryptocurrency, indicating a zone where buying interest may emerge after a pullback.
On the resistance side, the 1st resistance at 44122 is associated with a swing high resistance and coincides with the 100% Fibonacci Retracement level. This level may act as a barrier where selling interest could intensify, potentially causing a temporary pause or reversal in the bullish trend.
Furthermore, the 2nd resistance at 45814 is characterized as a potential target, given the 127.20% Fibonacci Extension level. This adds another layer of significance to the resistance, suggesting a potential area where selling pressure may increase.
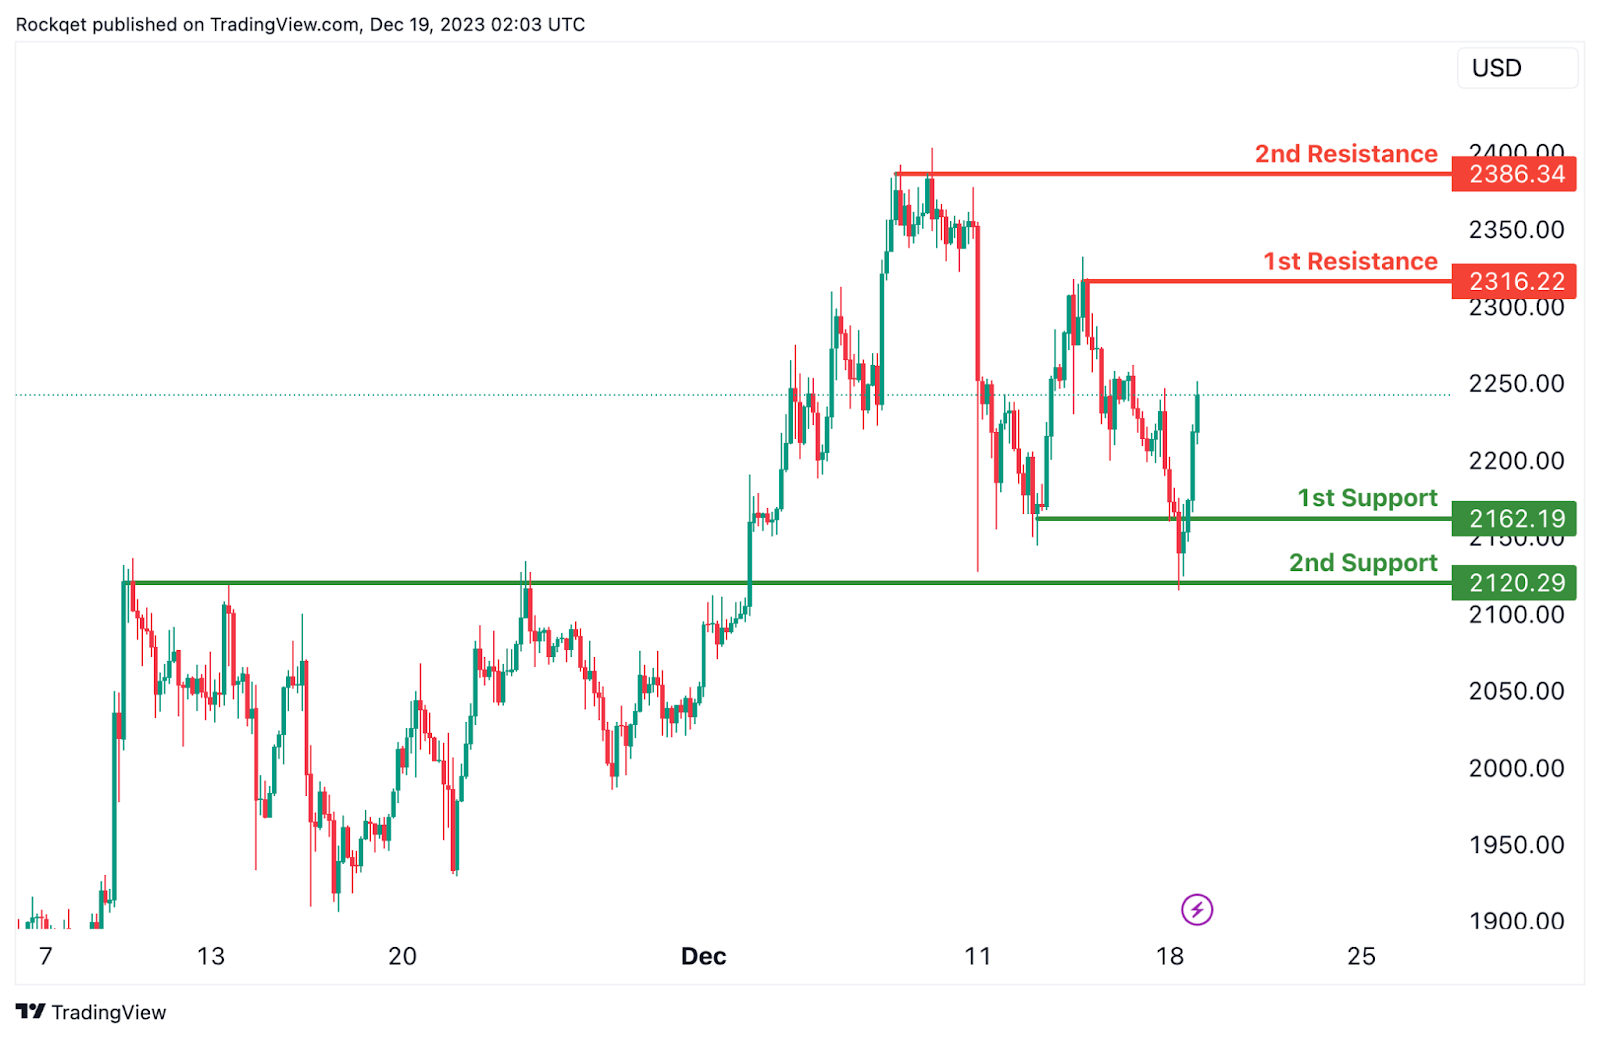
ETH/USD:
The ETH/USD chart currently demonstrates a bullish overall momentum, indicating a potential scenario for a bullish continuation towards the 1st resistance.
The 1st support at 2162.19 is considered significant as it represents a pullback support. This level indicates a historical area where buying interest has been present, reinforcing its potential as a crucial support zone.
Similarly, the 2nd support at 2120.29 is identified as an overlap support. This adds another layer of potential support for the cryptocurrency, indicating a zone where buying interest may emerge after a pullback.
On the resistance side, the 1st resistance at 2316.22 is associated with a swing high resistance. This level may act as a barrier where selling interest could intensify, potentially causing a temporary pause or reversal in the bullish trend.
Furthermore, the 2nd resistance at 2386.32 is characterized as a multi-swing high resistance, suggesting increased resistance in this area.
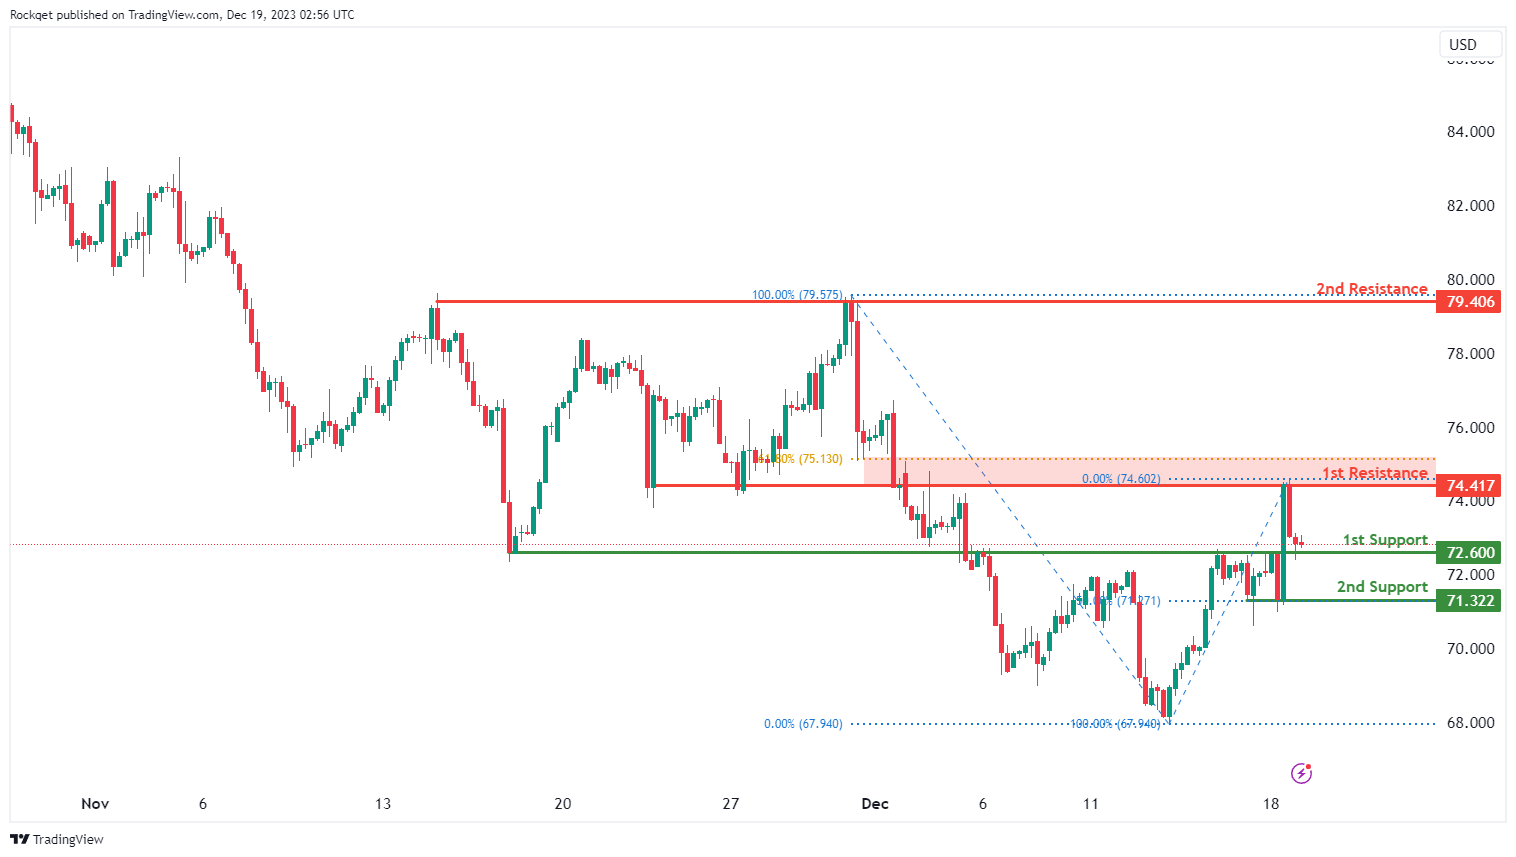
WTI/USD:
The WTI chart currently exhibits an overall bearish momentum, suggesting a prevailing downward trend. In this context, there is a potential scenario for price to make a bearish continuation towards the 1st support.
The 1st support level at 72.60 is identified as an overlap support. Further below, the 2nd support level at 71.32 is marked as a pullback support that aligns with the 50.00% Fibonacci retracement level, reinforcing its importance as a key support level.
To the upside, the 1st resistance level at 74.41 is identified as an overlap resistance that aligns close to the 61.80% Fibonacci retracement level. Higher up, the 2nd resistance level at 79.40 is noted as a multi-swing-high resistance, further indicating its potential significance as a barrier for further upward movement.
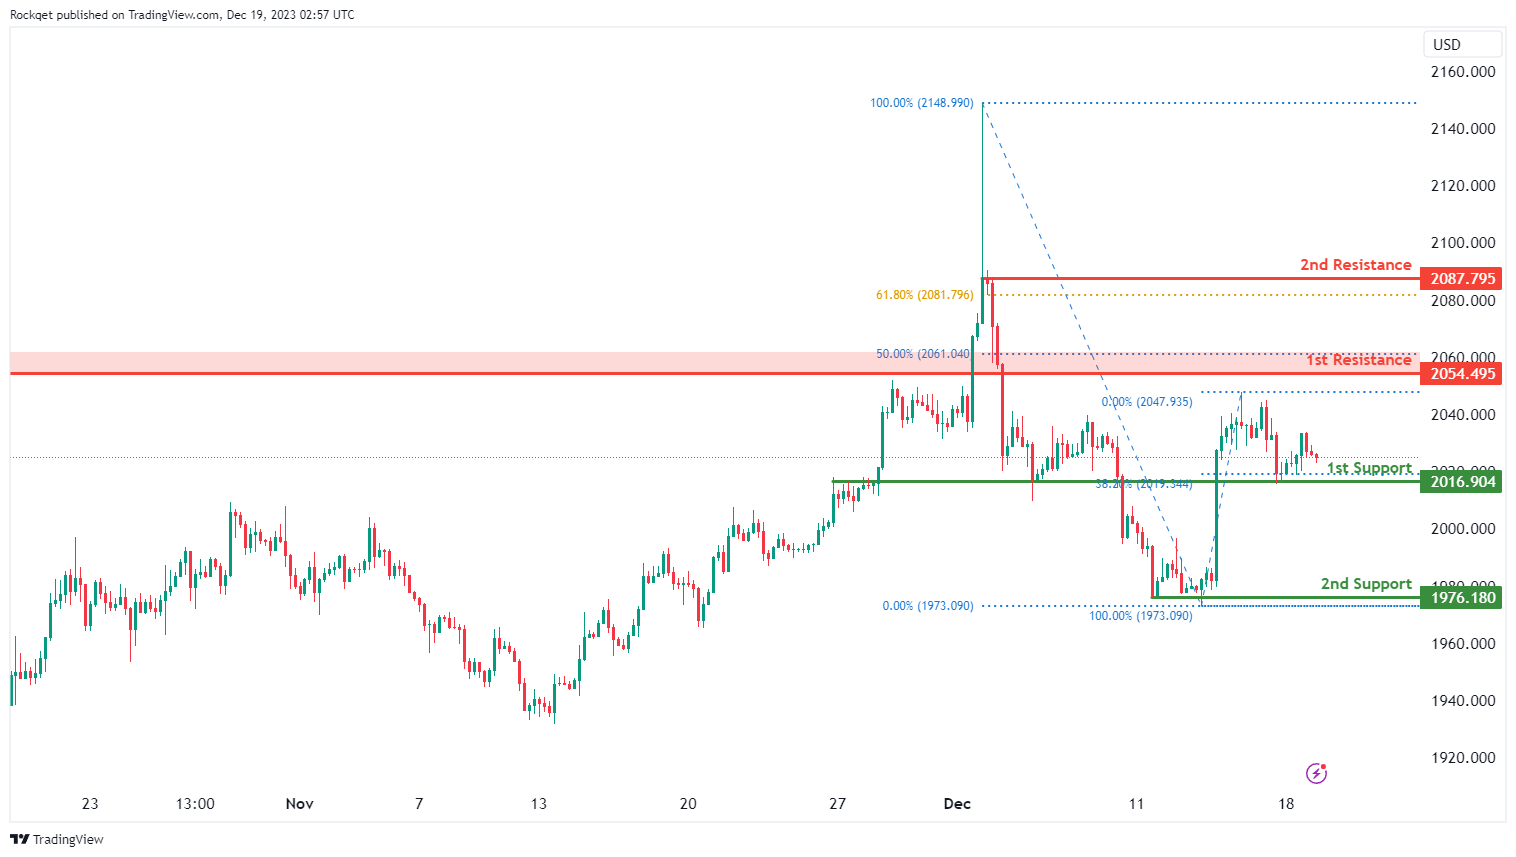
XAU/USD (GOLD):
The XAU/USD chart currently demonstrates a neutral momentum, indicating a potential for price to fluctuate between the 1st support and the 1st resistance.
The 1st support level at 2,016.90 is identified as an overlap support that aligns with the 38.20% Fibonacci retracement level. Further below, the 2nd support level at 1,976.18 is noted as a pullback support, reinforcing its importance as a key support level.
To the upside, the 1st resistance level at 2,054.49 is identified as a swing-high resistance that aligns close to the 50.00% Fibonacci retracement level. Higher up, the 2nd resistance level at 2,087.79 is marked as a pullback resistance that aligns close to the 61.80% Fibonacci retracement level, further indicating its potential significance as a barrier for further upward movement.


