
DXY:
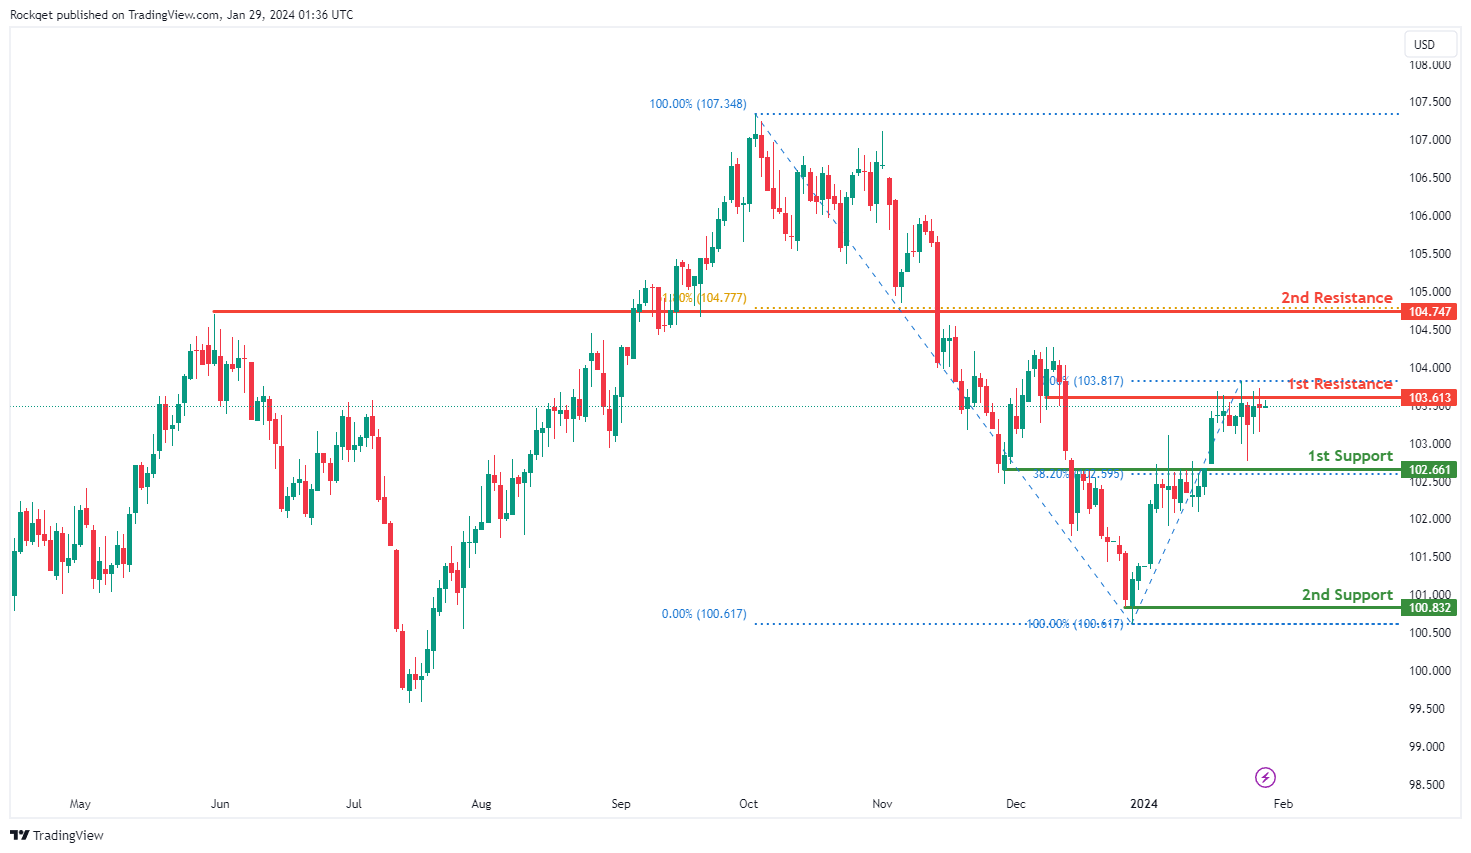
The DXY (US Dollar Currency Index) chart currently exhibits a bullish overall momentum, indicating strength in the US Dollar. According to your analysis, there is potential for a bullish breakout through the 1st resistance level and a subsequent rise towards the 2nd resistance level.
The 1st support level at 102.66 is considered significant for several reasons. It represents an overlap support, indicating that this price level has historically acted as both support and resistance. Additionally, it coincides with the 38.20% Fibonacci Retracement level, suggesting that this level corresponds to a previous significant low point on the chart, and the Fibonacci confluence adds to its importance as a potential support level.
The 2nd support level at 100.83 is identified as a swing low support, reinforcing its significance as a level where price has previously found support during a bullish move.
On the resistance side, the 1st resistance level at 103.61 is recognized as an overlap resistance, indicating that this price level has historically served as both support and resistance. This suggests that it may act as a potential barrier for further upward price movement.
The 2nd resistance level at 104.74 is categorized as a pullback resistance and coincides with the 61.80% Fibonacci Retracement level. This reinforces its importance as a potential resistance point during price pullbacks.
EUR/USD:
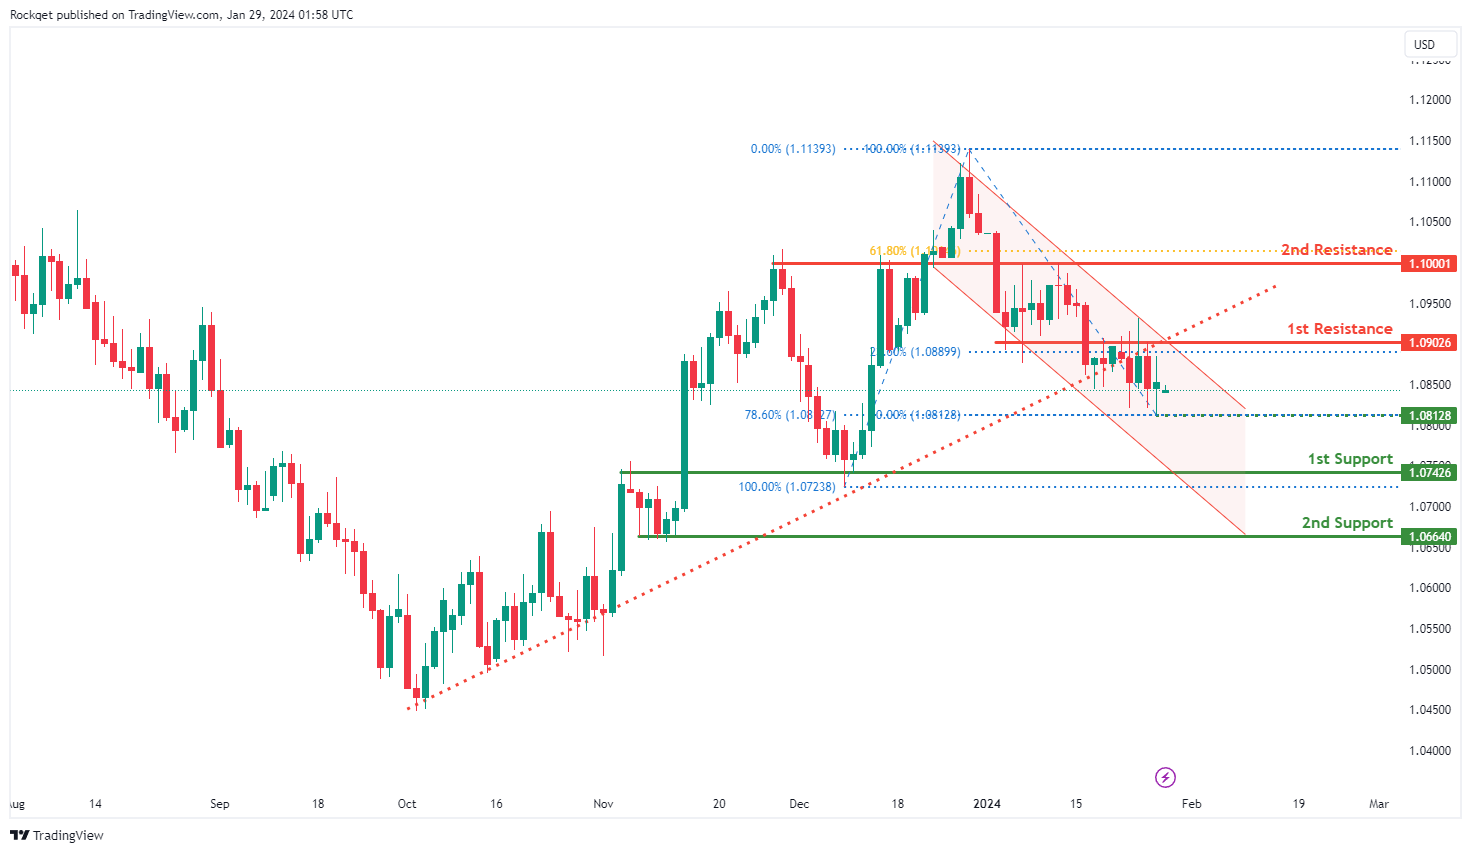
The EUR/USD trading pair is currently in a bearish descending channel, which is contributing to the overall bearish momentum on the chart. Your analysis suggests that there is potential for a bearish continuation in the price towards the 1st support level.
The 1st support level at 1.0742 is considered significant for several reasons. It represents an overlap support, indicating that this price level has historically acted as both support and resistance. This suggests that it may serve as a strong area where price could potentially find support during a bearish move.
The 2nd support level at 1.0664 is identified as a multi-swing low support, reinforcing its significance as a level where price has previously found support during a bearish trend.
On the resistance side, the 1st resistance level at 1.0902 is recognized as an overlap resistance, indicating that this price level has historically served as both support and resistance. Additionally, it coincides with the 23.60% Fibonacci Retracement level, adding to its importance as a potential barrier for upward price movement.
The 2nd resistance level at 1.1000 is categorized as an overlap resistance and coincides with the 61.80% Fibonacci Retracement level, further reinforcing its significance as a potential resistance point.
There is also an intermediate support level at 1.0812, characterized as a swing low support and coinciding with the 78.60% Fibonacci Retracement level. This intermediate support level adds an additional layer of support during the bearish move.
EUR/JPY:
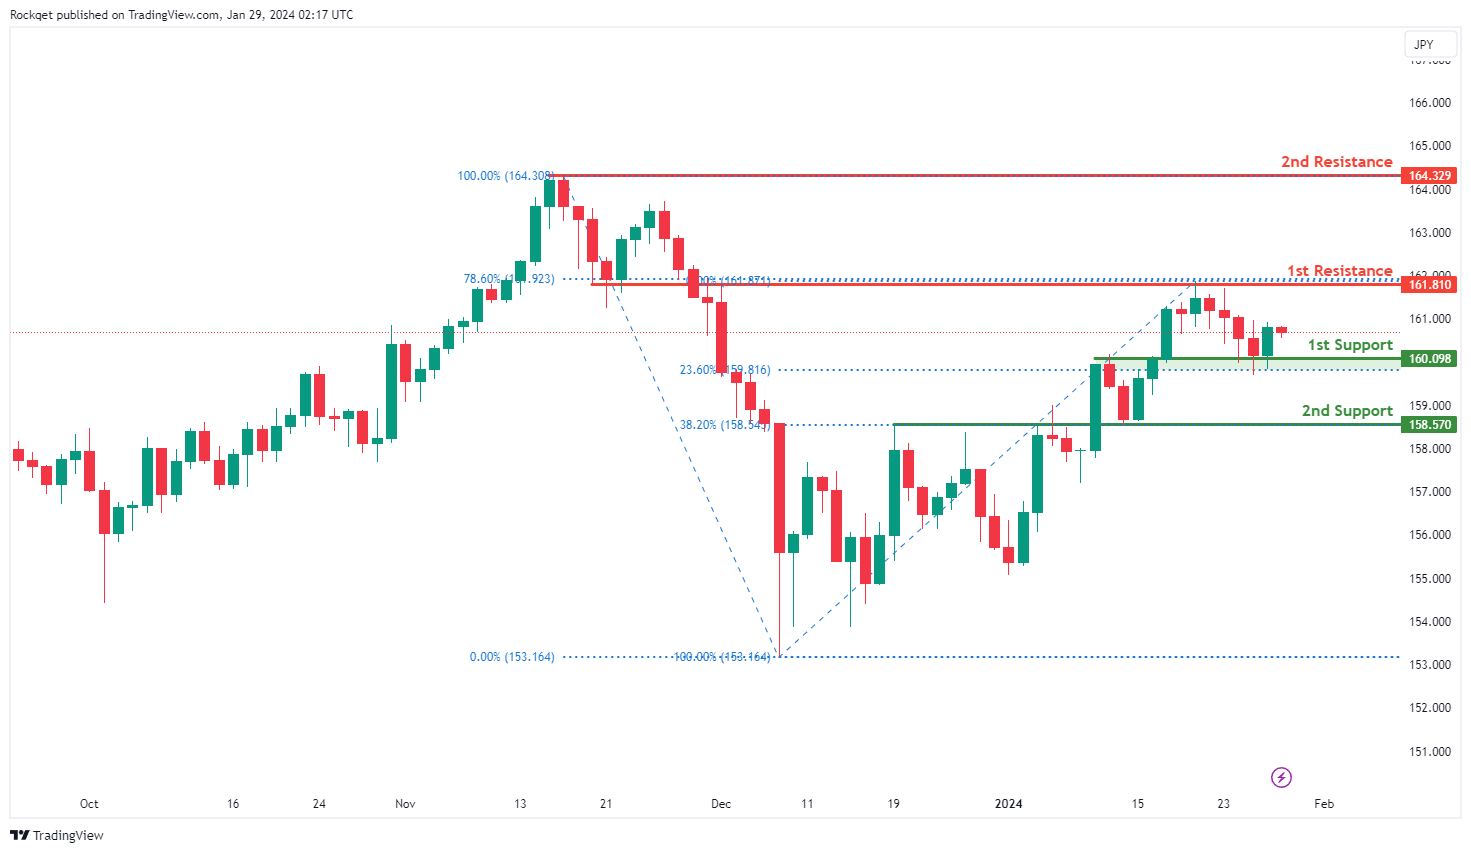
The EUR/JPY (Euro/Japanese Yen) chart currently has a bullish overall momentum, and your analysis suggests the potential for a bullish continuation towards the 1st resistance level.
The 1st support level at 160.090 is considered significant for several reasons. It is identified as an overlap support, indicating that this price level has historically acted as both support and resistance. Additionally, it coincides with the 23.60% Fibonacci Retracement level, suggesting that this level corresponds to a previous significant price level, and the Fibonacci confluence adds to its importance as a potential support level.
The 2nd support level at 158.570 is also identified as an overlap support and coincides with the 38.20% Fibonacci Retracement level, further reinforcing its significance as a potential support zone.
On the resistance side, the 1st resistance level at 161.810 is characterized as an overlap resistance and aligns with the 78.60% Fibonacci Retracement level. This indicates that it may serve as a potential barrier for further upward price movement.
The 2nd resistance level at 164.320 is categorized as a swing high resistance, suggesting that it represents a historical point where the price has encountered resistance.
EUR/GBP:
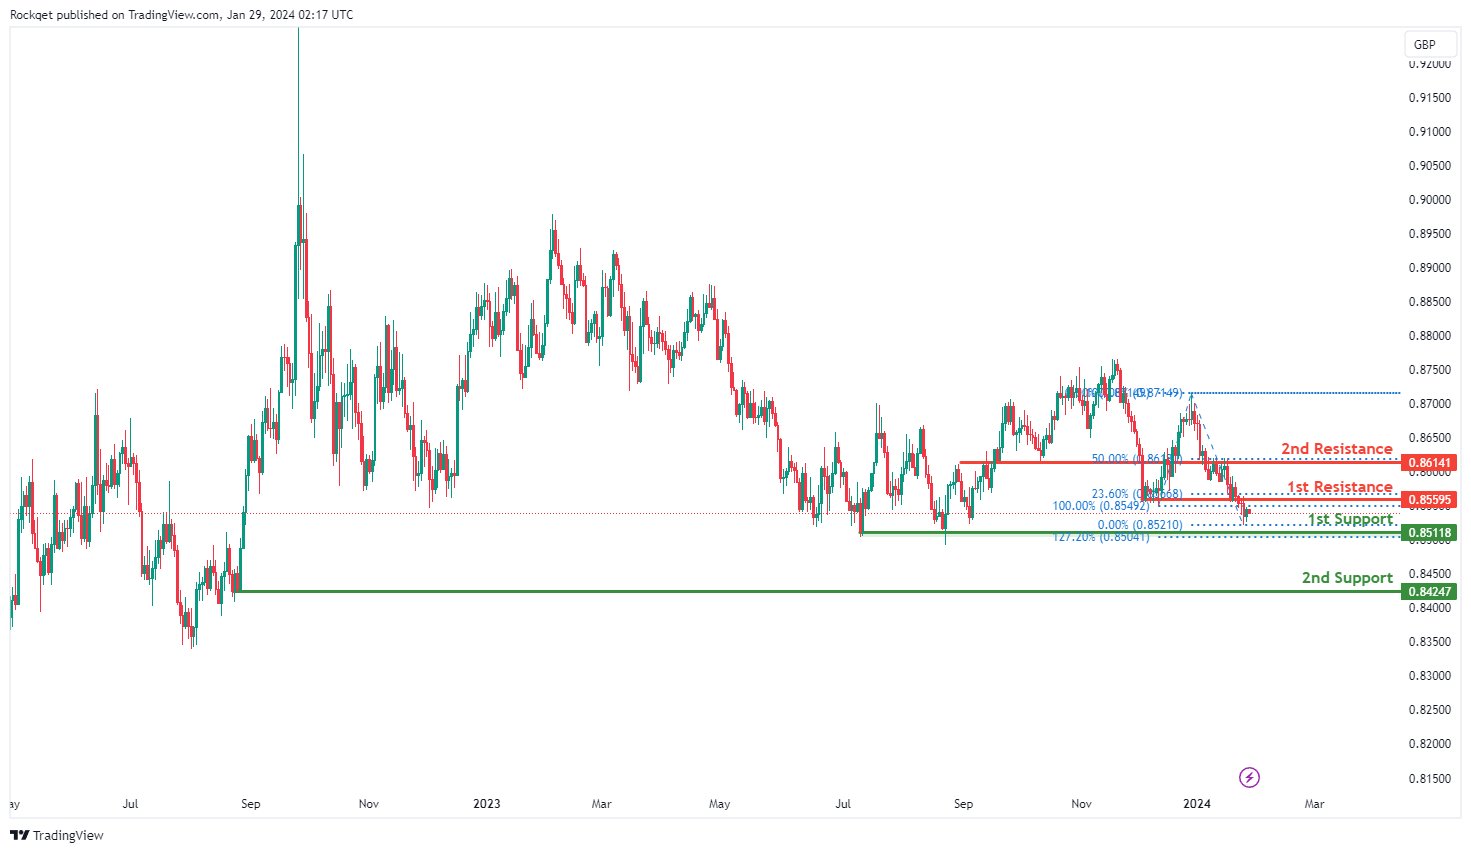
The EUR/GBP (Euro/British Pound) chart currently has a bearish overall momentum, and your analysis suggests the potential for a short-term rise towards the 1st resistance level followed by a reversal off it and a drop towards the 1st support level.
The 1st support level at 0.85110 is considered significant for several reasons. It is identified as a multi-swing low support and also corresponds to a Fibonacci Extension level, adding to its importance as a potential support zone.
The 2nd support level at 0.84240 is identified as a swing low support, indicating its historical significance as a level where the price has found support during bearish movements.
On the resistance side, the 1st resistance level at 0.85590 is characterized as an overlap resistance and aligns with the 23.60% Fibonacci Retracement level. This suggests that it may serve as a potential barrier for further upward price movement.
The 2nd resistance level at 0.86140 is also categorized as an overlap resistance and coincides with the 50% Fibonacci Retracement level, further highlighting its importance as a potential resistance point.
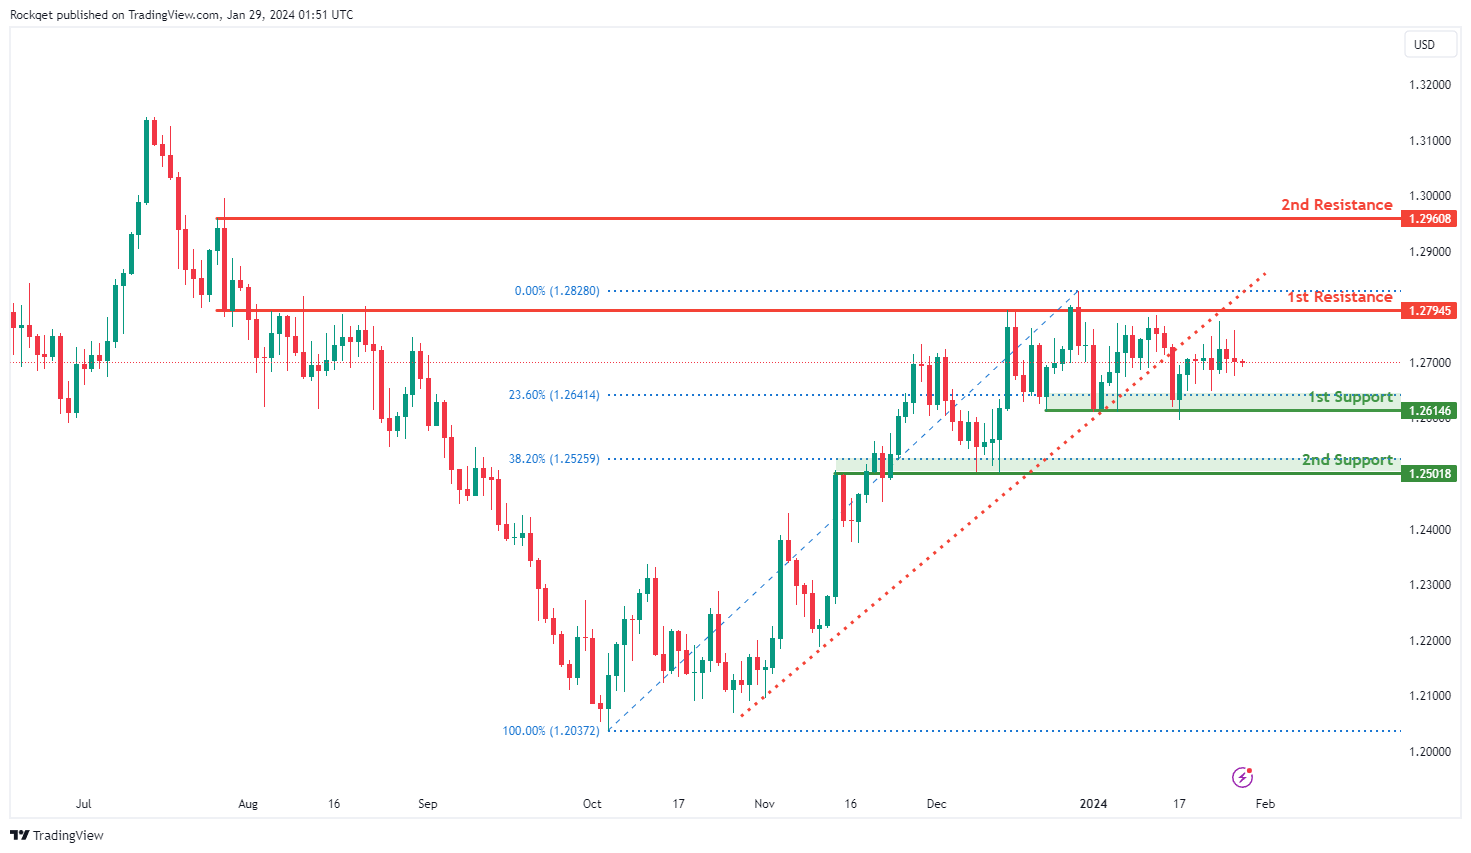
GBP/USD:
The GBP/USD trading pair currently has a bearish overall momentum, and this is attributed to the fact that the price has broken below the lower channel line, indicating the continuation of the prior bearish trend. Your analysis suggests that there is potential for a bearish continuation in the price towards the 1st support level.
The 1st support level at 1.2614 is considered significant for several reasons. It represents a multi-swing low support, indicating that this price level has historically acted as a significant low point on the chart. Additionally, it coincides with the 23.60% Fibonacci Retracement level, adding to its importance as a potential support level.
The 2nd support level at 1.2501 is identified as an overlap support and also aligns with the 38.20% Fibonacci Retracement level, further reinforcing its significance as a support zone.
On the resistance side, the 1st resistance level at 1.2794 is recognized as an overlap resistance, indicating that this price level has historically served as both support and resistance. This makes it a potential barrier where selling pressure could emerge.
The 2nd resistance level at 1.2960 is categorized as a swing high resistance, suggesting that it represents a historical point where the price has encountered resistance.
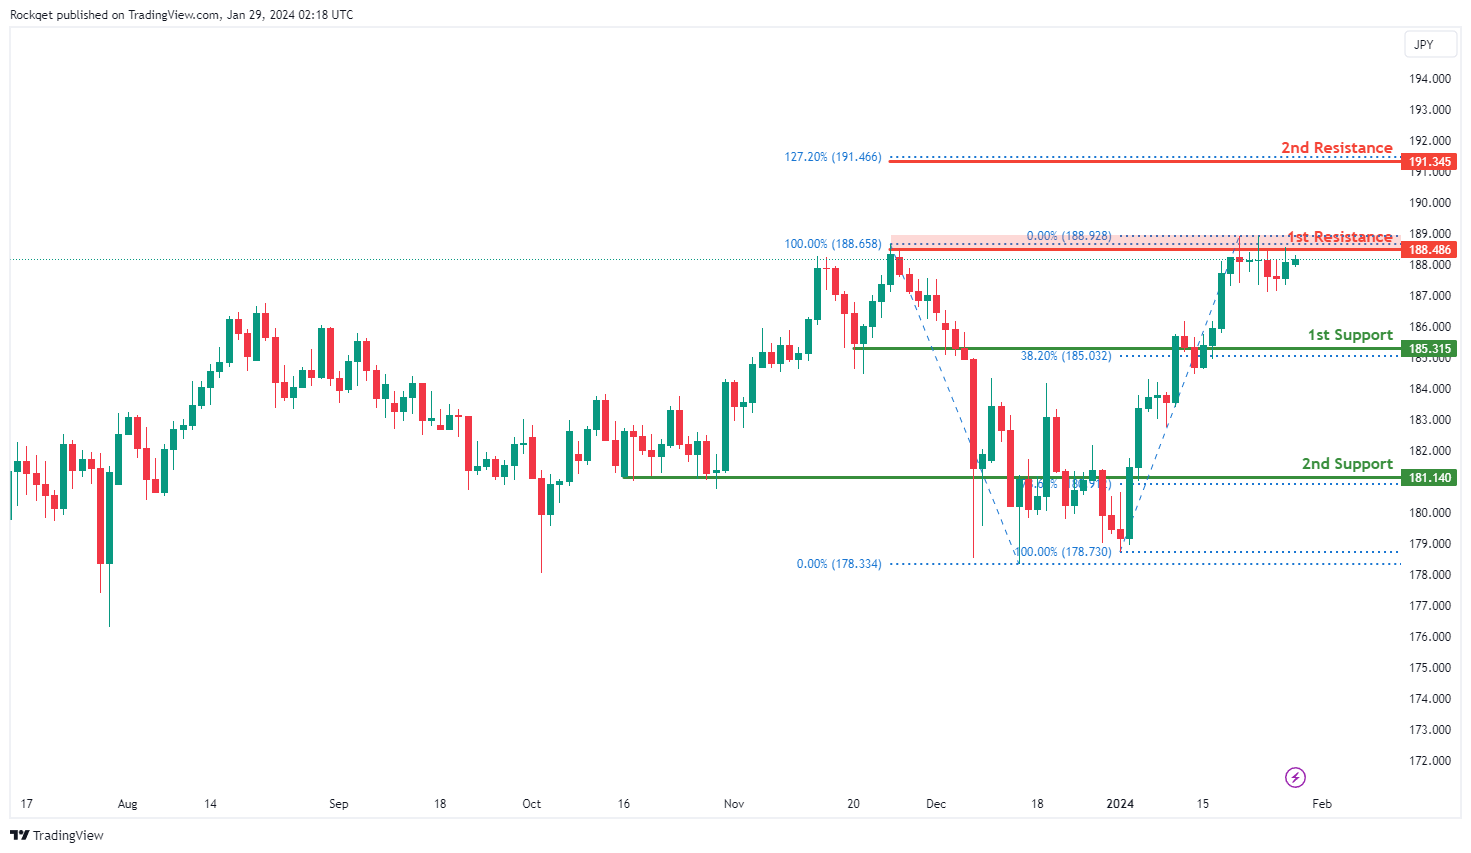
GBP/JPY:
The GBP/JPY (British Pound/Japanese Yen) chart currently exhibits a bearish overall momentum, and your analysis suggests the potential for a bearish reaction off the 1st resistance level followed by a drop towards the 1st support level.
The 1st support level at 185.310 is considered significant for several reasons. It is identified as a pullback support and coincides with the 38.20% Fibonacci Retracement level, indicating that this level corresponds to a previous significant price level. The Fibonacci confluence adds to its importance as a potential support zone.
The 2nd support level at 181.140 is also identified as a pullback support and aligns with the 78.60% Fibonacci Retracement level, further reinforcing its significance as a potential support zone.
On the resistance side, the 1st resistance level at 188.480 is characterized as multi-swing high resistance, suggesting that it represents a historical point where the price has encountered resistance.
The 2nd resistance level at 191.340 is categorized as the 127.20% Fibonacci Extension, indicating an extended potential resistance level beyond the typical Fibonacci retracement levels.
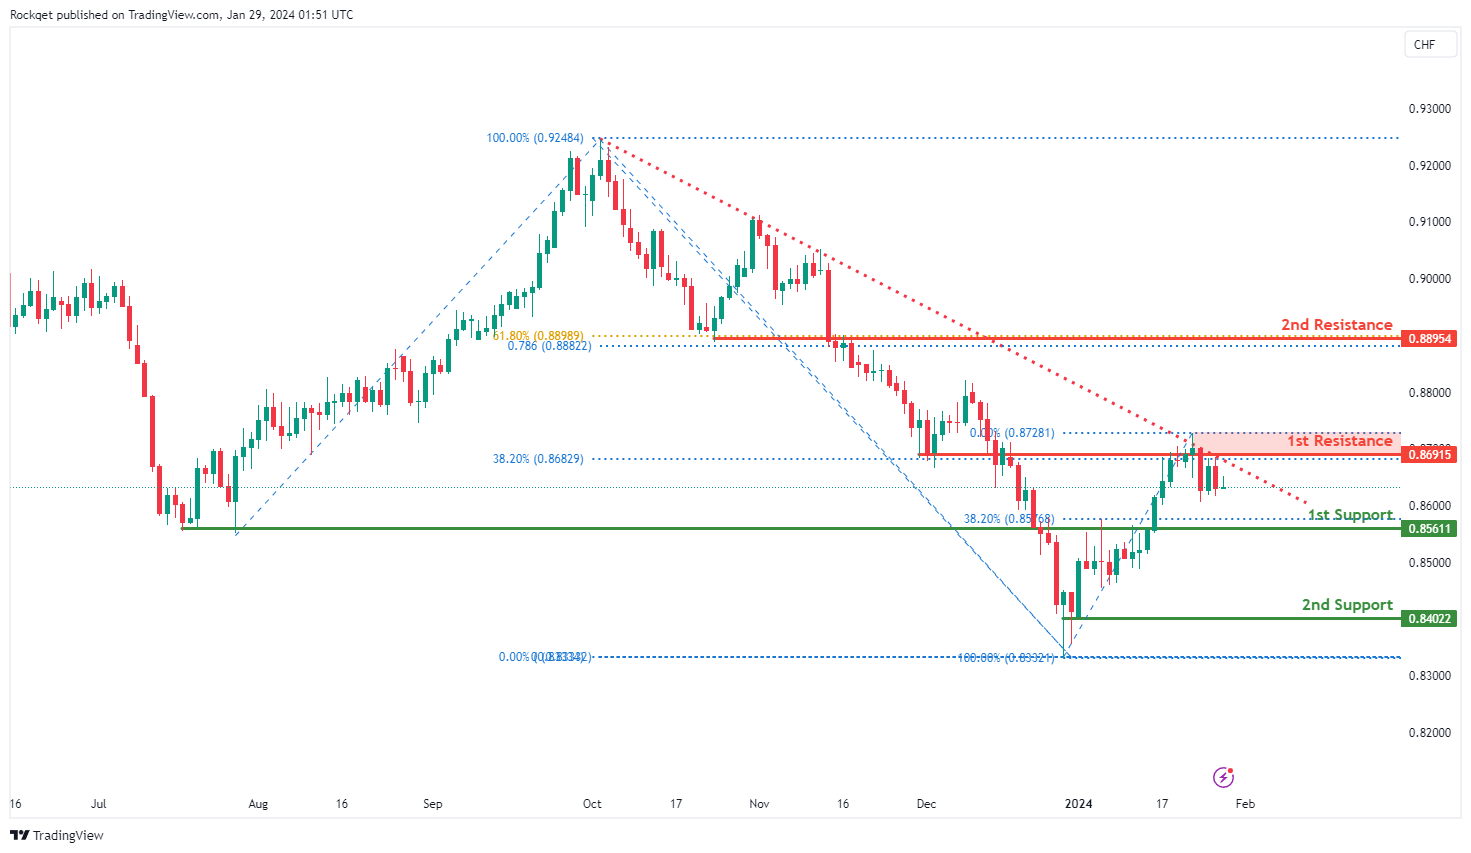
USD/CHF:
The USD/CHF trading pair currently exhibits a bearish overall momentum, and this momentum is supported by the fact that the price is below a major descending trendline, suggesting that bearish momentum is likely to continue. Your analysis suggests that there is potential for a bearish continuation in the price towards the 1st support level.
The 1st support level at 0.8561 is considered significant for several reasons. It is identified as a pullback support, indicating that this level might act as a support zone during price pullbacks within the bearish trend.
The 2nd support level at 0.8402 is recognized as a swing low support, emphasizing its significance as a level where price has previously found support during a bearish move.
On the resistance side, the 1st resistance level at 0.8691 is characterized as an overlap resistance and also coincides with the 38.20% Fibonacci Retracement level. This suggests that it may serve as a potential barrier for further upward price movement.
The 2nd resistance level at 0.8895 is categorized as an overlap resistance, and it coincides with both the 61.80% Fibonacci Retracement and the 78.60% Fibonacci Projection levels. This confluence of Fibonacci levels adds to its importance as a potential resistance point, indicating Fibonacci confluence.
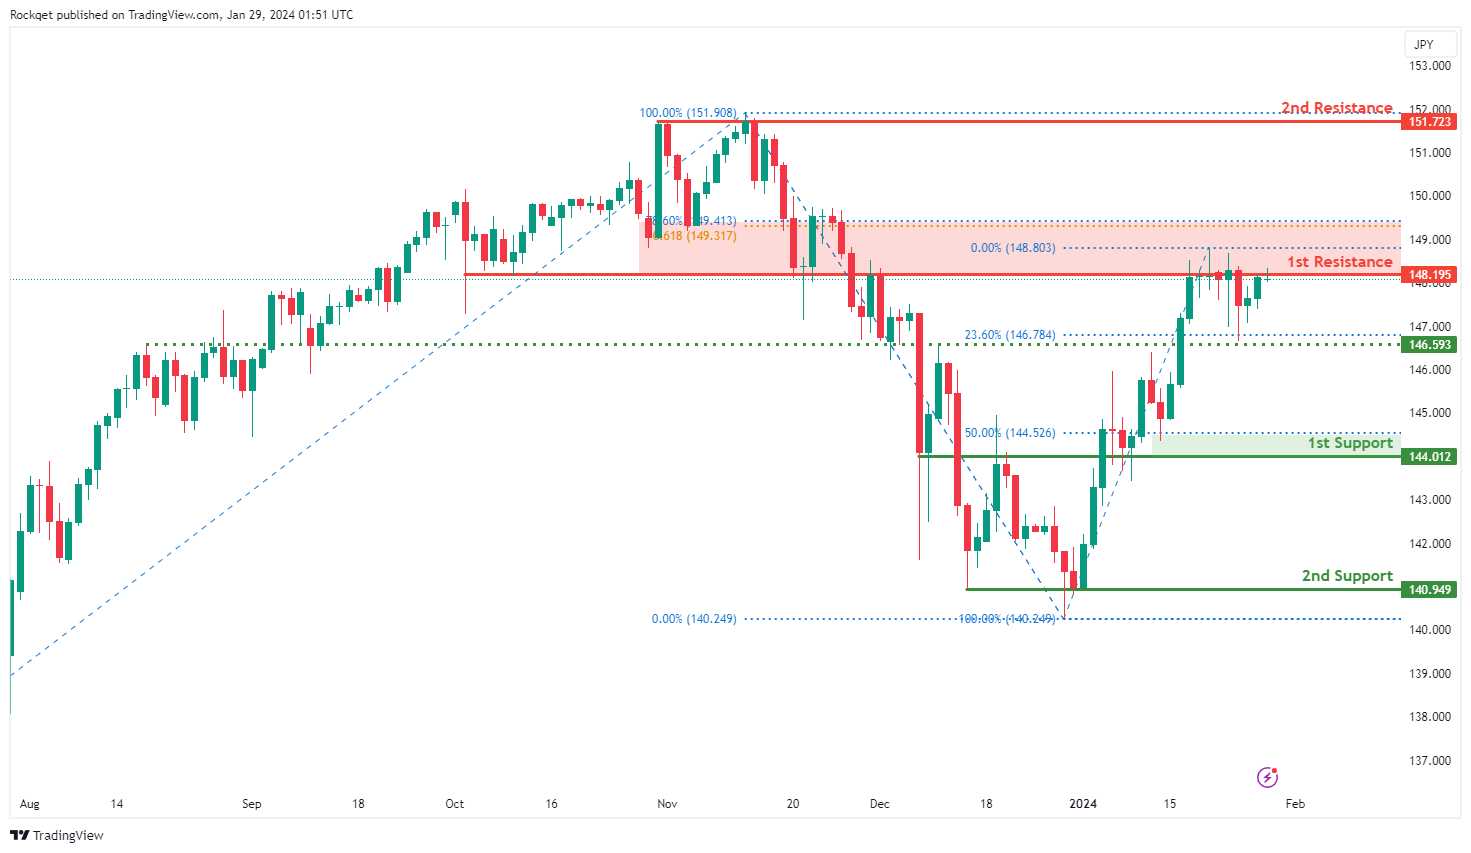
USD/JPY:
The USD/JPY trading pair currently has a bearish overall momentum. According to your analysis, there is potential for a bearish reaction off the 1st resistance level, followed by a drop towards the 1st support level.
The 1st support level at 144.01 is considered significant for several reasons. It represents an overlap support, indicating that this price level has historically acted as both support and resistance. Additionally, it coincides with the 50% Fibonacci Retracement level, suggesting that this level corresponds to a previous significant low point on the chart, and the Fibonacci confluence adds to its importance as a potential support level.
The 2nd support level at 140.94 is identified as a multi-swing low support, reinforcing its significance as a level where price has previously found support during a bearish move.
On the resistance side, the 1st resistance level at 148.19 is recognized as an overlap resistance, indicating that this price level has historically served as both support and resistance. This makes it a potential barrier where selling pressure could emerge.
The 2nd resistance level at 151.72 is categorized as a multi-swing high resistance, suggesting that it represents a historical point where the price has encountered resistance.
Additionally, there is an intermediate support level at 146.59, characterized as an overlap support, which coincides with the 23.60% Fibonacci Retracement level. This intermediate support level adds an additional layer of support during the bearish move.
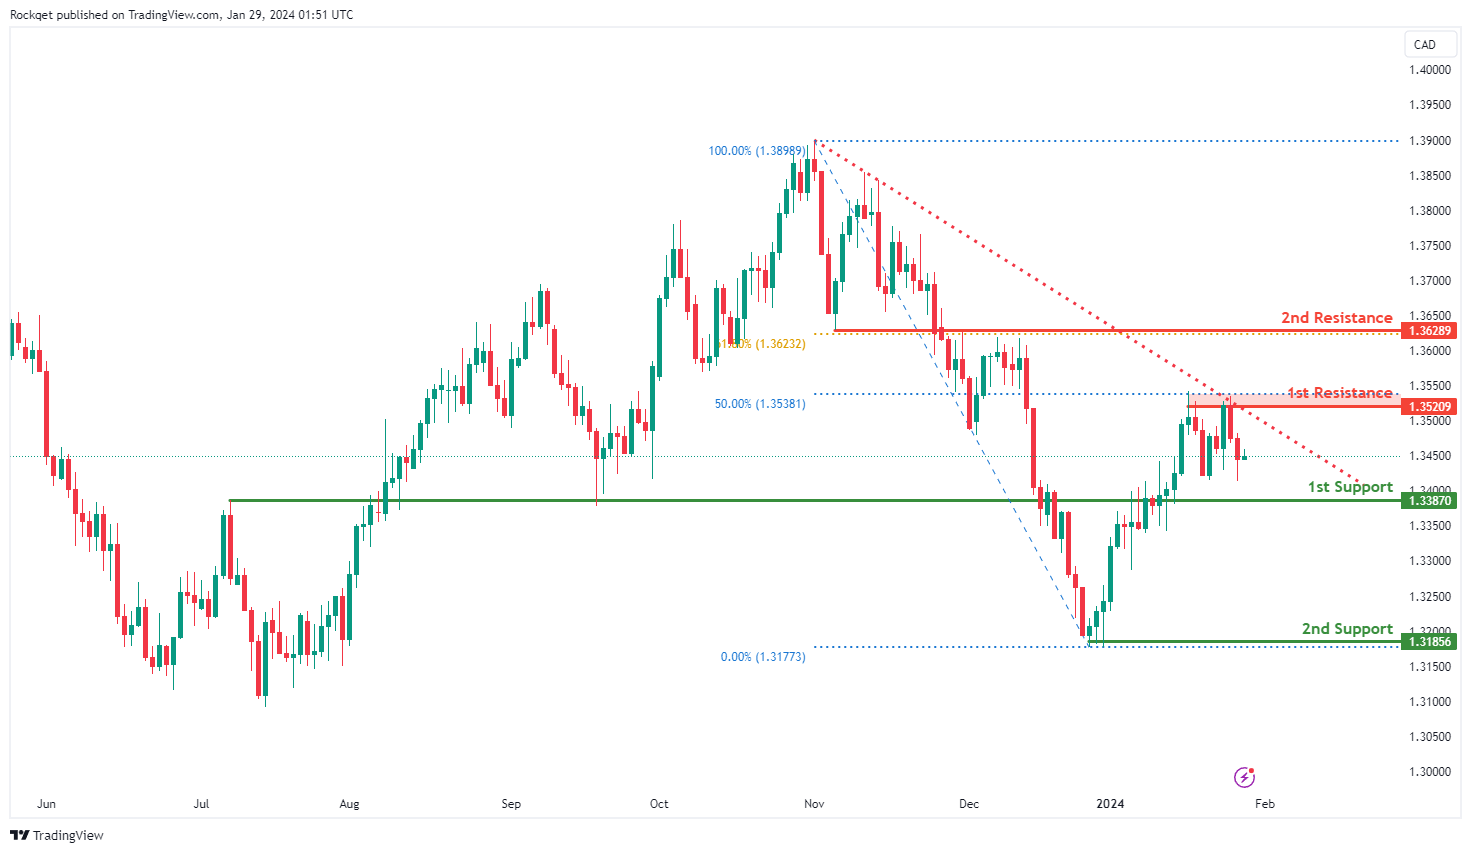
USD/CAD:
The USD/CAD chart currently exhibits a neutral bias. In this context, there is a potential scenario for price to fluctuate between the 1st support and the 1st resistance.
The 1st support level at 1.3387 is identified as an overlap support. Further below, the 2nd support level at 1.3185 is marked as a swing-low support, further reinforcing its importance as a key support level.
To the upside, the 1st resistance level at 1.3520 is identified as a pullback resistance that aligns close to the 50.00% Fibonacci Retracement level. Higher up, the 2nd resistance level at 1.3628 is noted as an overlap resistance that aligns with the 61.80% Fibonacci Retracement level, further reinforcing its significance as a potential resistance zone.
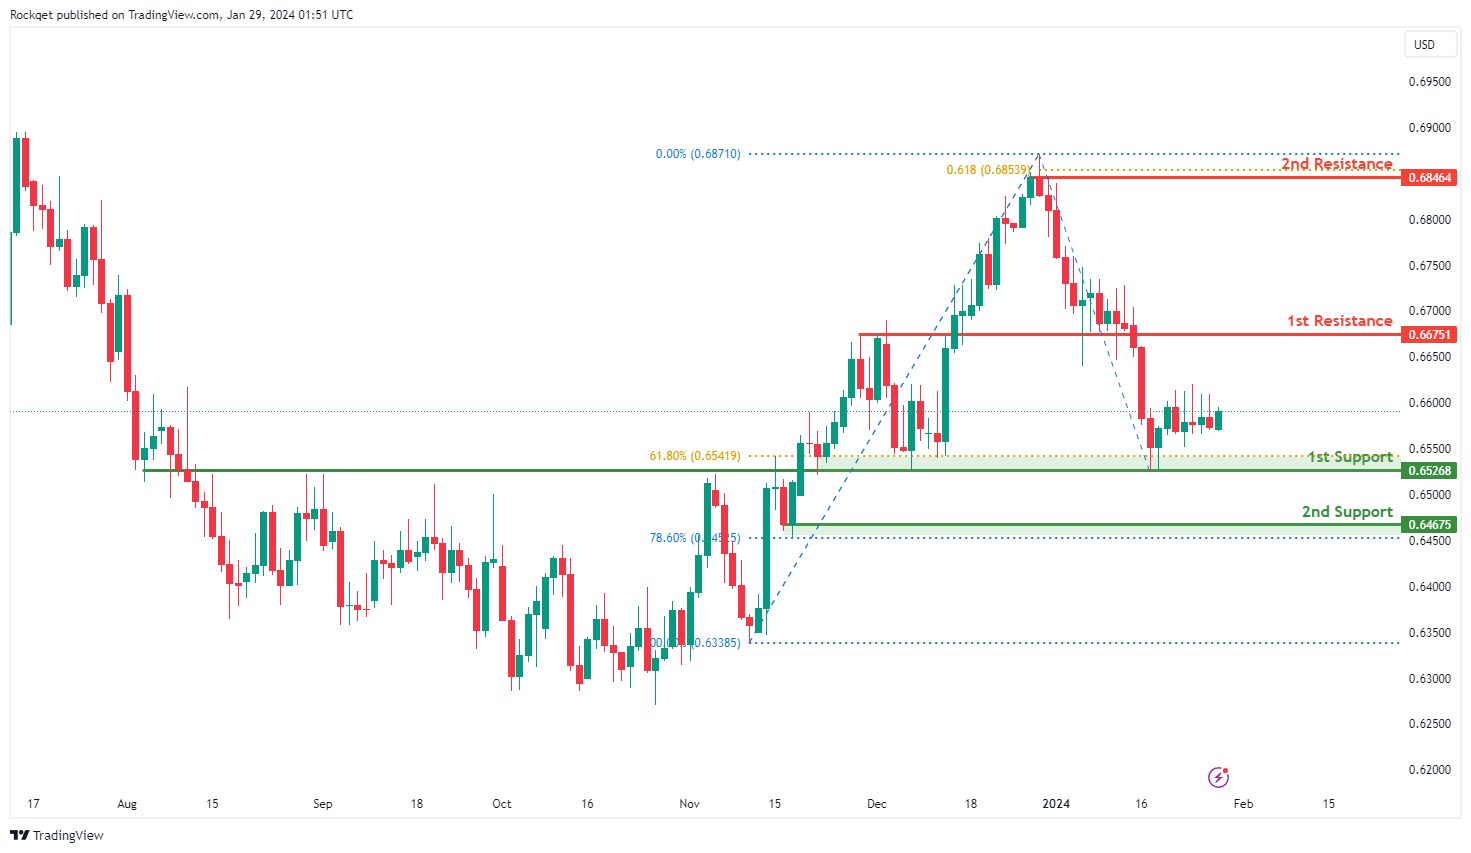
AUD/USD:
The AUD/USD chart currently exhibits a neutral bias. In this context, there is a potential scenario for price to fluctuate between the 1st support and the 1st resistance.
The 1st resistance level at 0.6675 is identified as a pullback resistance. Higher up, the 2nd resistance level at 0.6846 is noted as a swing-high resistance that aligns with the 61.80% Fibonacci Projection level, suggesting a potential barrier against further upside movement.
To the downside, the 1st support level at 0.6526 is identified as an overlap support that aligns close to the 61.80% Fibonacci Retracement level. Further below, the 2nd support level at 0.6467 is marked as a pullback support that aligns close to the 78.60% Fibonacci Retracement level, further reinforcing its importance as a key support level.
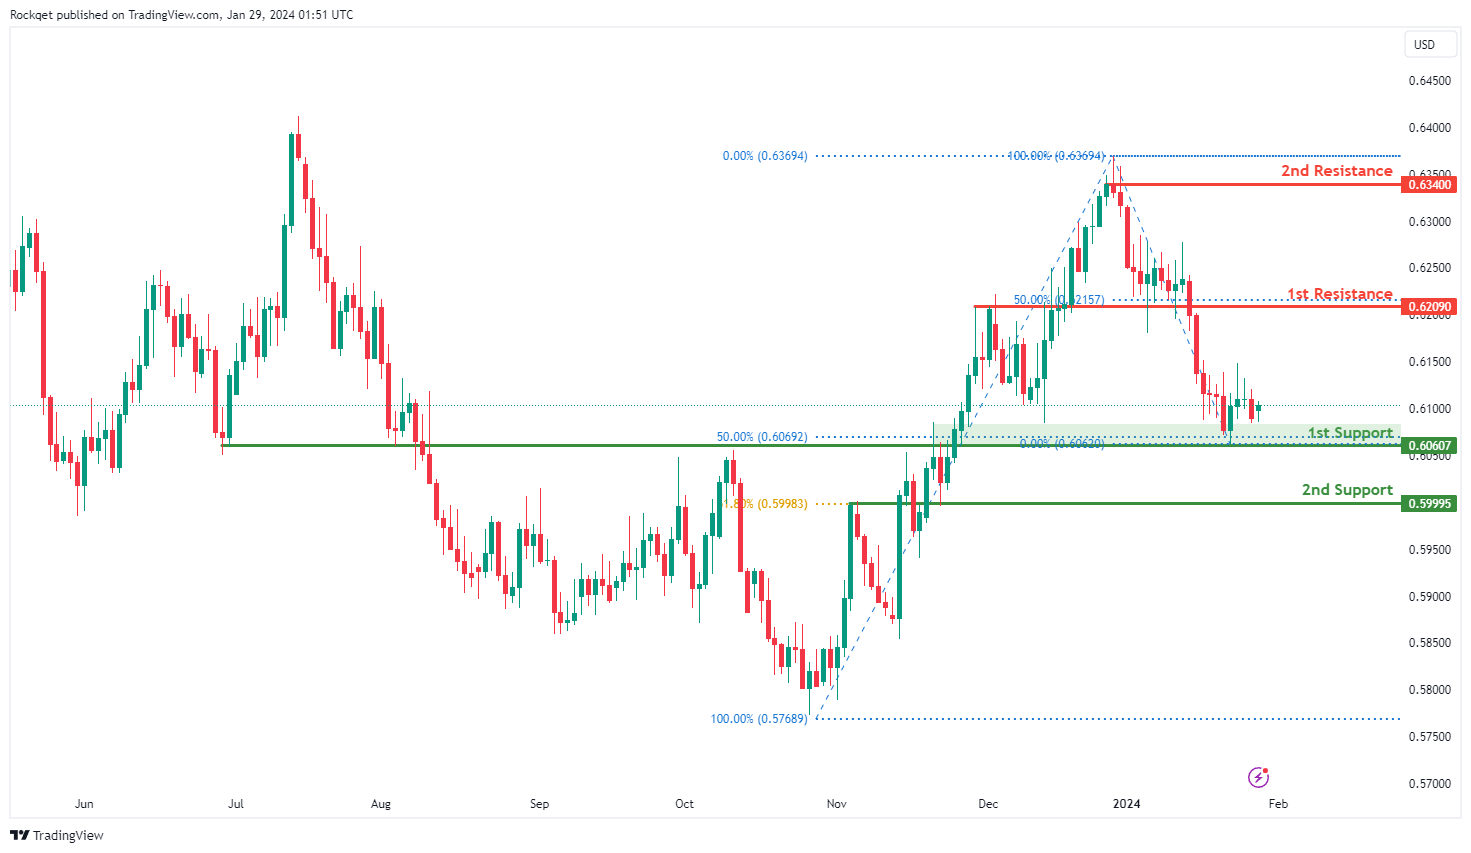
NZD/USD
The NZD/USD chart currently exhibits a neutral bias. In this context, there is a potential scenario for price to fluctuate between the 1st support and the 1st resistance.
The 1st support level at 0.6060 is identified as an overlap support that aligns close to the 50.00% Fibonacci Retracement level. Further below, the 2nd support level at 0.5999 is also identified as an overlap support that coincides with the 61.80% Fibonacci Retracement level, further reinforcing its significance as a potential support zone.
On the resistance side, the 1st resistance level at 0.6209 is characterized as an overlap resistance that aligns with the 50.00% Fibonacci Retracement level. Higher up, the 2nd resistance level at 0.6340 is categorized as a swing-high resistance, suggesting a potential barrier against further upside movement.
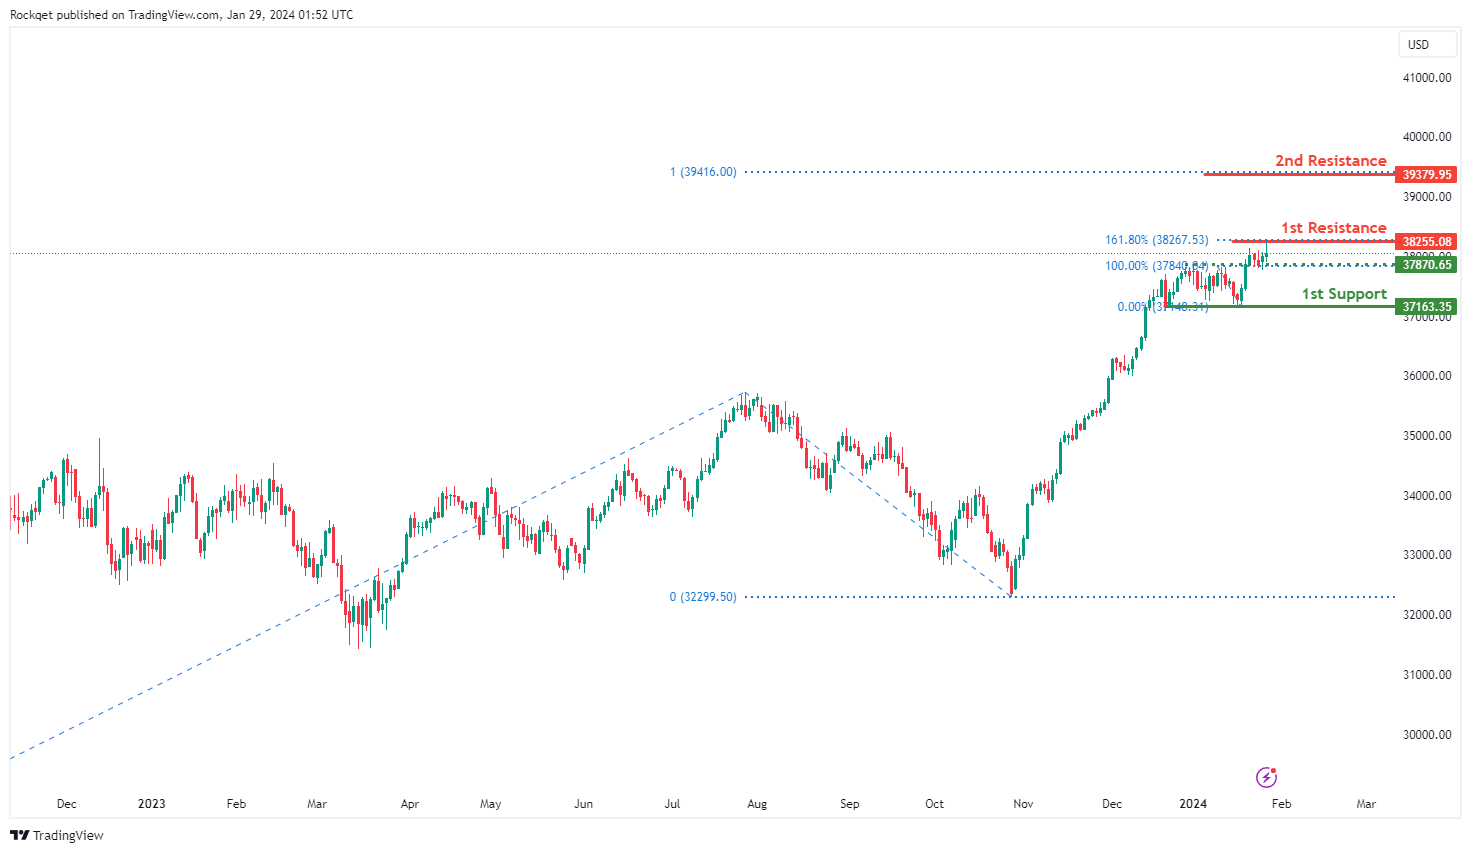
DJ30:
The DJ30 (Dow Jones Industrial Average) chart currently exhibits a neutral bias, indicating a lack of a clear trend direction. In this context, there is a potential scenario for price to fluctuate between the 1st support and the 1st resistance levels.
The intermediate support level at 37,870.65 is identified as an overlap support. Further below, the 1st support level at 37,163.35 is recognized as a pullback support, providing additional reinforcement to the potential support zone.
On the resistance side, the 1st resistance level at 38,255.08 is highlighted as a level where a pullback resistance that aligns with the 161.80% Fibonacci Extension level. Higher up, the 2nd resistance level at 39,379.95 is identified as a level that aligns with the 100.00% Fibonacci Projection level, reinforcing its potential as a key resistance level.
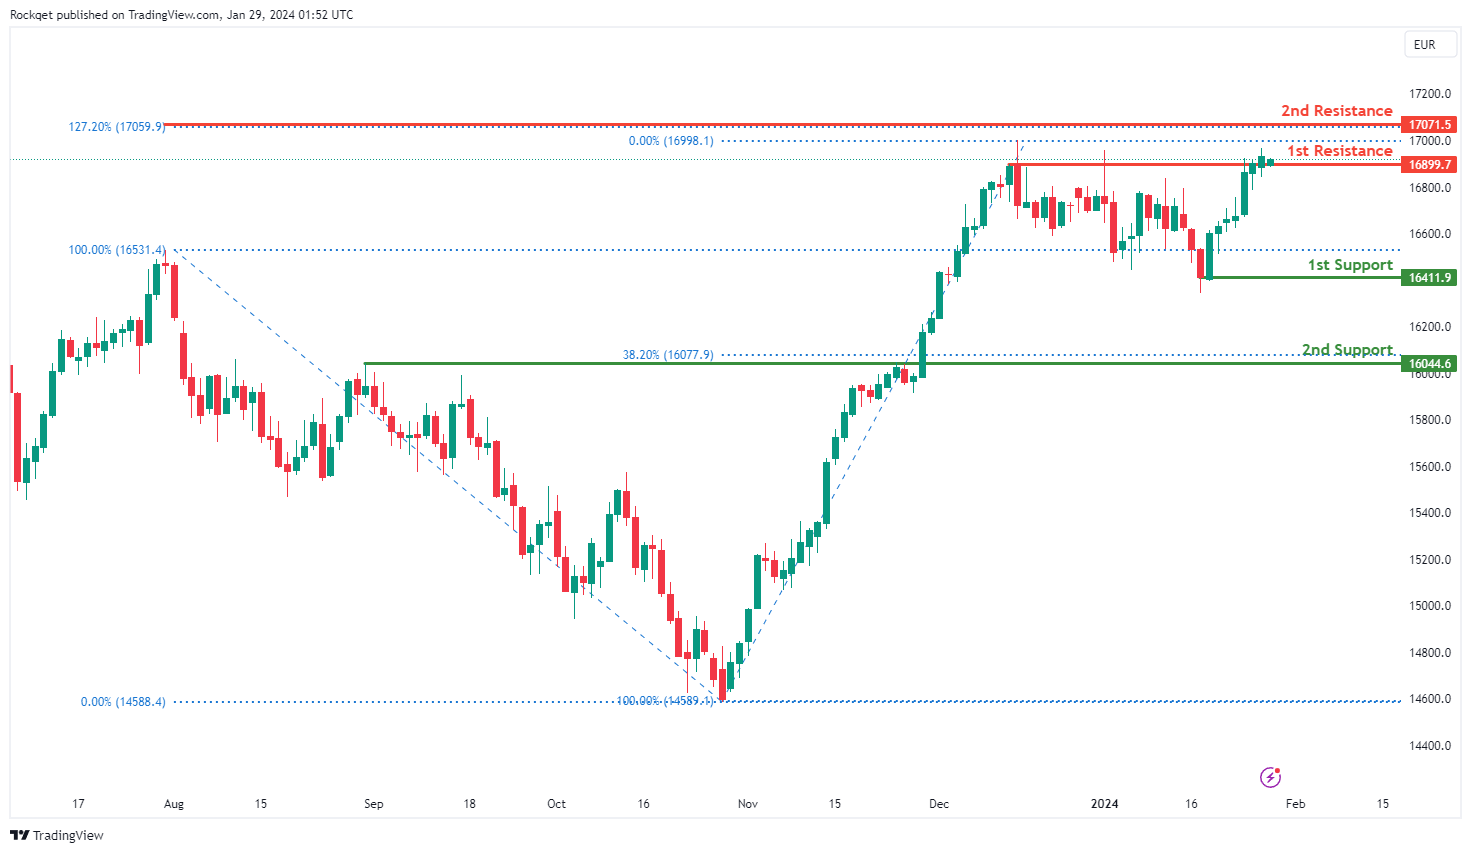
GER40:
The GER40 (DAX) chart currently exhibits an overall bullish momentum, indicating a prevailing upward trend. In this context, there is a potential scenario for price break above the 1st resistance and make a bullish move towards the 2nd resistance.
The 1st resistance at 16,899.70 is highlighted as a swing-high resistance. Higher up, the 2nd resistance level at 17,071.50 is noted as a level that aligns with the 127.20% Fibonacci Extension level, indicating a potential barrier against further upward movement.
On the support side, the 1st support level at 16,411.90 is identified as a pullback support. Further below, the 2nd support level at 16,044.60 is also recognized as a pullback support that coincides with the 38.20% Fibonacci Retracement level, further reinforcing its importance as a key support zone.
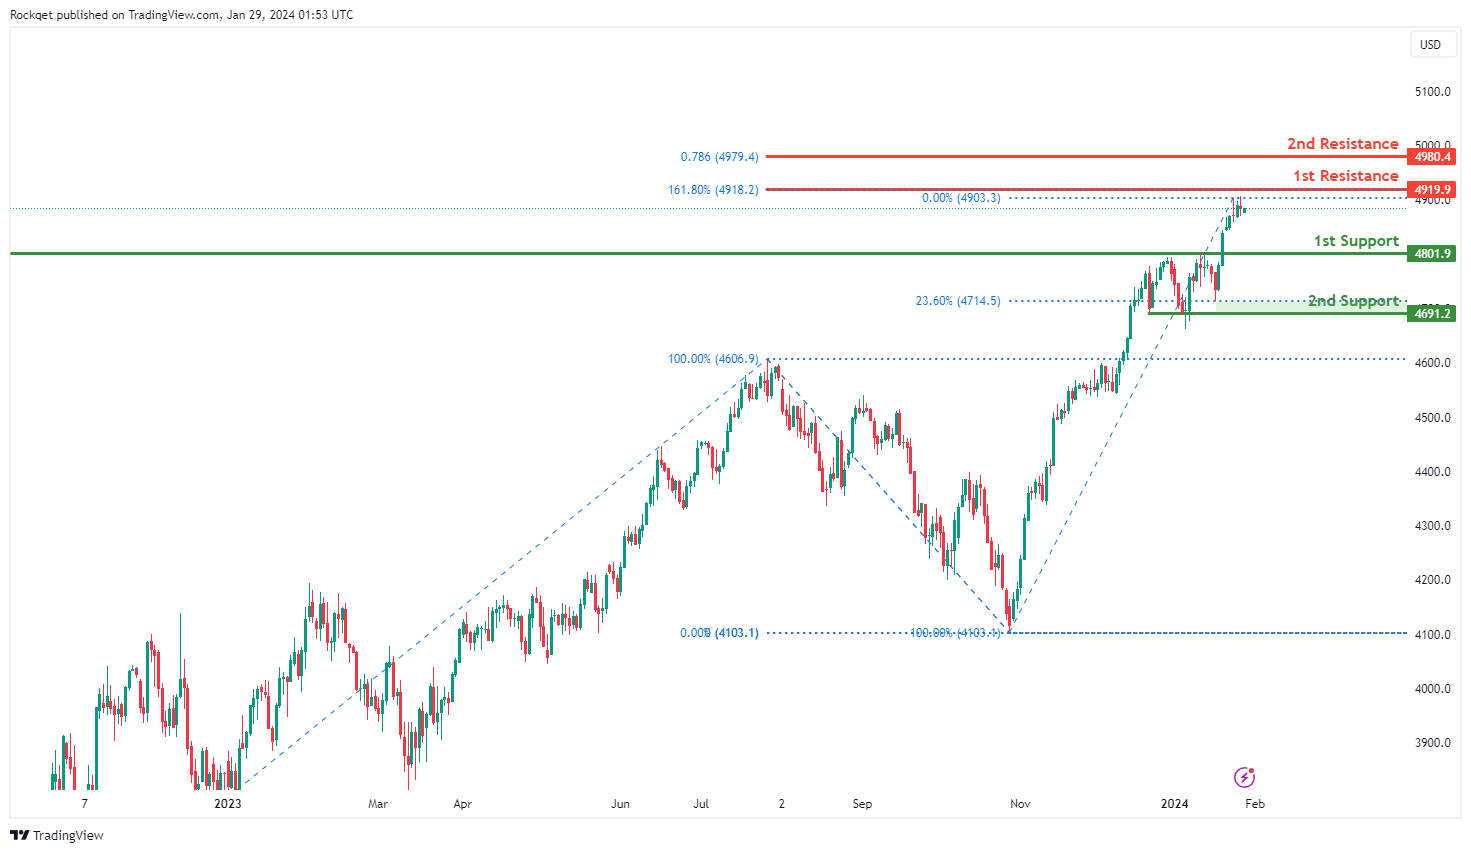
US500:
The US500 (S&P 500) chart currently exhibits an overall bullish momentum, indicating a prevailing upward trend. In this context, there is a potential scenario for price to make a bullish upward movement towards the 1st resistance.
The 1st resistance level at 4,919.90 is identified as a level that aligns with the 161.80% Fibonacci Extensions level. Additionally, the 2nd resistance level at 4,980.40 is acknowledged as a level that aligns with the 78.60% Fibonacci Projection level, suggesting a key barrier against further upward movement.
On the support side, the 1st support level at 4,801.90 is identified as a pullback support. Further below, the 2nd support level at 4,691.20 is also recognized as a pullback support that aligns close to the 23.60% Fibonacci Retracement level, providing additional strength to this potential support zone.
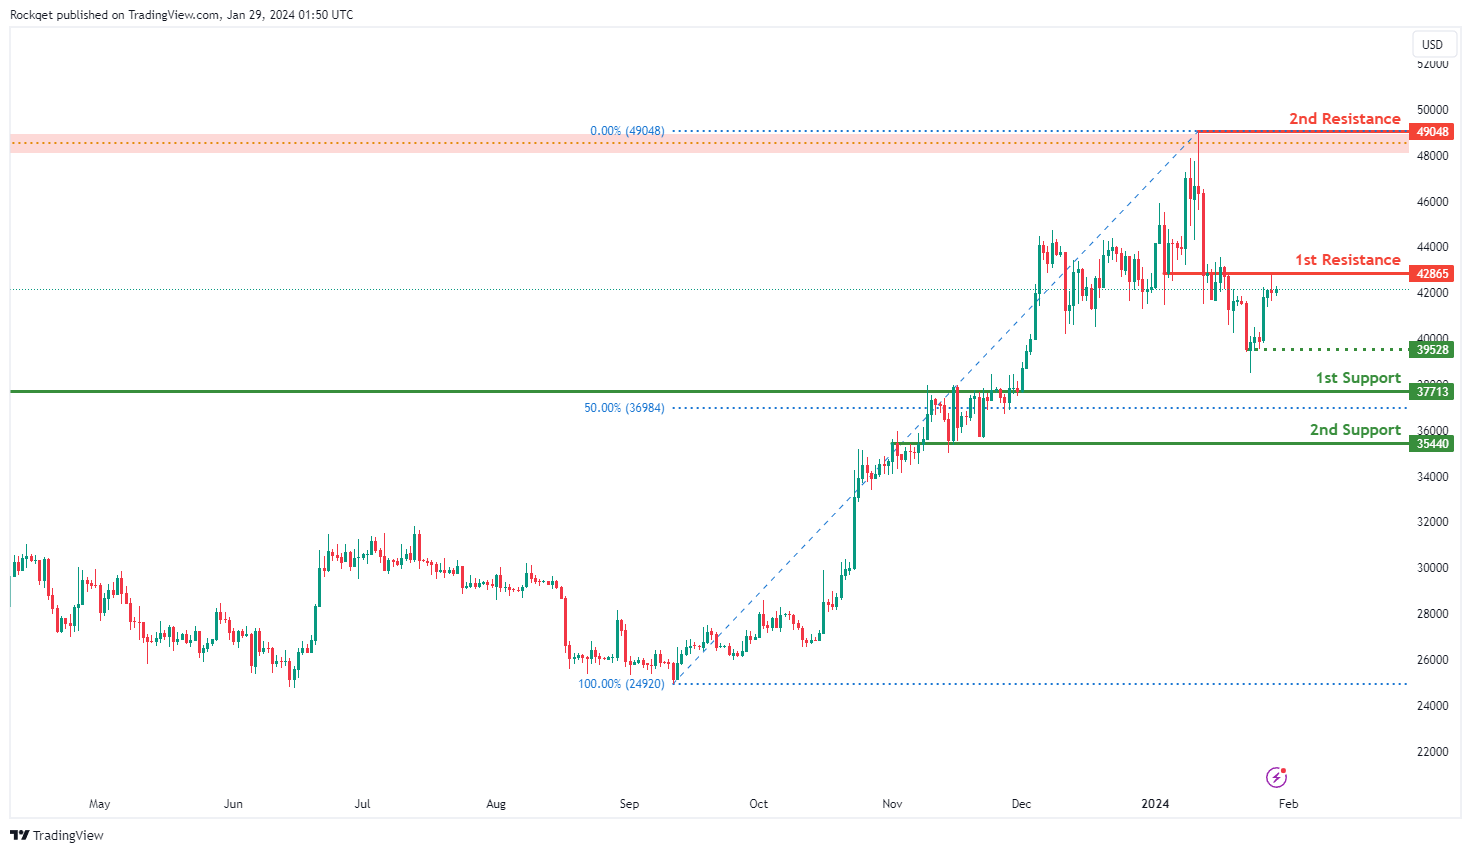
BTC/USD:
The BTC/USD (Bitcoin/US Dollar) chart currently has a bearish overall momentum, and your analysis suggests the potential for a bearish reaction off the 1st resistance level followed by a drop towards the 1st support level.
The 1st support level at 37,713 is considered significant as it is identified as a pullback support. This level represents a potential area where buying interest may emerge, providing temporary support for the price of Bitcoin.
The 2nd support level at 35,440 is identified as an overlap support and coincides with the 50% Fibonacci Retracement level. This suggests that it is a price level with historical significance, and the Fibonacci confluence adds to its importance as a potential support zone.
On the resistance side, the 1st resistance level at 42,865 is characterized as an overlap resistance, indicating that it has historically acted as both support and resistance.
The 2nd resistance level at 49,048 is categorized as a swing high resistance, suggesting that it represents a historical point where the price has encountered significant resistance.
Intermediate support at 39,528 is also mentioned as a multi-swing low support, indicating its historical significance.
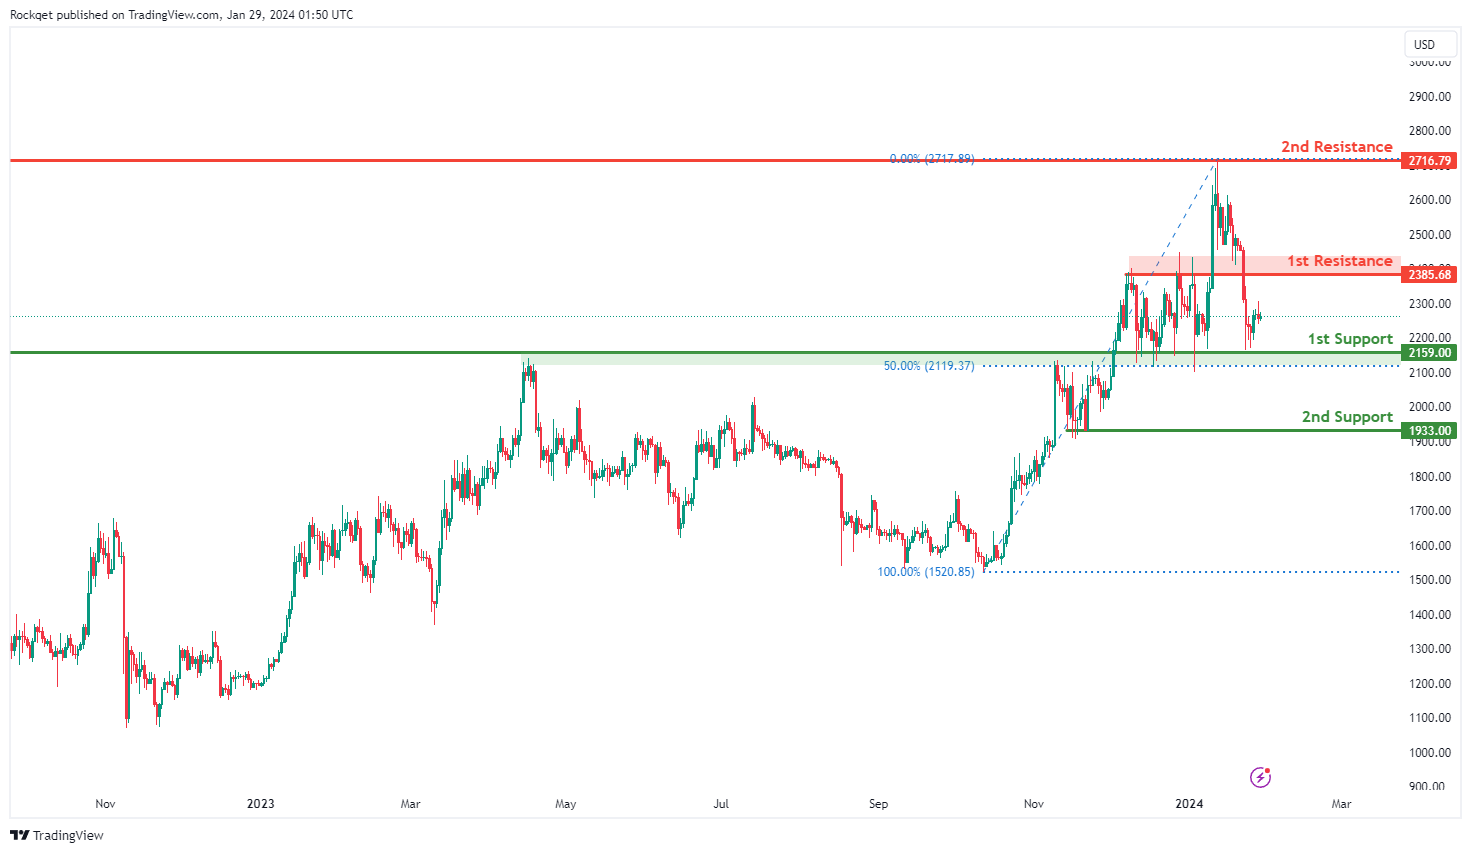
ETH/USD:
The ETH/USD (Ethereum/US Dollar) chart currently exhibits a bullish overall momentum, and your analysis suggests the potential for a bullish continuation towards the 1st resistance level.
The 1st support level at 2,159.00 is considered significant as it is identified as an overlap support and coincides with the 50% Fibonacci Retracement level. This level represents a potential area where buying interest may emerge, providing temporary support for the price of Ethereum. The Fibonacci confluence adds to its importance as a potential support zone.
The 2nd support level at 1,933.00 is identified as a multi-swing low support, indicating its historical significance as a support level.
On the resistance side, the 1st resistance level at 2,385.68 is characterized as a pullback resistance, suggesting that it represents a historical point where the price has encountered resistance.
The 2nd resistance level at 2,716.79 is categorized as a swing high resistance, indicating that it represents a historical point where the price has encountered significant resistance.
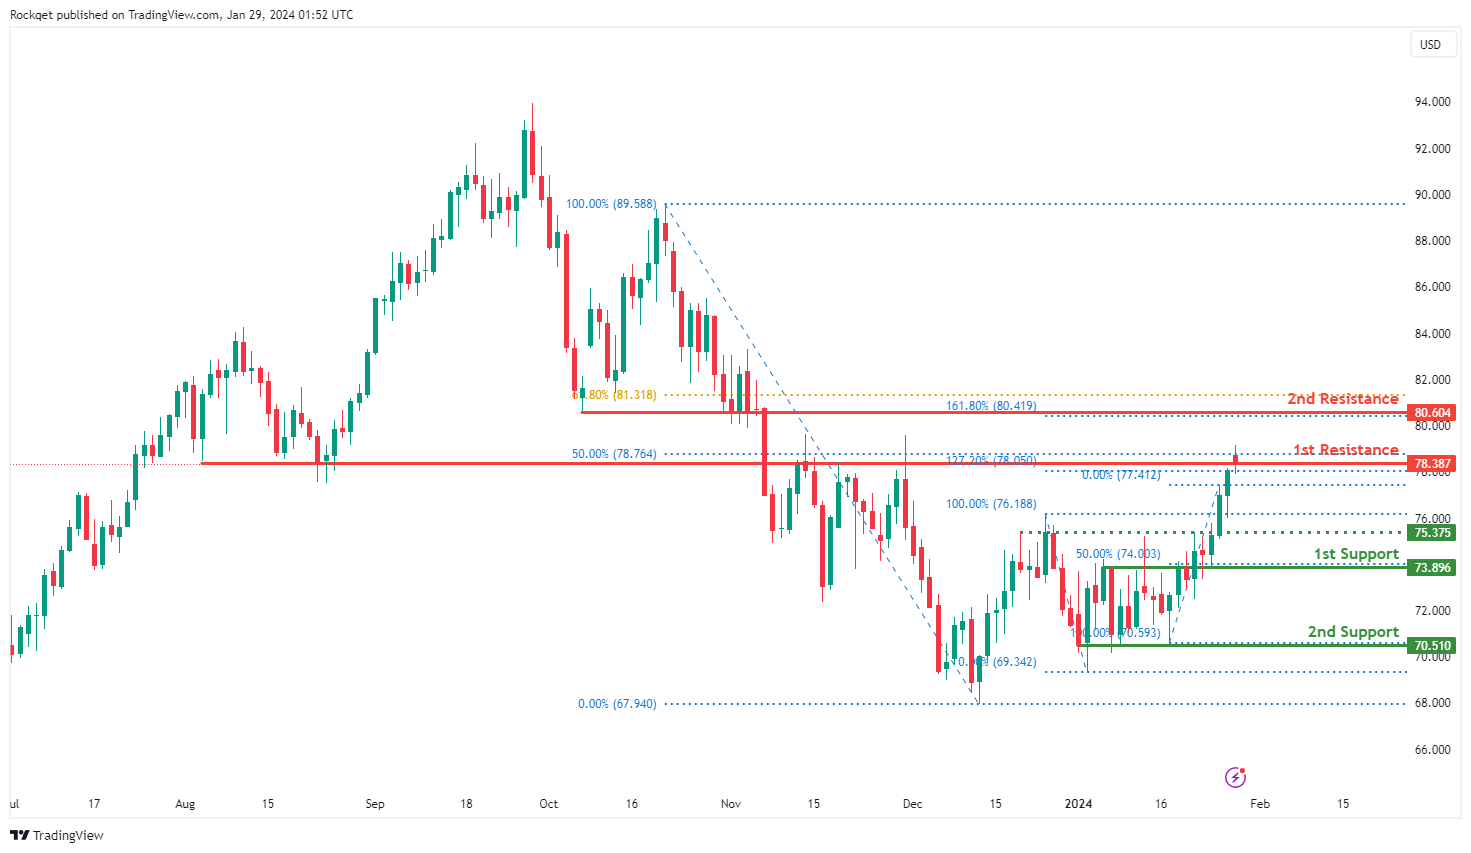
WTI/USD:
The WTI (West Texas Intermediate) chart currently exhibits an overall bullish momentum. In this context, there is potential for the price to make a bearish reaction off the 1st resistance in the short term before resuming the uptrend.
The intermediate support level at 75.37 is noted as a pullback support while the 1st support level at 73.89 is identified as an overlap support that coincides with the 50.00% Fibonacci Retracement level. Further below, the 2nd support level at 70.51 is identified as a pullback support, reinforcing its significance as a level where the price has previously found support during a bullish move.
On the resistance side, the 1st resistance level at 78.38 is characterized as an overlap resistance that coincides with a confluence of Fibonacci levels i.e. the 50.00% Retracement and the 127.20% Extension levels. Higher up, the 2nd resistance level at 80.60 is categorized as a pullback resistance that aligns close to the 61.80% Fibonacci Retracement level, further highlighting its importance as a potential resistance point.
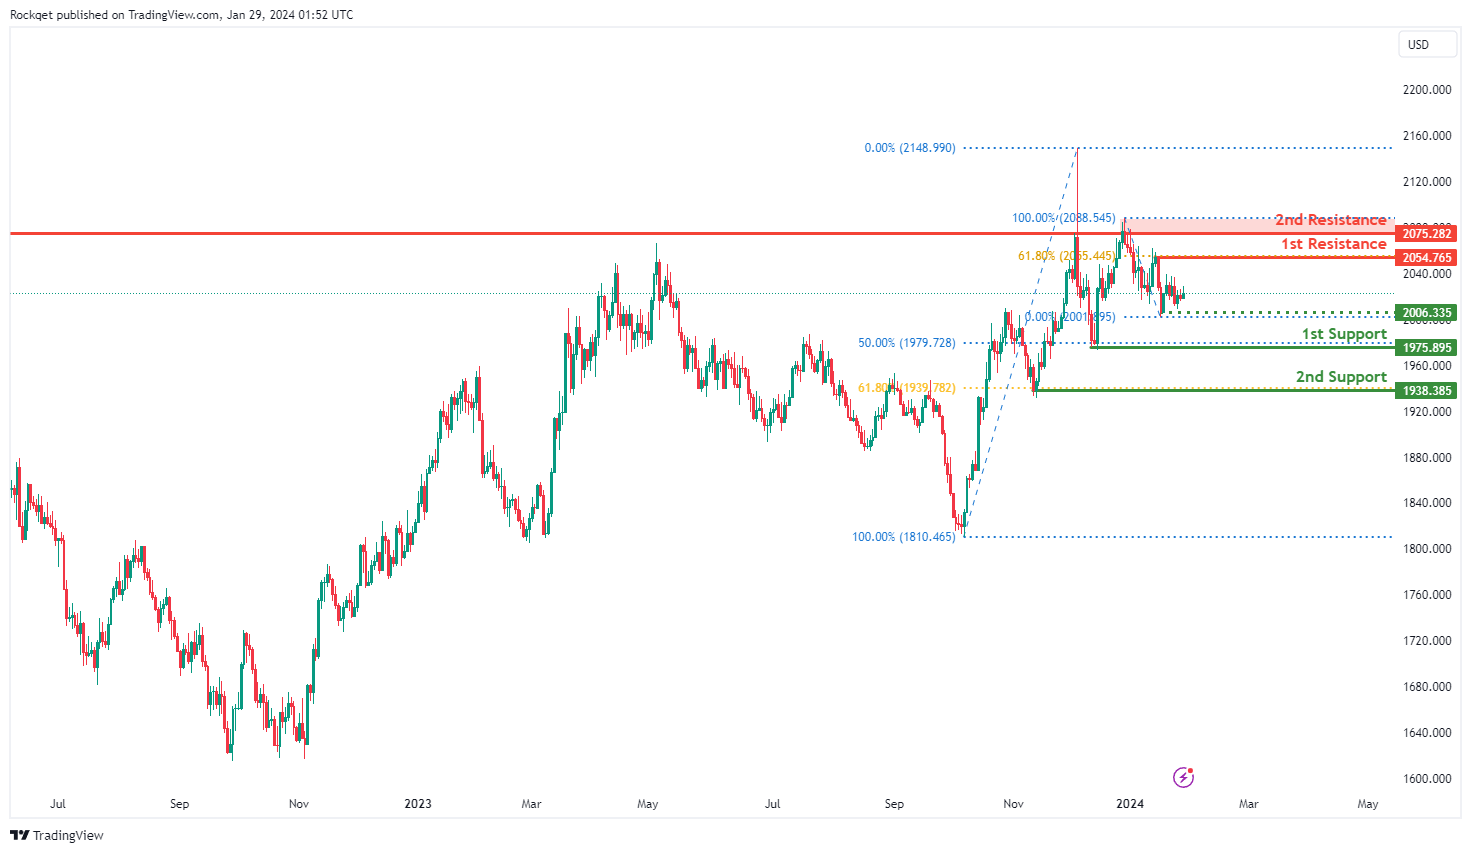
XAU/USD (GOLD):
The XAU/USD (Gold/US Dollar) chart currently has a bearish overall momentum. According to your analysis, there is potential for a bearish continuation in the price towards the 1st support level.
The 1st support level at 1975.89 is considered significant for several reasons. It is identified as a swing low support, indicating that this price level has historically acted as a significant low point on the chart. Additionally, it coincides with the 50% Fibonacci Retracement level, suggesting that this level corresponds to a previous significant low point on the chart, and the Fibonacci confluence adds to its importance as a potential support level.
The 2nd support level at 1938.38 is also identified as a swing low support and coincides with the 61.80% Fibonacci Retracement level, further reinforcing its significance as a potential support zone during a bearish move.
On the resistance side, the 1st resistance level at 2054.76 is characterized as a swing high resistance and coincides with the 61.80% Fibonacci Retracement level. This suggests that it may serve as a potential barrier for further upward price movement.
The 2nd resistance level at 2075.28 is also categorized as a swing high resistance, emphasizing its historical significance as a level where the price has encountered resistance.
Additionally, there is an intermediate support level at 2006.33, identified as a swing low support, which adds an additional layer of support during the bearish move.


