
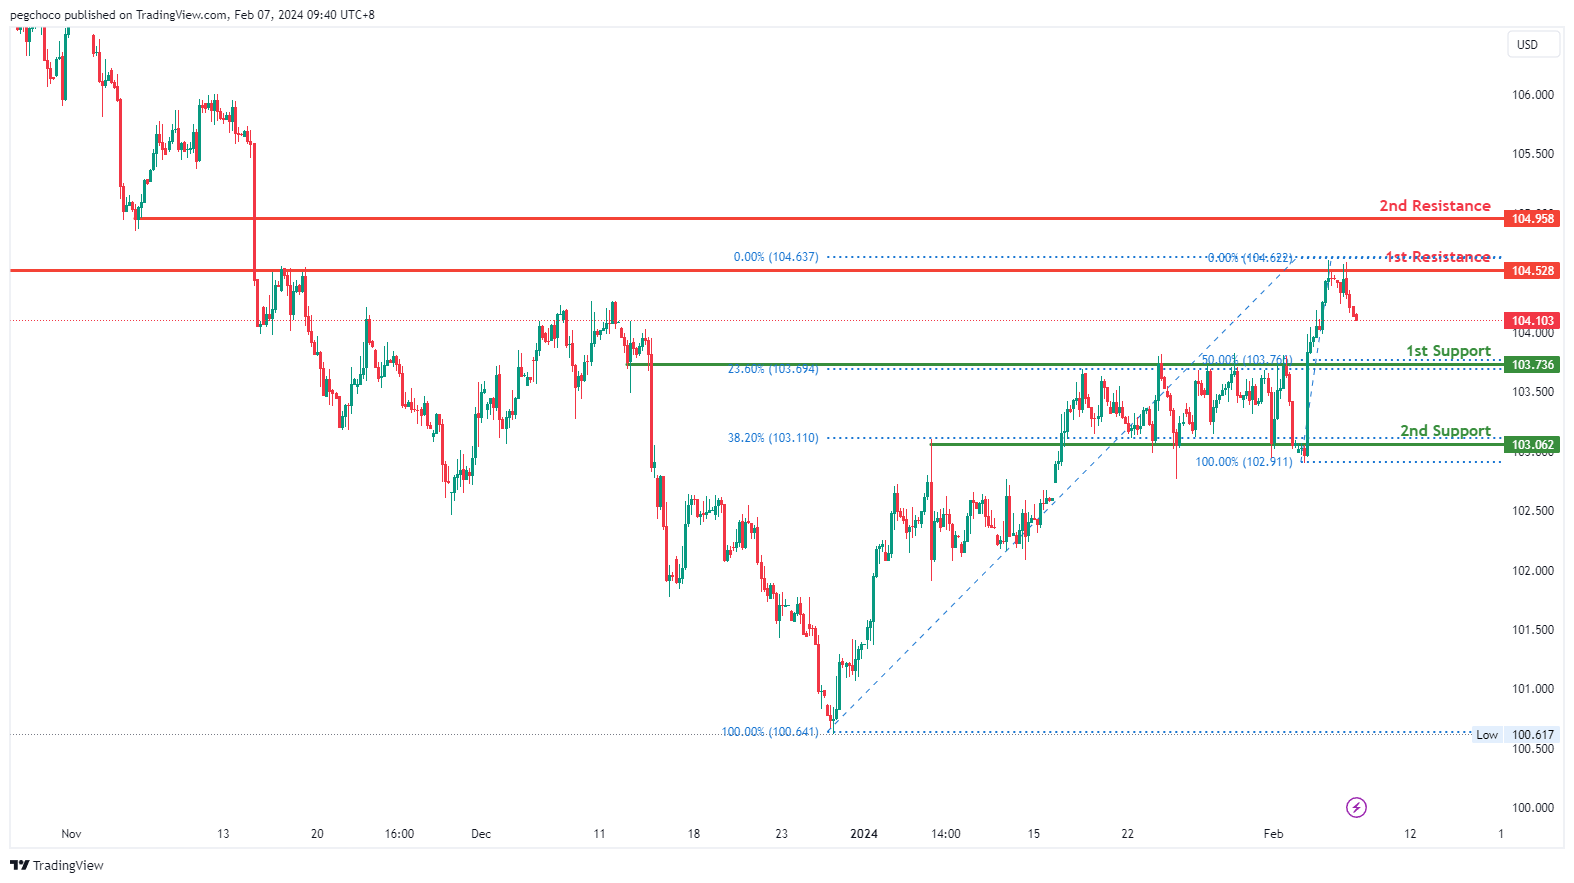
DXY:
The DXY chart currently exhibits a bearish overall momentum, indicating a downward trend. The price could potentially make a bearish continuation towards the 1st support.
The 1st support level at 103.73 is identified as a pullback support, reinforced by the presence of the 50% and 23.60% Fibonacci Retracement levels, indicating Fibonacci confluence.
There is also a 2nd support level at 103.06, characterized as another pullback support with the 23.60% Fibonacci Retracement, further emphasizing its importance as a potential support zone.
On the resistance side, the 1st resistance level at 104.52 is categorized as an overlap resistance, suggesting historical significance as a point of potential resistance.
Additionally, there is a 2nd resistance level at 104.95, identified as a pullback resistance, indicating a level where selling pressure may emerge.
EUR/USD:
The EUR/USD chart currently shows a bearish overall momentum, indicating a downward trend. The price could potentially experience a rise towards the 1st resistance in the short term before reversing off it and dropping towards the 1st support.
The 1st support level at 1.0725 is identified as an overlap support, coinciding with the 61.80% Fibonacci Retracement level, which suggests it has historical significance and may act as a strong support level.
There is also a 2nd support level at 1.0665, characterized as another overlap support, further reinforcing its importance as a potential support zone.
On the resistance side, the 1st resistance level at 1.0794 is categorized as an overlap resistance, with the presence of the 38.20% Fibonacci Retracement, indicating its historical significance as a potential resistance point.
Additionally, there is a 2nd resistance level at 1.0832, identified as a pullback resistance, coinciding with the 61.80% Fibonacci Retracement, which could act as a barrier for further upside movement.

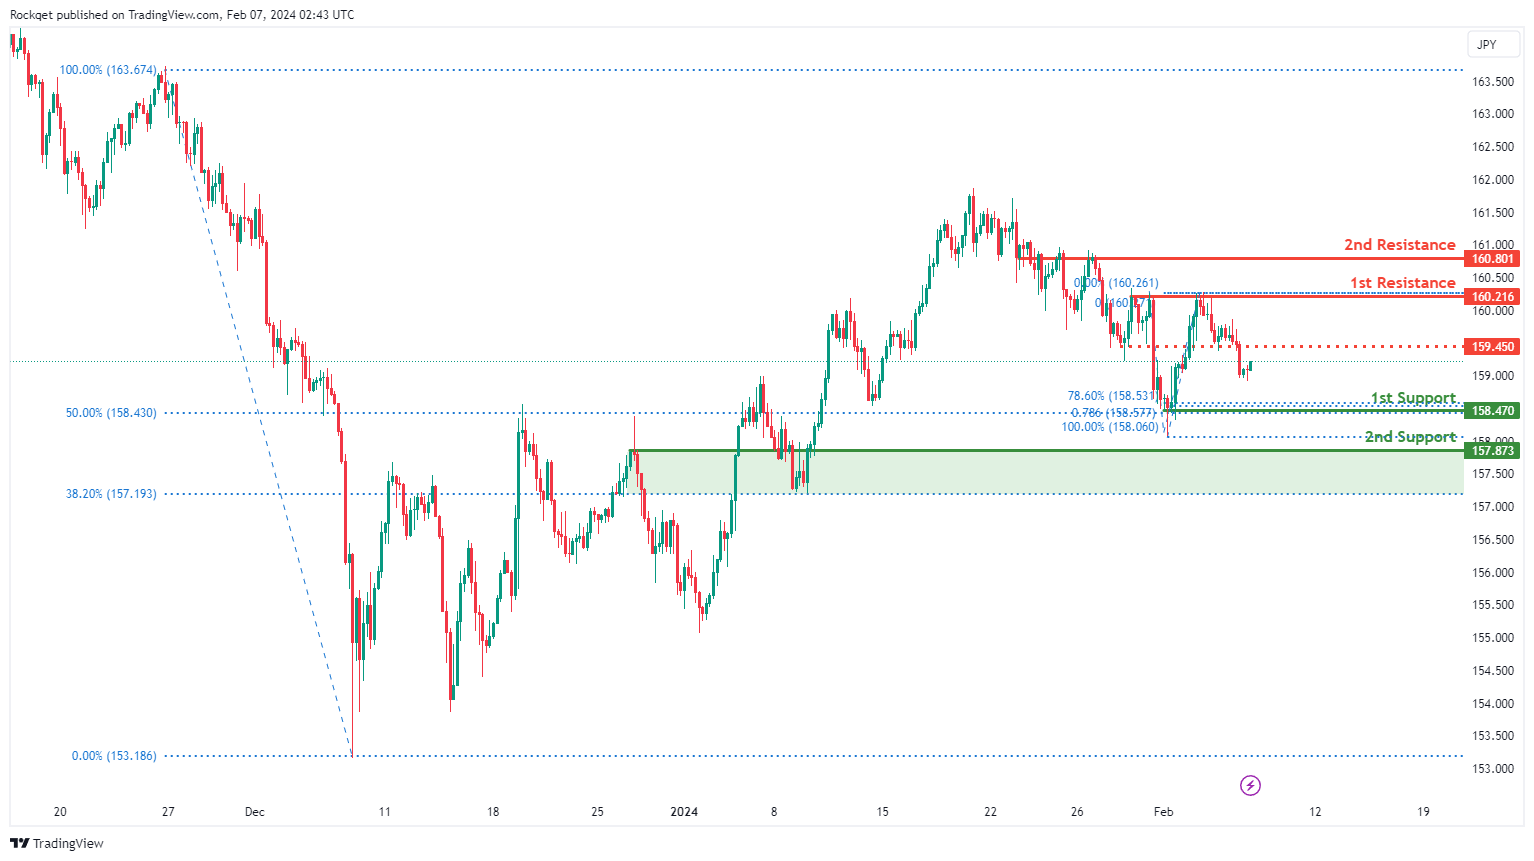
EUR/JPY:
The EUR/JPY chart currently exhibits a bearish overall momentum, indicating a downward trend. Several factors contribute to this bearish sentiment, suggesting the potential for a short-term rise towards the 1st resistance before reversing downwards towards the 1st support.
The 1st support at 158.470 is considered significant for multiple reasons. It aligns with a swing low support, coinciding with the 78.60% and 50% Fibonacci Retracement and the 78.60% Fibonacci Projection, indicating a historical level where buying interest has previously emerged.
The 2nd support at 157.873 is also recognized as an overlap support and aligns with the 38.20% Fibonacci Retracement, providing additional strength to the potential support zone.
On the resistance side, the 1st resistance at 160.216 is highlighted as a level where selling pressure may emerge, representing a pullback resistance.
The 2nd resistance at 160.801 is also recognized, coinciding with an overlap resistance, further reinforcing this resistance level. An intermediate resistance level at 159.45 is identified, aligning with a pullback resistance.
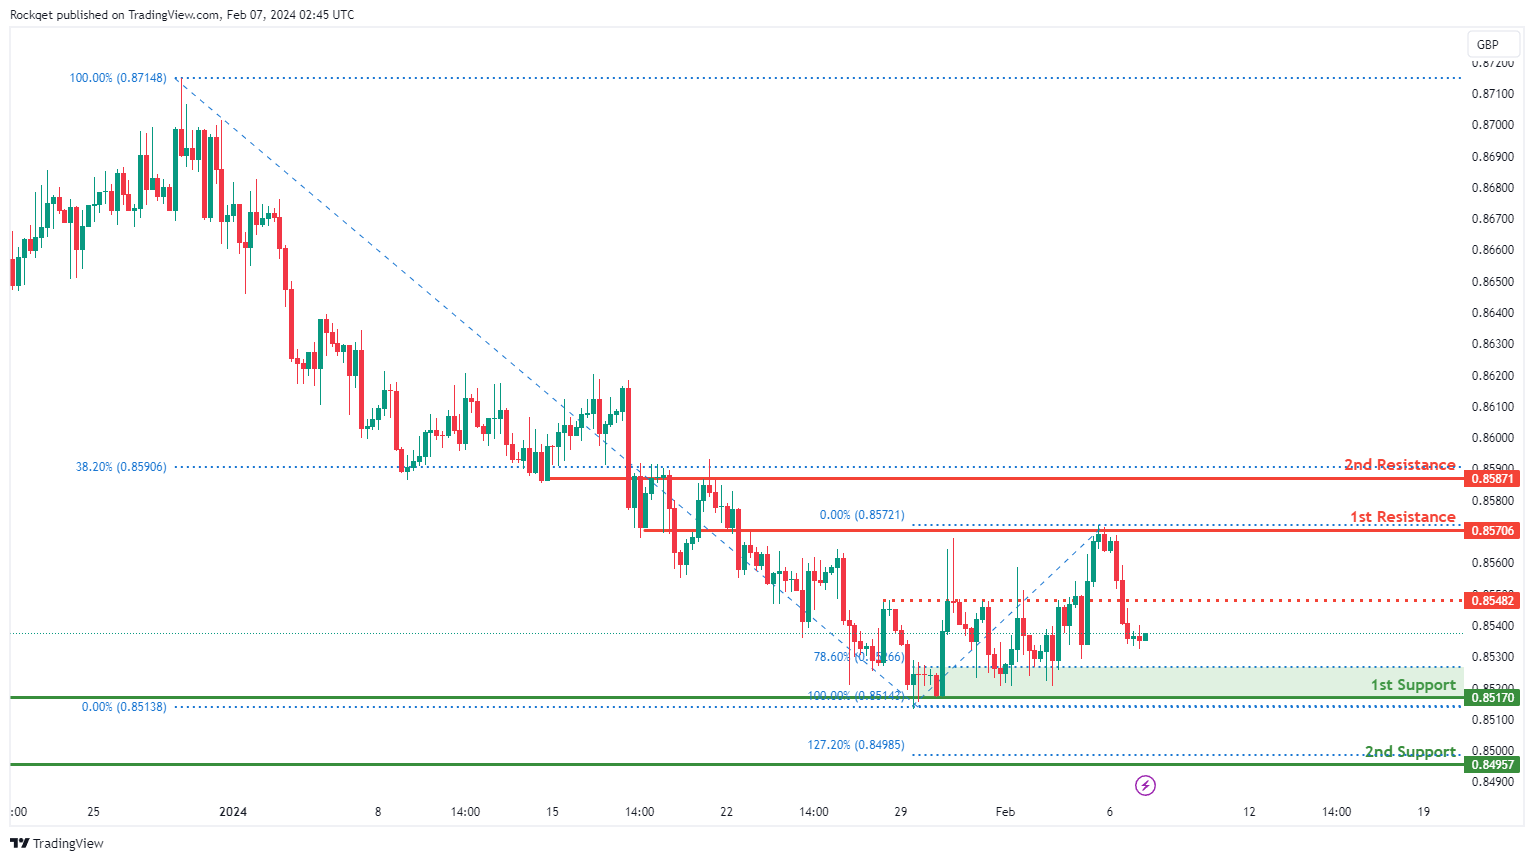
EUR/GBP:
The EUR/GBP chart currently demonstrates a bearish overall momentum, suggesting a downward trend. There are several factors contributing to this sentiment, indicating the potential for a bearish continuation towards the 1st support.
The 1st support at 0.85170 is considered significant for several reasons. Firstly, it is identified as a multi-swing low support, indicating a level where buying interest has historically emerged. Additionally, this support level aligns with the 78.60% Fibonacci Retracement, adding further strength to its significance.
The 2nd support at 0.84957 is recognized as an overlap support and coincides with the 127.20% Fibonacci Extension, providing additional validation to the support zone.
On the resistance side, the 1st resistance at 0.85706 is highlighted as a level where selling pressure may emerge, representing an overlap resistance.
The 2nd resistance at 0.85871 is also recognized, coinciding with both an overlap resistance and the 38.20% Fibonacci Retracement, further reinforcing its significance. An intermediate resistance level at 0.85482 is identified, aligning with an overlap resistance.
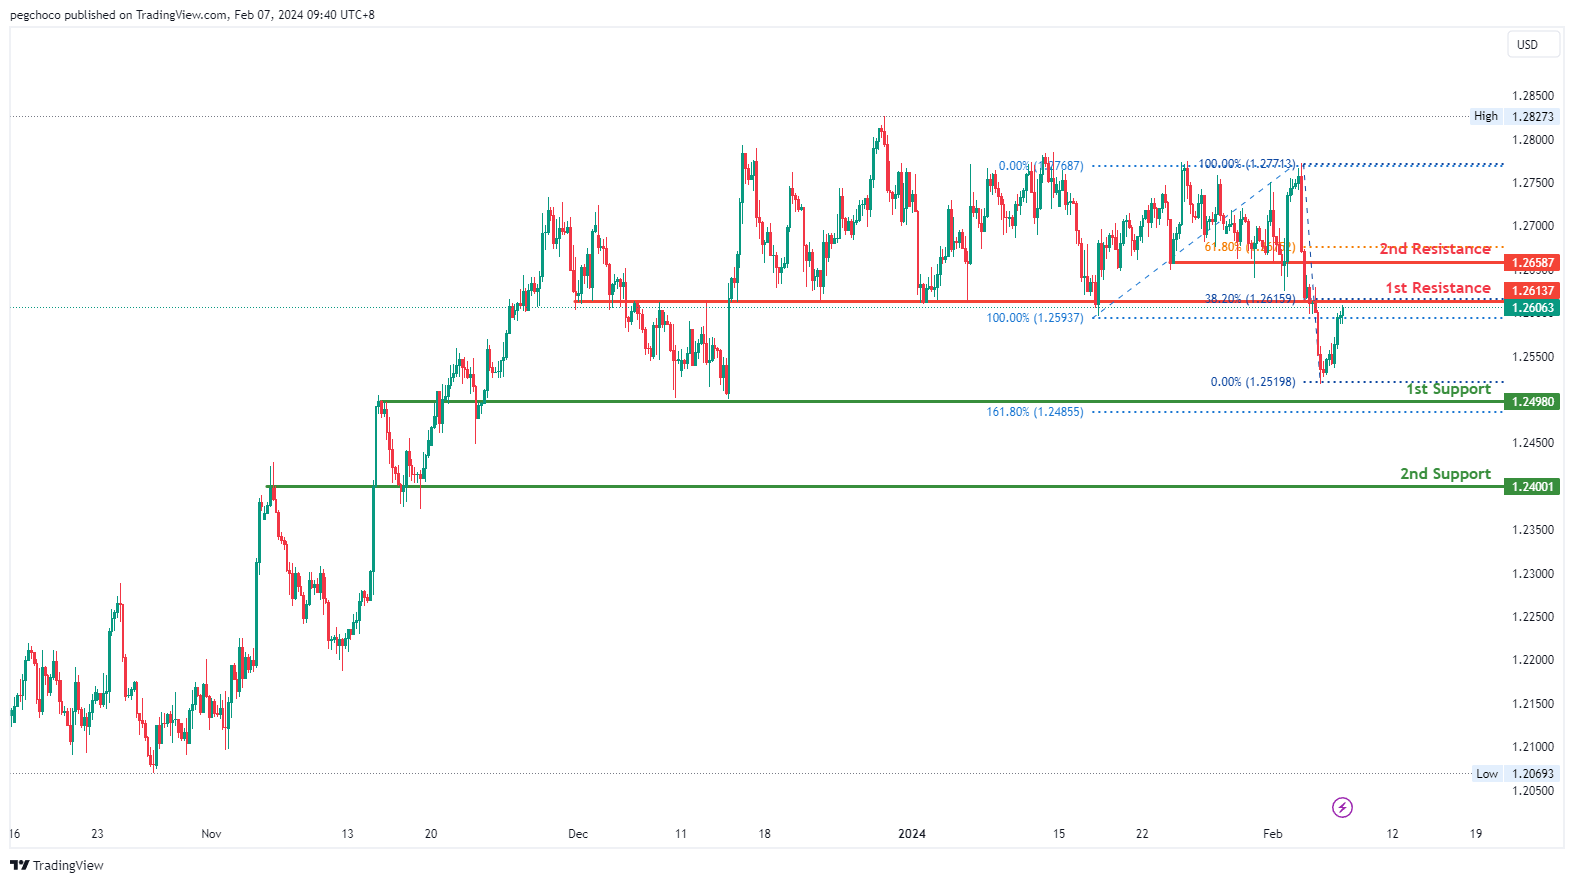
GBP/USD:
The GBP/USD chart currently indicates a bearish overall momentum, suggesting a downward trend. The price could potentially experience a bearish reaction off the 1st resistance and drop to the 1st support.
The 1st support level at 1.2498 is identified as an overlap support, coinciding with the 161.80% Fibonacci Extension, indicating its historical significance as a potential strong support level.
Additionally, there is a 2nd support level at 1.2400, characterized as another overlap support, further reinforcing its importance as a potential support zone.
On the resistance side, the 1st resistance level at 1.2613 is categorized as a pullback resistance, with the presence of the 38.20% Fibonacci Retracement, indicating its historical significance as a potential point of resistance.
Furthermore, there is a 2nd resistance level at 1.2658, identified as a pullback resistance, coinciding with the 61.80% Fibonacci Retracement, which could act as a barrier for further upside movement.
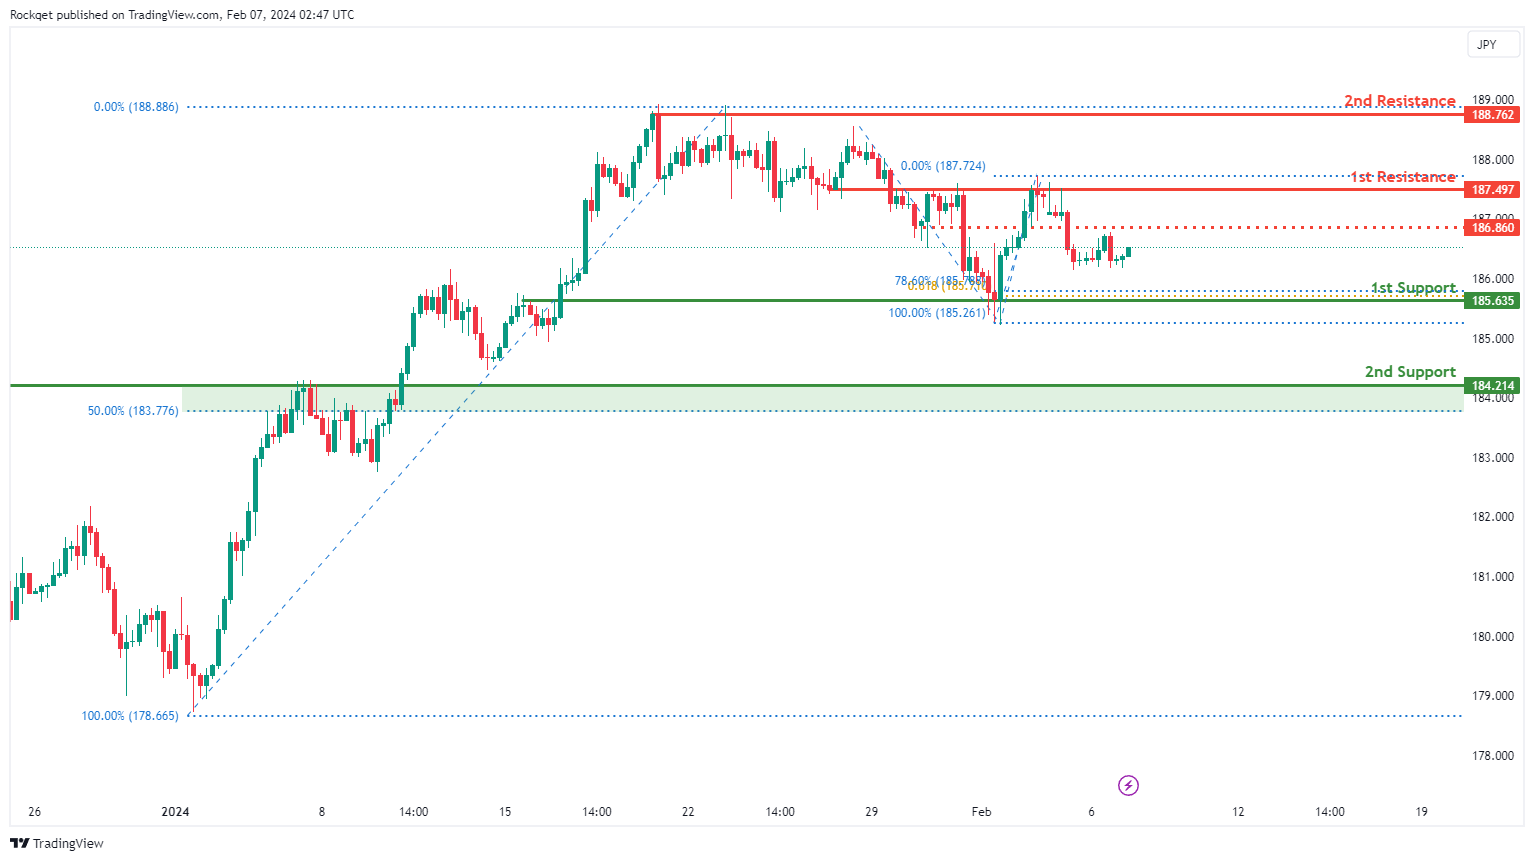
GBP/JPY:
The GBP/JPY chart currently shows a neutral momentum, indicating a lack of clear directional bias. There is a possibility for price to fluctuate between the 1st resistance and 1st support levels.
The 1st support at 185.635 holds significance due to several factors. Firstly, it is identified as an overlap support, indicating a historical level where buying interest has emerged. Additionally, it coincides with the 78.60% Fibonacci Retracement and the 61.80% Fibonacci Projection, adding further confluence to this support level.
The 2nd support at 184.214 is recognized as an overlap support and aligns with the 50% Fibonacci Retracement, reinforcing its significance as a potential support zone.
On the resistance side, the 1st resistance at 187.497 is highlighted as a level where selling pressure may emerge, representing an overlap resistance.
The 2nd resistance at 188.762 is also recognized, coinciding with a swing high resistance level. An intermediate resistance level at 186.86 is identified, aligning with an overlap resistance.
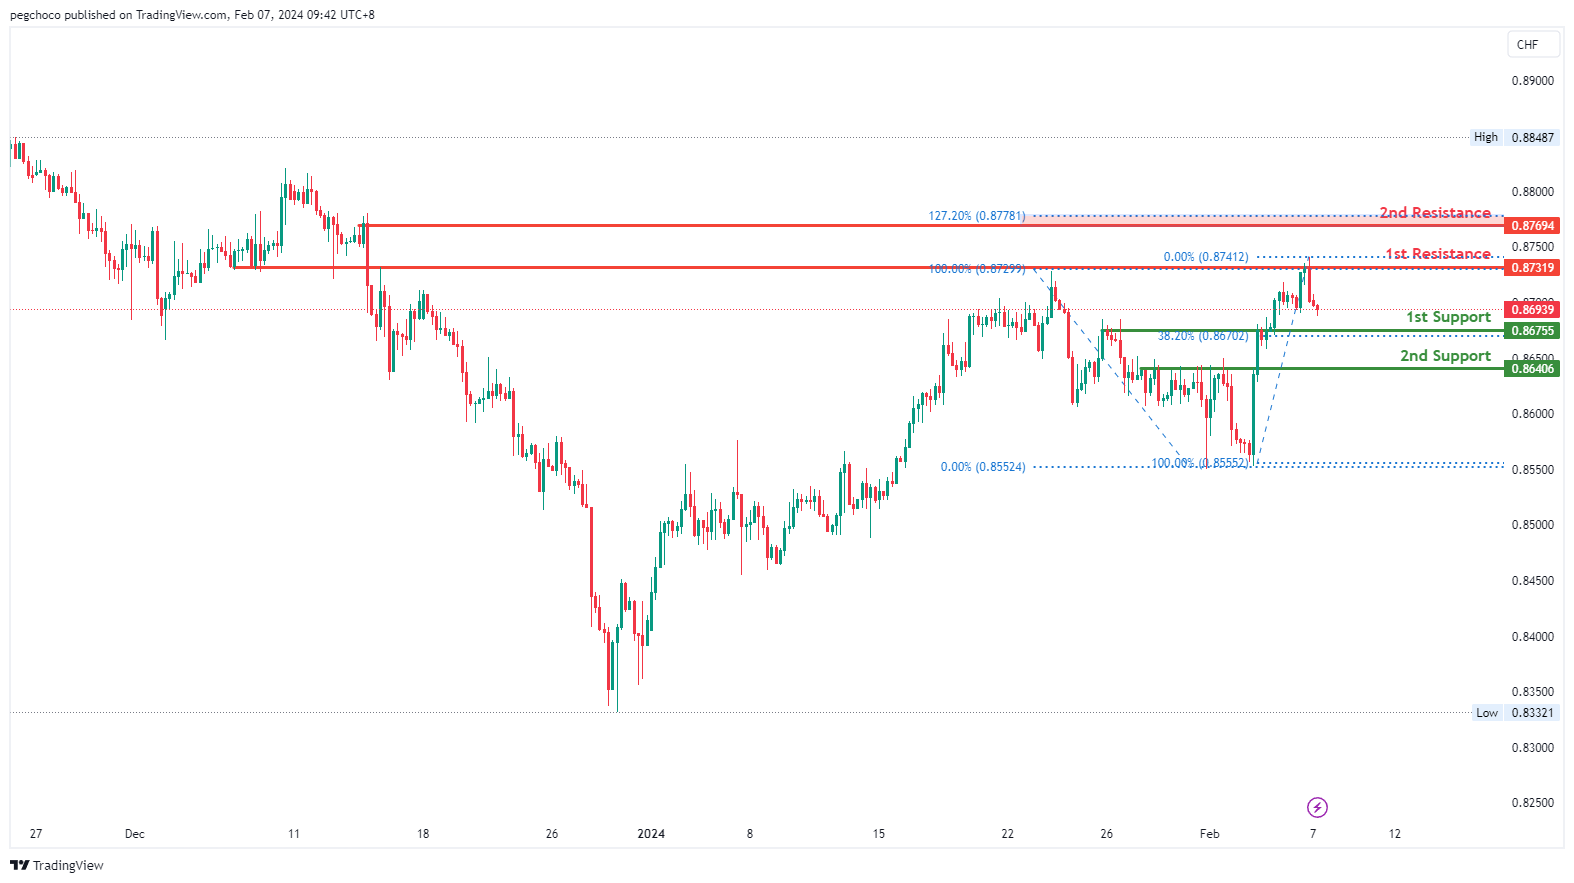
USD/CHF:
The USD/CHF chart currently indicates a bullish overall momentum, suggesting an upward trend. The price could potentially experience a bullish bounce off the 1st support and head towards the 1st resistance.
The 1st support level at 0.8675 is identified as a pullback support, coinciding with the 23.60% Fibonacci Retracement, indicating its historical significance as a potential strong support level.
Additionally, there is a 2nd support level at 0.8640, characterized as another pullback support, further reinforcing its importance as a potential support zone.
On the resistance side, the 1st resistance level at 0.8731 is categorized as an overlap resistance, suggesting historical significance as a point where the price has encountered resistance.
Furthermore, there is a 2nd resistance level at 0.8769, identified as a swing high resistance, coinciding with the 127.20% Fibonacci Extension, which could act as a barrier for further upside movement.
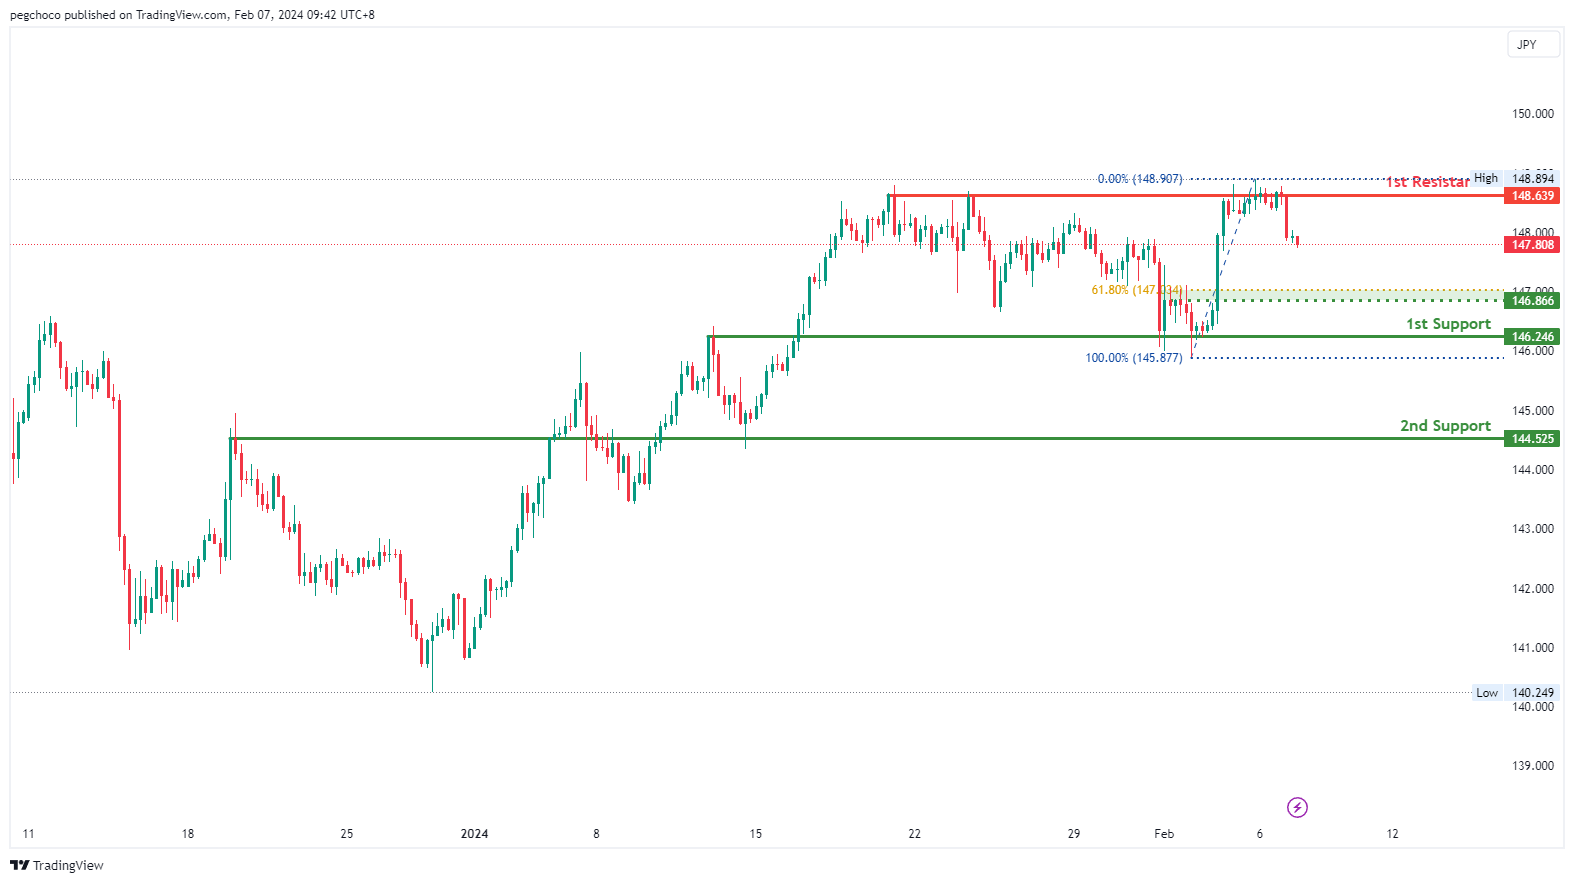
USD/JPY:
The USD/JPY chart currently reflects a bearish overall momentum, indicating a downward trend. The price could potentially continue its bearish movement towards the 1st support level.
The 1st support level at 146.24 is identified as an overlap support, suggesting historical significance as a potential strong support level.
Additionally, there is a 2nd support level at 144.52, characterized as another overlap support, further emphasizing its importance as a potential support zone.
On the resistance side, the 1st resistance level at 148.63 is categorized as a multi-swing high resistance, indicating that it represents a historical point where the price has encountered resistance.
Moreover, the intermediate support at 146.85 is considered a pullback support, coinciding with the 61.80% Fibonacci Retracement, which further reinforces its significance as a potential support level.
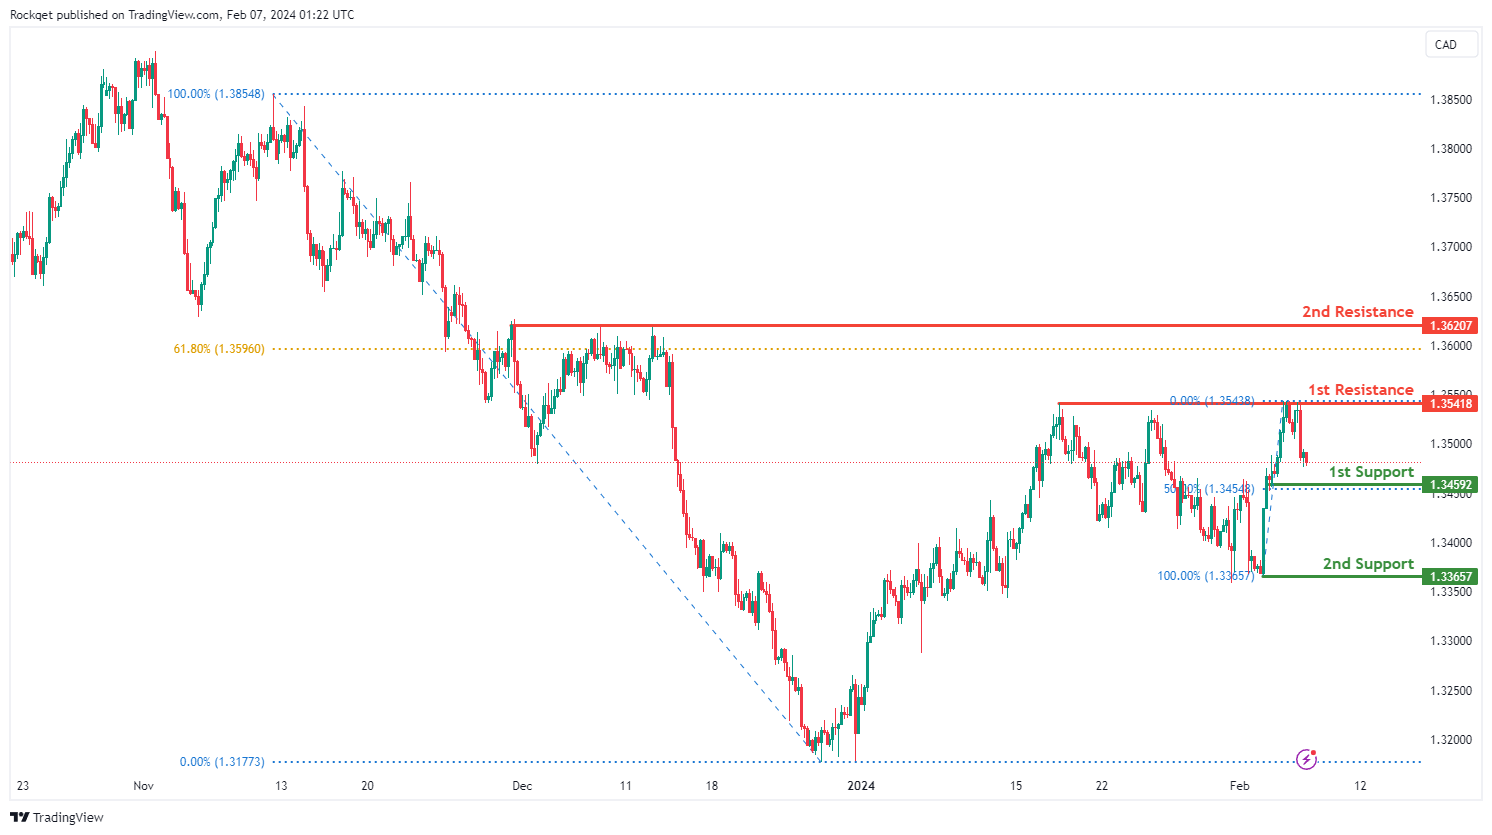
USD/CAD:
The USD/CAD chart currently exhibits an overall bearish momentum. In this context, there is a potential scenario for price to fall towards the 1st support.
The 1st support level at 1.3459 is identified as a pullback support that aligns with the 50.00% Fibonacci Retracement level. Further below, the 2nd support level at 1.3365 is marked as a swing-low support, further emphasizing its importance as a potential support zone.
To the upside, the 1st resistance level at 1.3541 is identified as a pullback resistance. Higher up, the 2nd resistance level at 1.3620 is also noted as a pullback resistance that aligns close to the 61.80% Fibonacci Retracement level, further highlighting its importance as a potential resistance point.
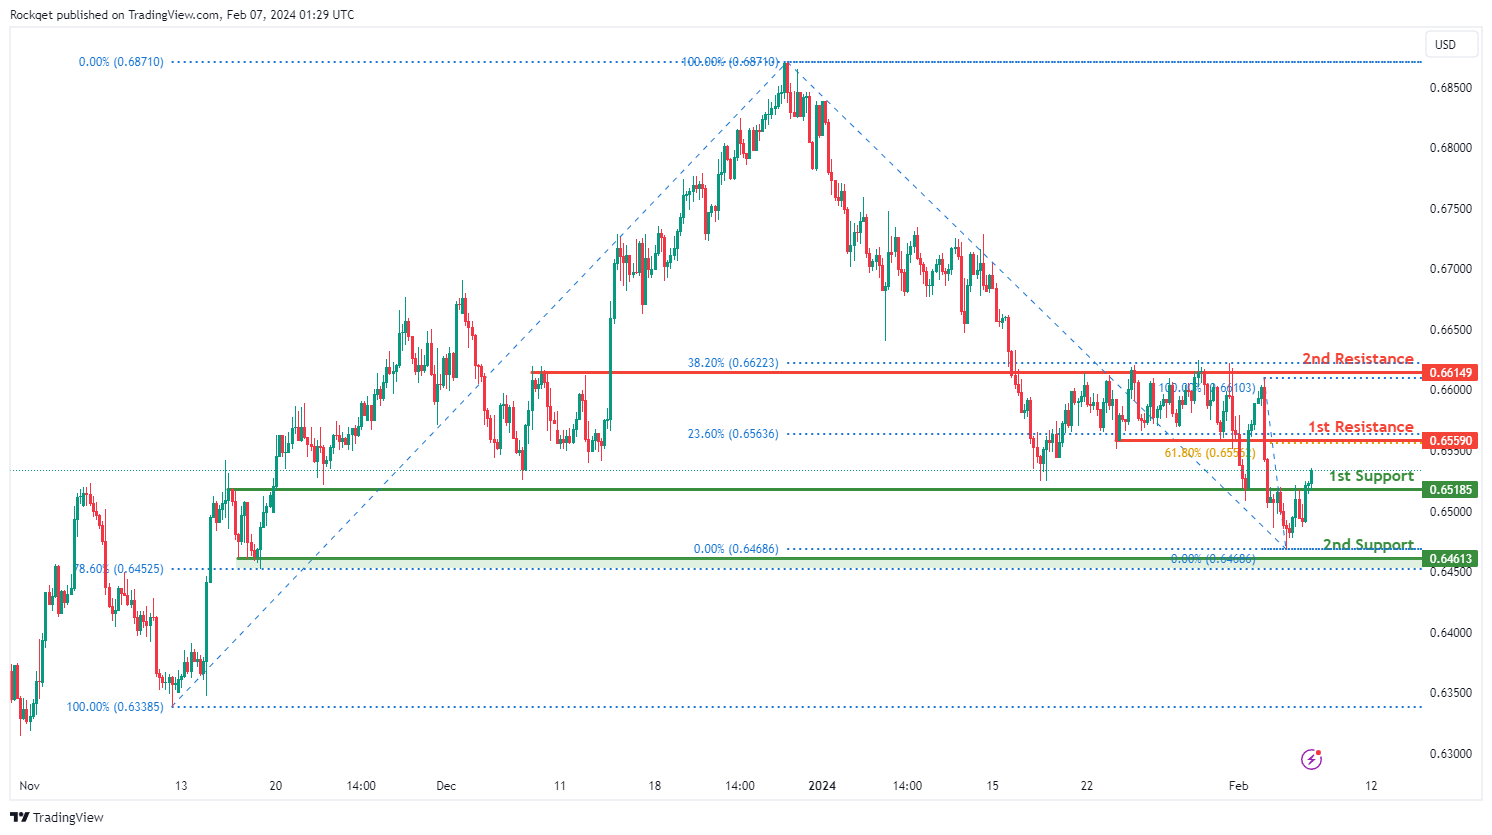
AUD/USD:
The AUD/USD chart currently exhibits an overall bullish momentum. In this context, there is a potential scenario for price to rise towards the 1st resistance.
The 1st resistance level at 0.6559 is identified as a pullback resistance that aligns with a confluence of Fibonacci levels i.e. the 23.60% and the 61.80% Retracement levels. Higher up, the 2nd resistance level at 0.6614 is also marked as a pullback resistance that aligns close to the 38.20% Fibonacci Retracement level, further highlighting its importance as a potential resistance point.
To the downside, the 1st support level at 0.6518 is identified as an overlap support. Further below, the 2nd support level at 0.6461 is noted as a pullback support that aligns close to the 78.60% Fibonacci Retracement level, further emphasizing its importance as a potential support zone.
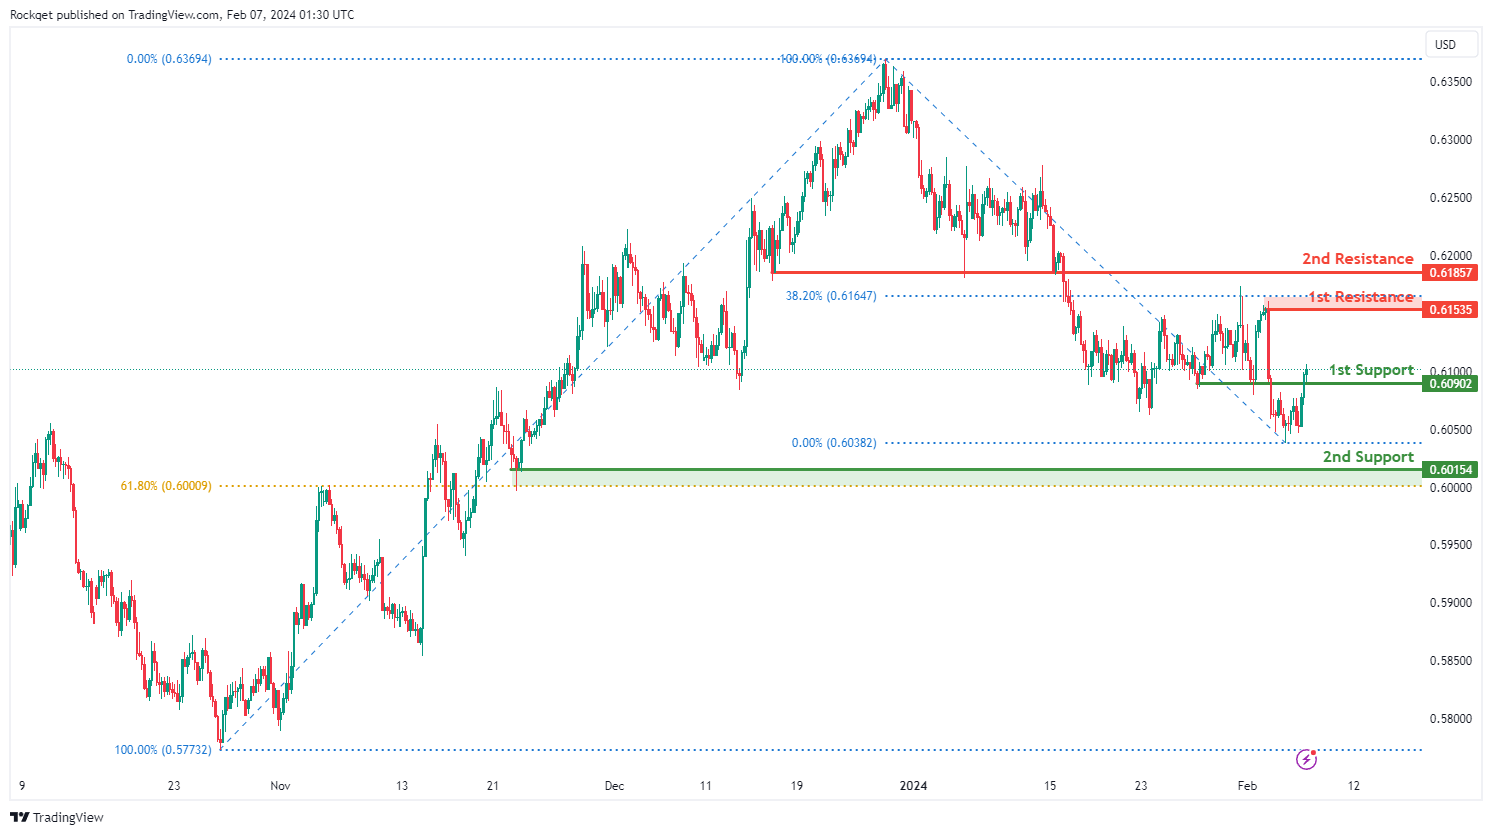
NZD/USD
The NZD/USD chart currently exhibits an overall bullish momentum. In this context, there is a potential scenario for price to rise towards the 1st resistance.
The 1st resistance level at 0.6153 is identified as a pullback resistance that aligns close to the 38.20% Fibonacci Retracement level. Higher up, the 2nd resistance level at 0.6185 is also marked as a pullback resistance, further highlighting its importance as a potential resistance point.
To the downside, the 1st support level at 0.6090 is identified as a pullback support. Further below, the 2nd support level at 0.6015 is also noted as a pullback support that aligns close to the 61.80% Fibonacci Retracement level, further emphasizing its importance as a potential support zone.
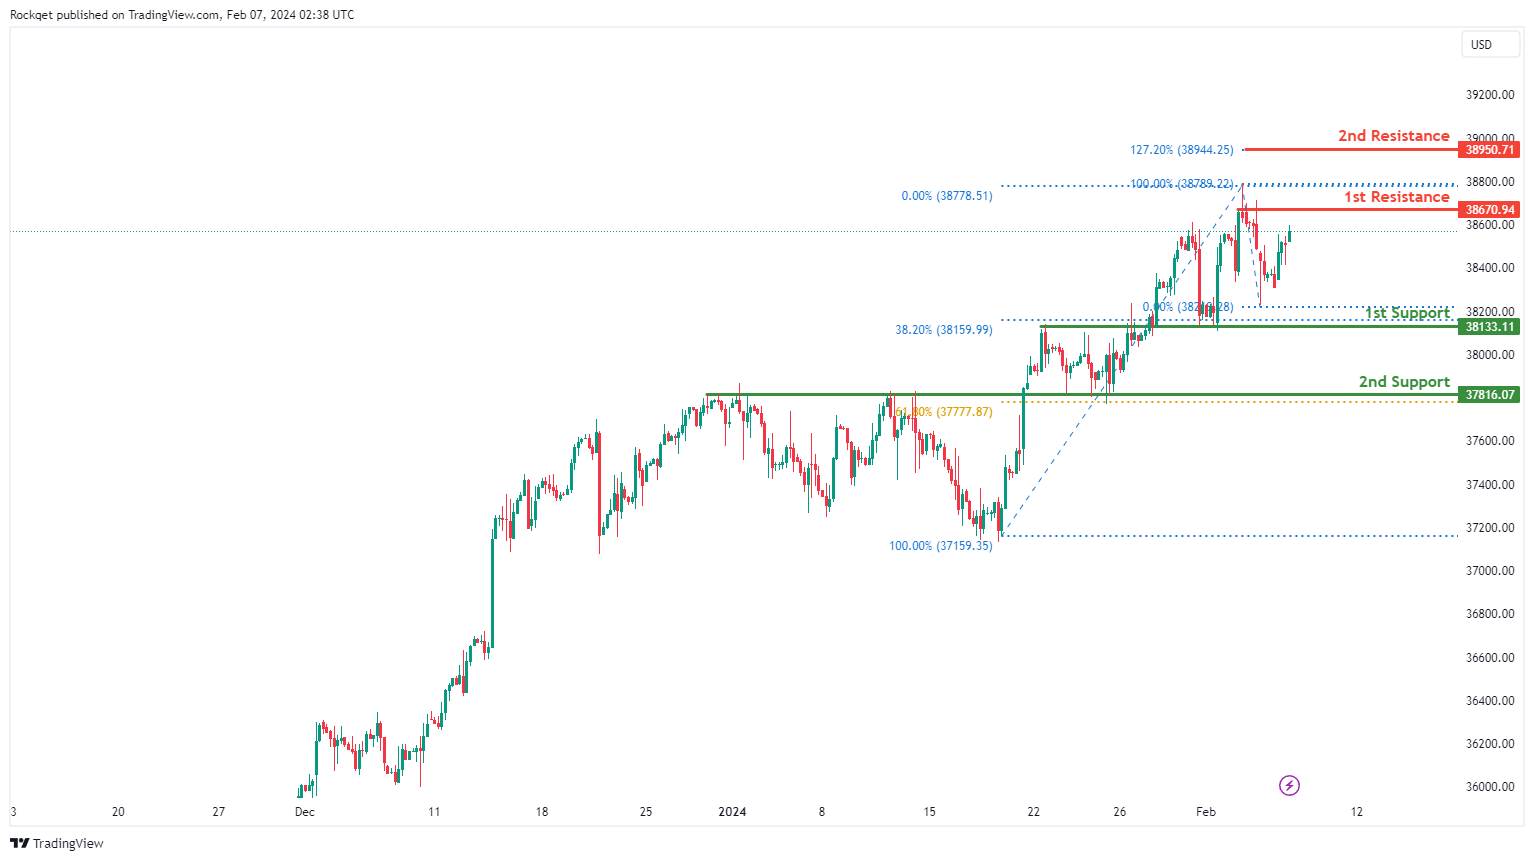
DJ30:
The DJ30 chart currently exhibits a bullish momentum, indicating a prevailing upward trend. There is a potential for a bullish continuation towards the 1st resistance level.
The 1st support at 38133.11 is deemed significant for several reasons. Firstly, it aligns with an overlap support and coincides with the 38.20% Fibonacci Retracement level, suggesting a historical area where buying interest has emerged.
Additionally, the 2nd support at 37816.07 is identified as an overlap support and aligns with the 61.80% Fibonacci Retracement, providing further reinforcement to this potential support zone.
On the resistance side, the 1st resistance at 38670.94 is highlighted as a level where selling pressure may emerge, representing a swing high resistance.
The 2nd resistance at 38950.71 is also recognized, coinciding with the 127.20% Fibonacci Extension.
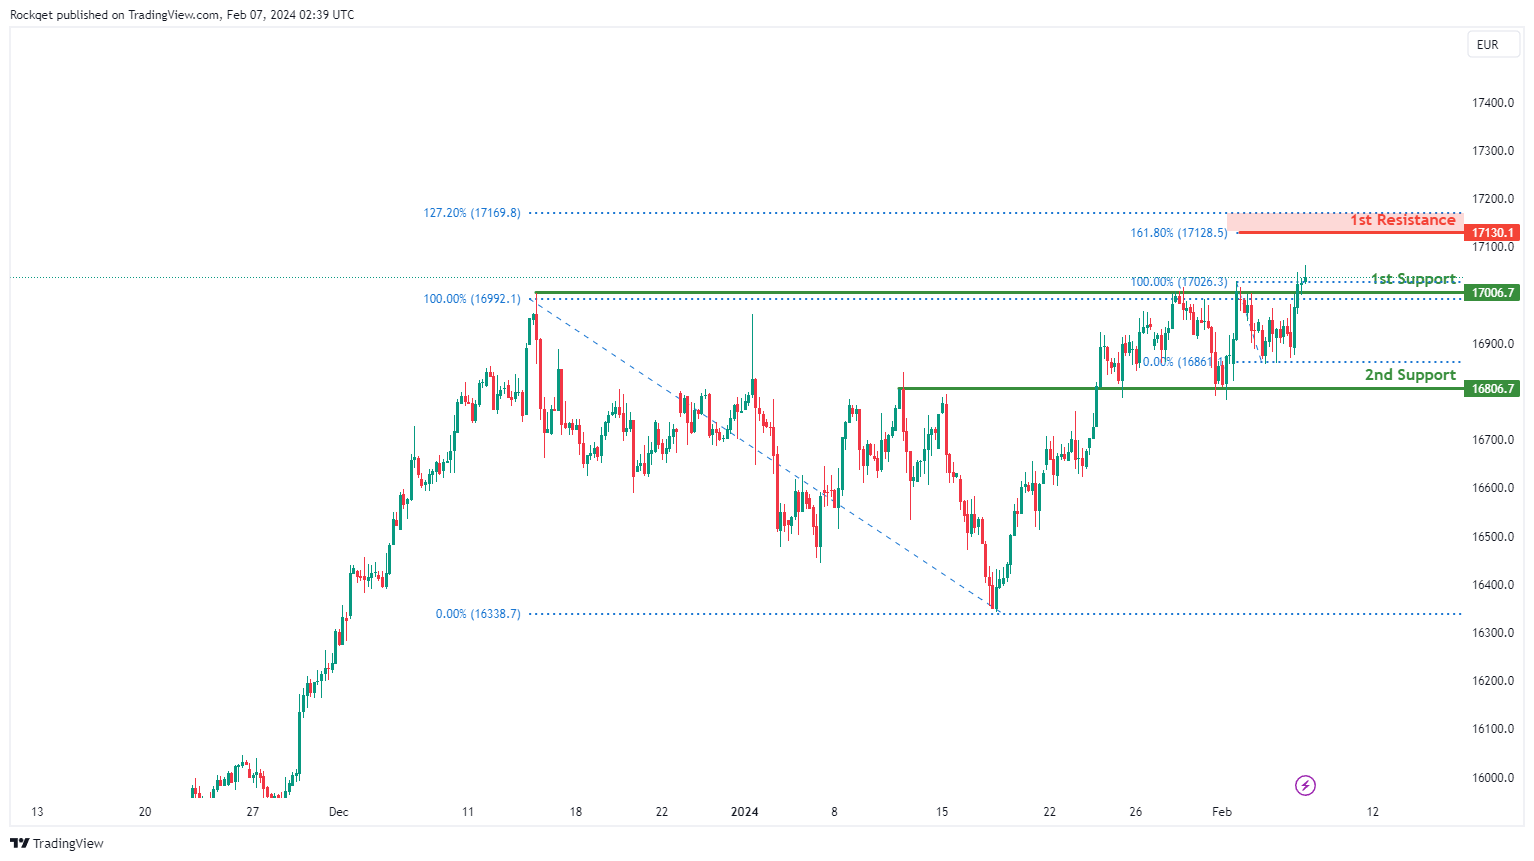
GER40:
The GER40 chart currently shows bullish momentum, indicating a prevailing upward trend. Several factors contribute to this bullish sentiment, supporting the potential for continued upward movement in the price.
The 1st support at 17006.7 is considered significant as it represents a pullback support level. Additionally, the 2nd support at 16806.7 is identified as an overlap support, further reinforcing its significance in potentially maintaining the bullish momentum.
On the resistance side, the 1st resistance at 17130.1 is highlighted, aligning with the 127.20% Fibonacci Extension and the 161.80% Fibonacci Extension. These levels suggest potential barriers to the bullish momentum, where selling pressure may emerge.
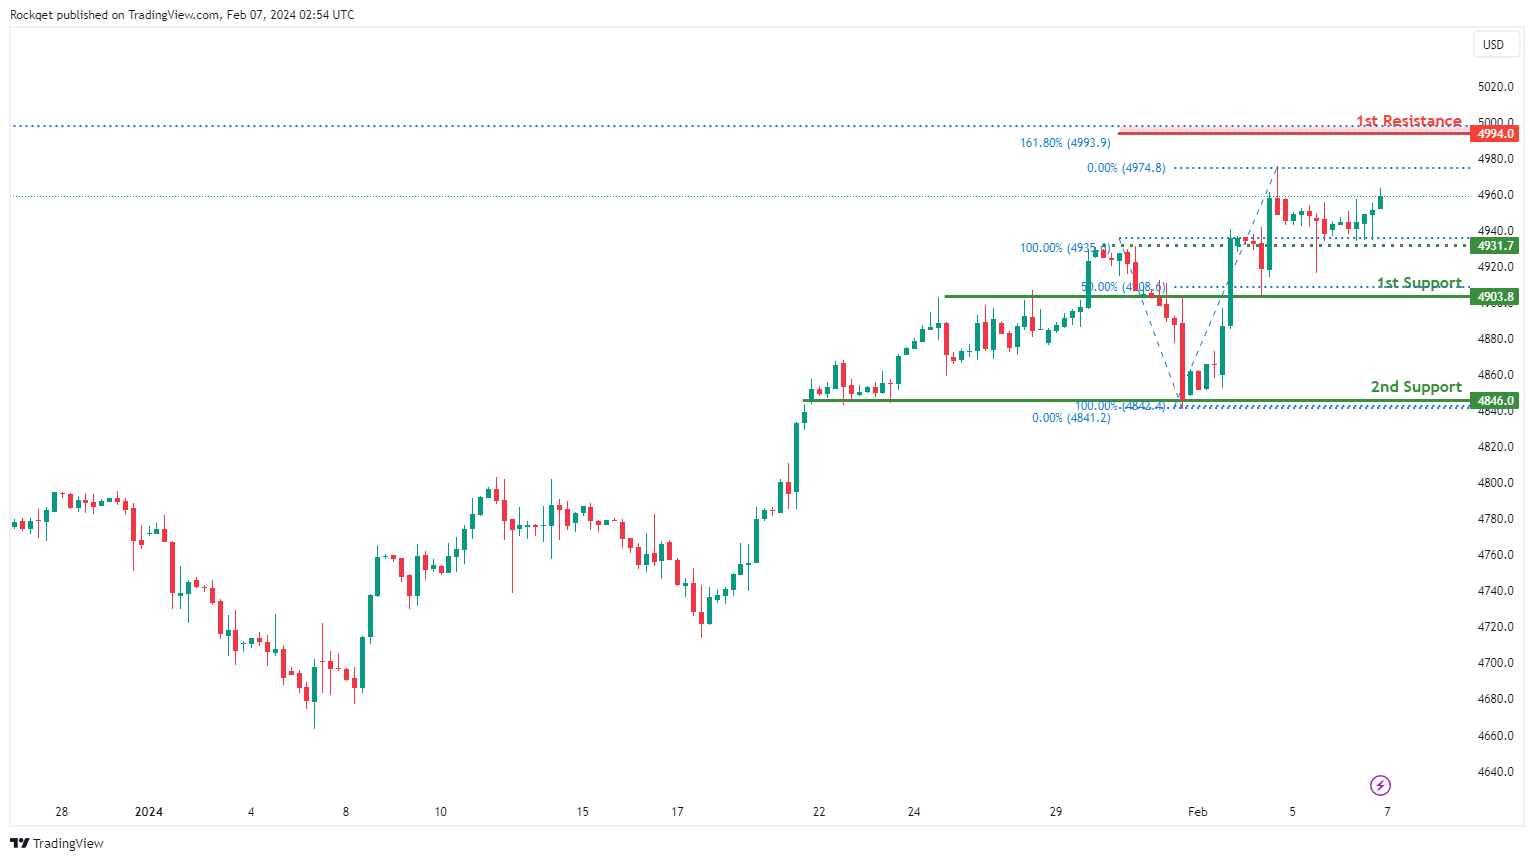
US500:
The US500 chart currently exhibits a bullish overall momentum, indicating a prevailing upward trend. Several factors contribute to this bullish sentiment, supporting the potential for continued upward movement in the price.
The 1st support at 4903.8 is considered significant as it aligns with an overlap support and the 50% Fibonacci Retracement level. This convergence suggests a historical level where buying interest has previously emerged, adding strength to the support zone.
Additionally, the 2nd support at 4846.0 is identified as another overlap support, further reinforcing the potential support level.
An intermediate support level at 4931.7 is also recognized, aligning with an overlap support. This level provides additional reinforcement to the potential support zone.
On the resistance side, the 1st resistance at 4994.0 is highlighted, coinciding with the 161.80% Fibonacci Extension. This level suggests a potential barrier to the bullish momentum, where selling pressure may emerge.
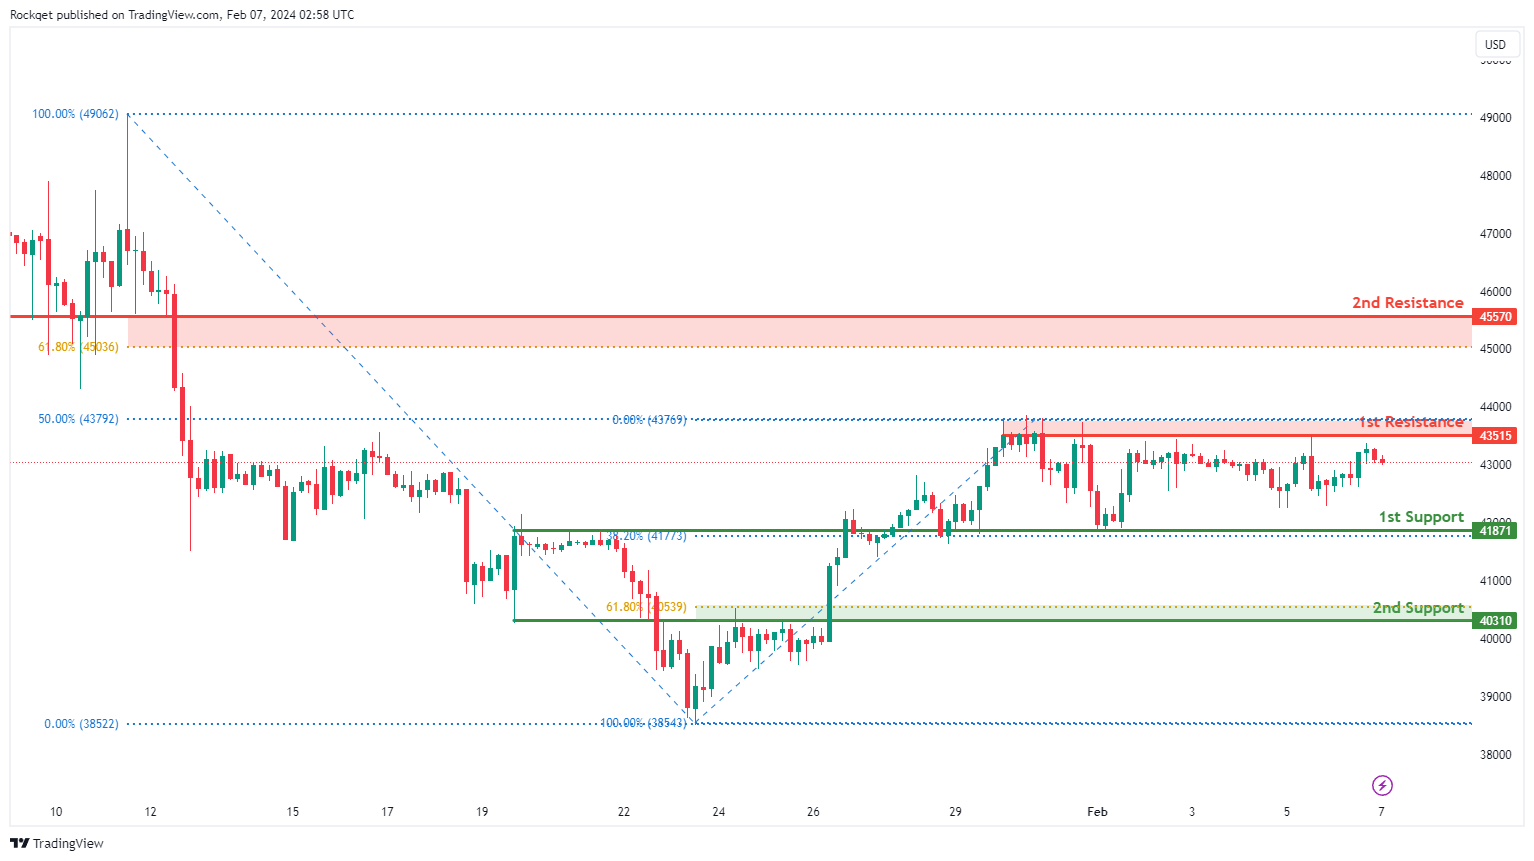
BTC/USD:
The BTC/USD chart currently indicates a neutral overall momentum, suggesting a lack of clear trend direction. This neutral sentiment implies that the price may fluctuate within a certain range without a strong bias towards either bullish or bearish movement.
The 1st support level at 41871 is identified as significant due to its alignment with an overlap support and the 38.20% Fibonacci Retracement level. This convergence suggests a historical level where buying interest has emerged, potentially providing a strong foundation for the price.
Additionally, the 2nd support at 40310 is recognized as another overlap support, further reinforcing the potential support zone.
On the resistance side, the 1st resistance level at 43515 is highlighted, coinciding with a pullback resistance and the 50% Fibonacci Retracement level. This suggests a level where selling pressure may emerge, potentially limiting further upward movement in the price.
Furthermore, the 2nd resistance at 45570 is identified as an overlap resistance and aligns with the 61.80% Fibonacci Retracement level, adding further significance to this resistance level.
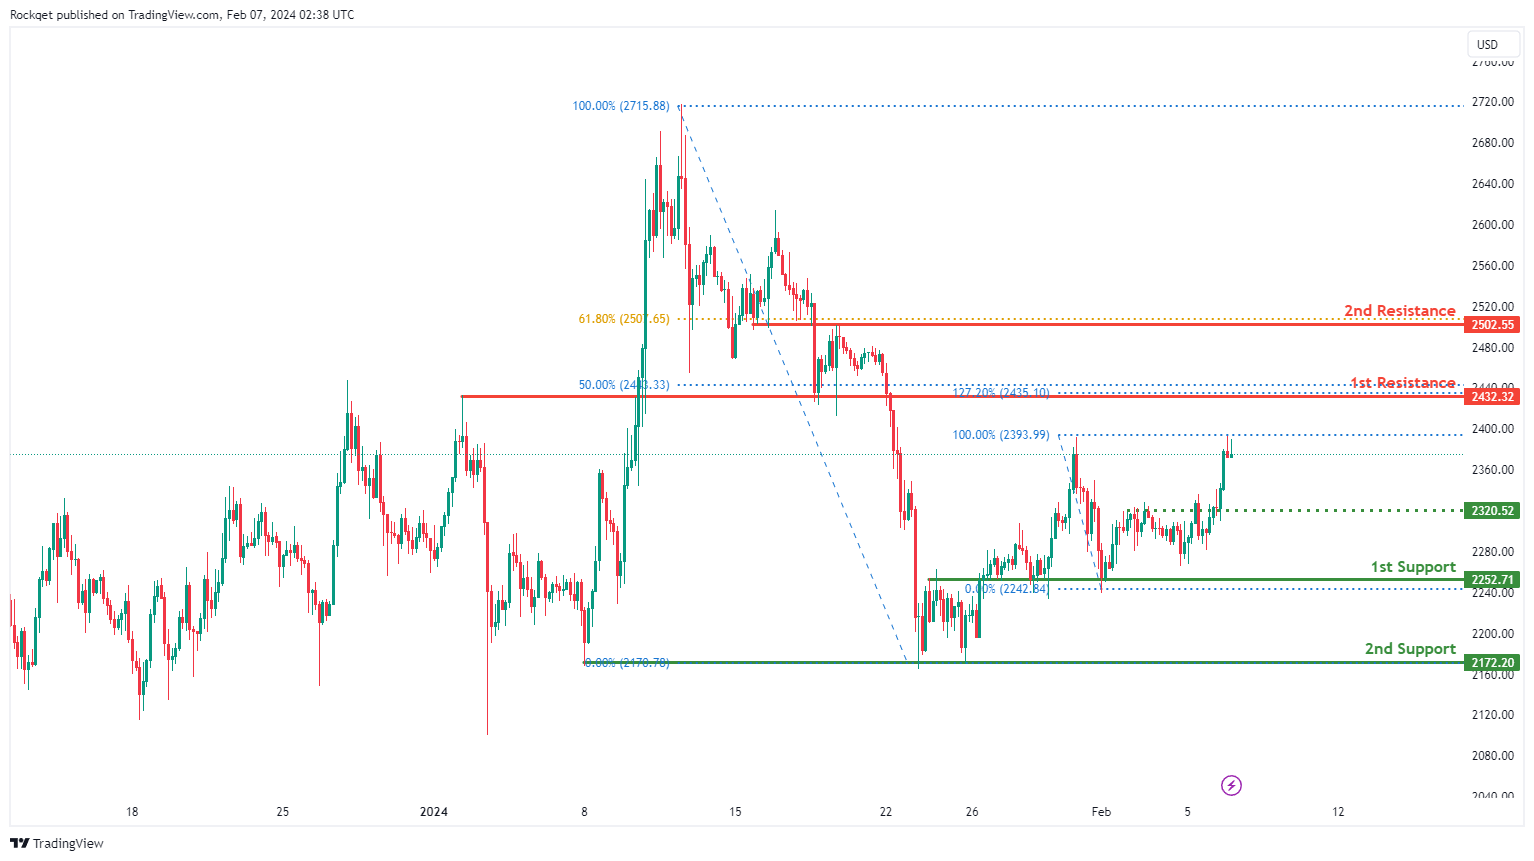
ETH/USD:
The ETH/USD chart currently demonstrates a bullish overall momentum, indicating a prevailing upward trend. This suggests that buyers have been dominating the market sentiment, potentially leading to further upward movement in the price.
The 1st support level at 2252.71 is considered significant as it aligns with an overlap support, indicating a historical level where buying interest has emerged.
Additionally, the 2nd support at 2172.20 is identified as a pullback support, further reinforcing the potential support zone.
On the resistance side, the 1st resistance level at 2432.32 is highlighted. This level coincides with an overlap resistance, the 50% Fibonacci Retracement, and the 127.20% Fibonacci Extension, suggesting a potential barrier to the bullish momentum.
Furthermore, the 2nd resistance at 2502.55 is identified as an overlap resistance and aligns with the 61.80% Fibonacci Retracement, adding further significance to this resistance level. An intermediate support level at 2320.52 is also recognized, aligning with an overlap support.
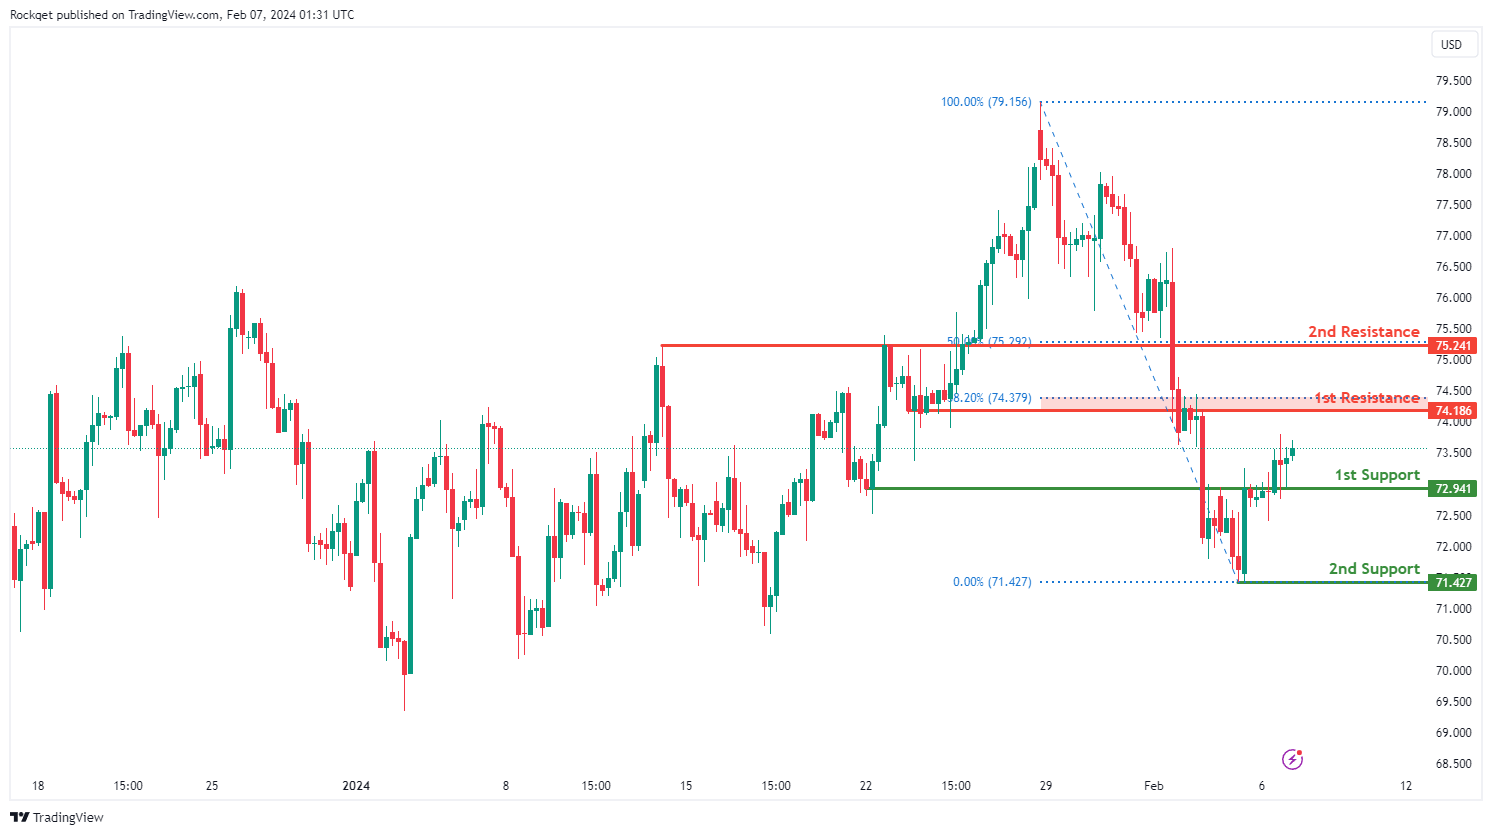
WTI/USD:
The WTI (West Texas Intermediate) chart currently exhibits an overall bullish momentum. In this context, there is a potential scenario for price to rise towards the 1st resistance.
The 1st resistance level at 74.18 is identified as an overlap resistance that aligns close to the 38.20% Fibonacci Retracement level. Higher up, the 2nd resistance level at 75.24 is marked as a pullback resistance that aligns with the 50.00% Fibonacci Retracement level, further highlighting its importance as a potential resistance zone.
To the downside, the 1st support level at 72.94 is identified as an overlap support. Further below, the 2nd support level at 71.42 is identified as a pullback support, reinforcing its significance as a key support level.
XAU/USD (GOLD):
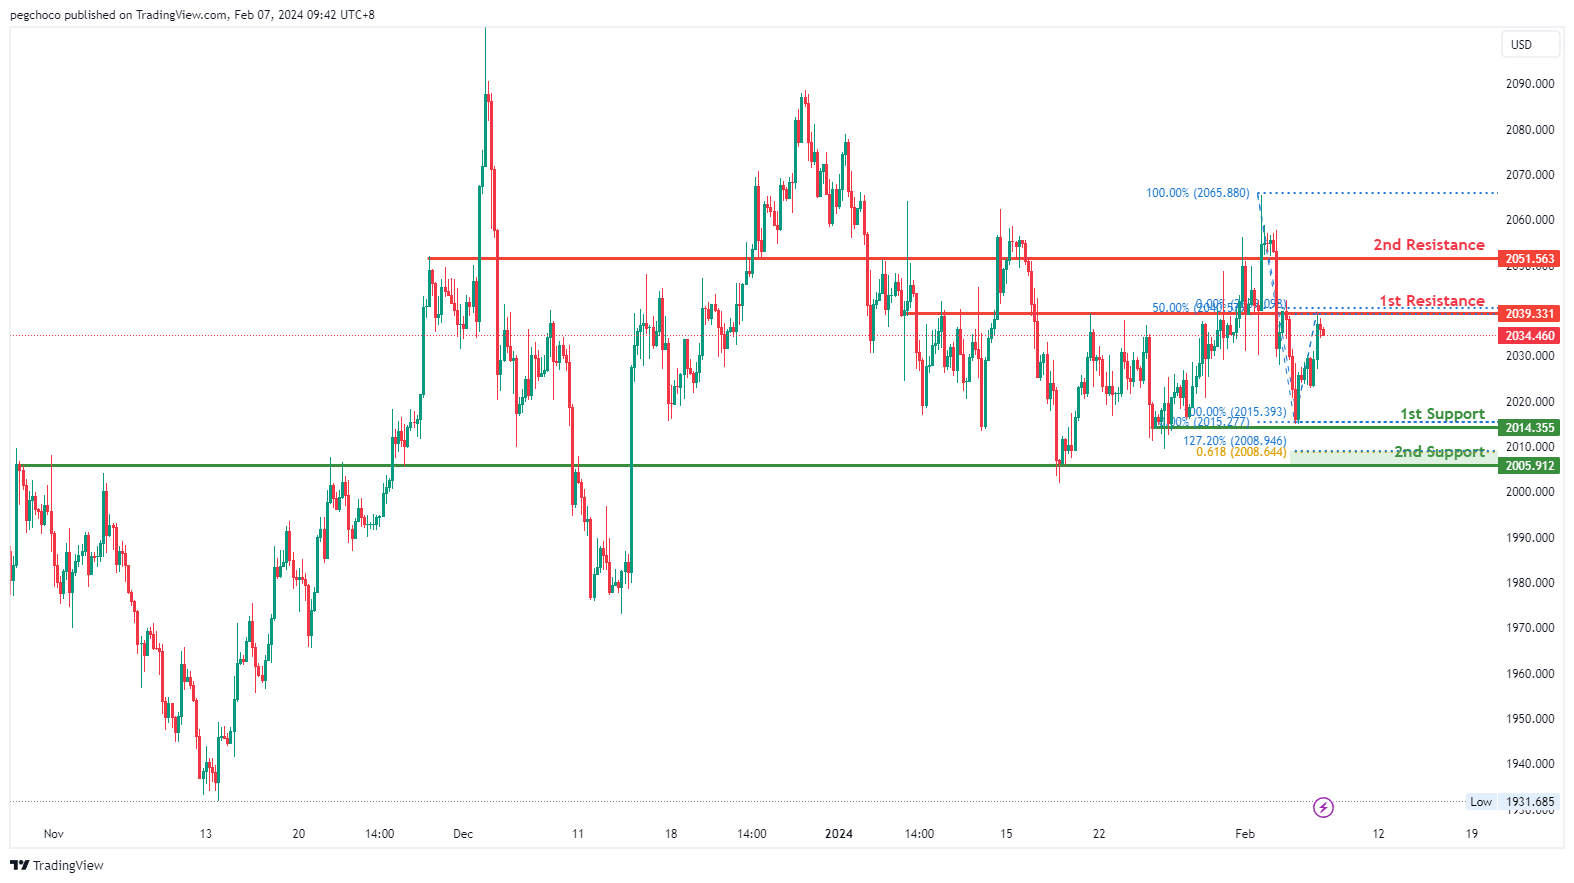
The XAUUSD chart currently shows a bearish overall momentum, suggesting a downward trend. There’s a potential for a bearish reaction off the 1st resistance level, followed by a drop towards the 1st support level.
The 1st support at 2014.35 is recognized as a multi-swing low support, indicating its historical significance as a strong support level.
Additionally, the 2nd support level at 2005.91 is characterized as an overlap support, coinciding with the 61.80% Fibonacci Retracement and 127.20% Fibonacci Extension, indicating Fibonacci confluence and further strengthening its importance as a support zone.
On the resistance side, the 1st resistance level at 2039.33 is identified as an overlap resistance, with the presence of the 50% Fibonacci Retracement, marking its historical significance as a potential resistance point.
Furthermore, the 2nd resistance at 2051.56 is considered a pullback resistance, suggesting its potential role in hindering further upward movement.


