
The Australian Dollar (AUD) is gaining strength against the US Dollar (USD), pushing AUDUSD higher after recently hitting its lowest level since April 2020. However, traders should be cautious, as key support sits at 0.6087, while resistance is near 0.6330. The US Dollar has weakened for three straight days, partly due to uncertainty around new tariffs proposed by President Trump. Meanwhile, Australia’s inflation data suggests the Reserve Bank of Australia (RBA) may cut interest rates soon, which could limit further AUD gains. Looking ahead, traders will watch economic data from both Australia and China to determine the Aussie’s next move.
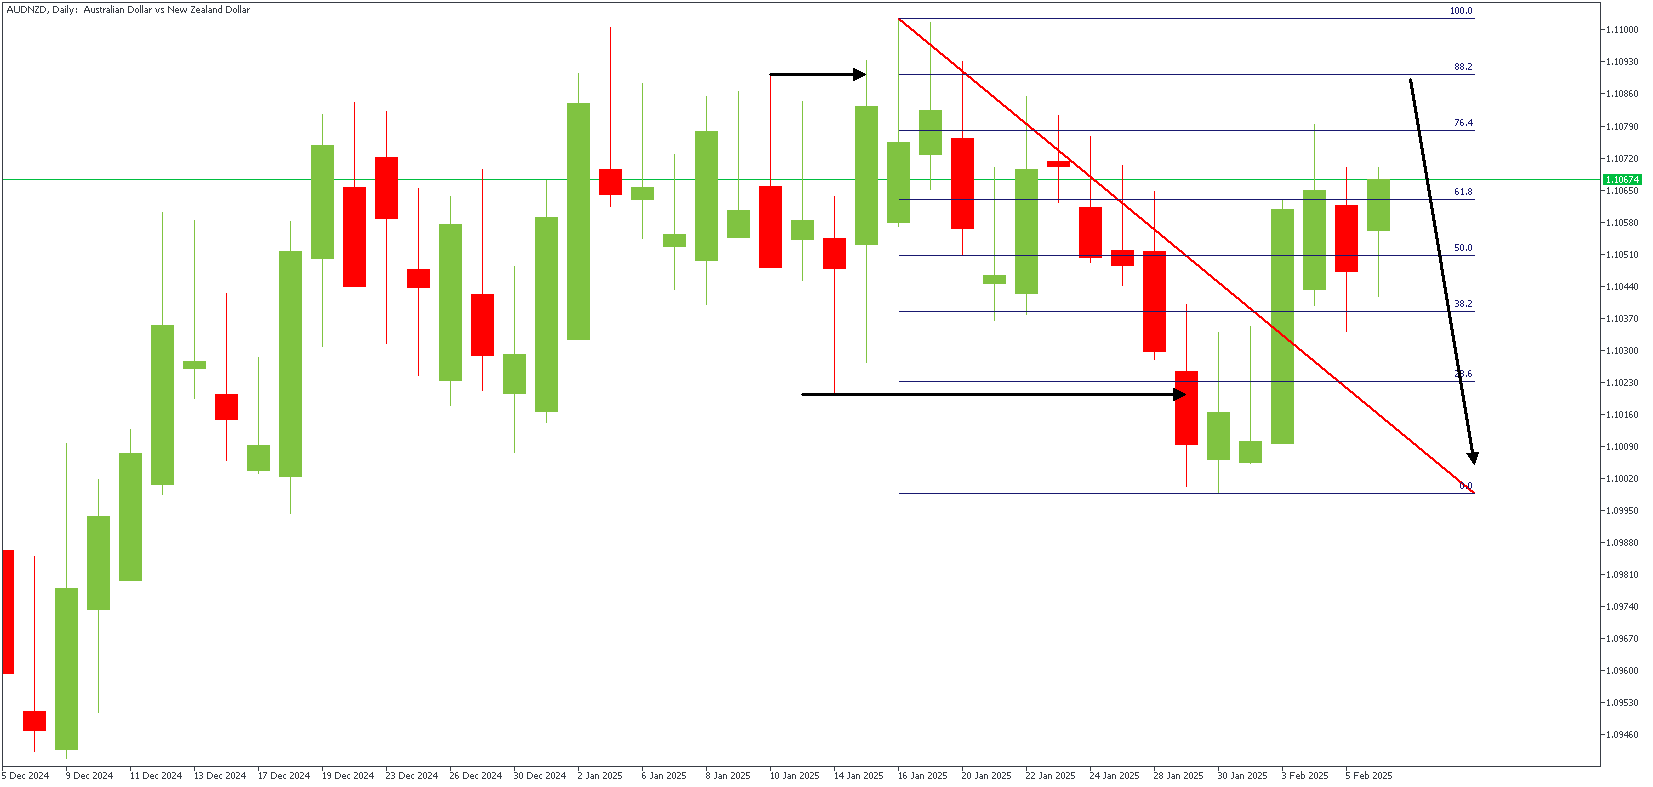
AUDNZD – D1 Timeframe
Following the sweep above the previous high on the Daily timeframe chart of AUDNZD, we saw the price dip lower to break the previous low, resulting in an SBR pattern. The ongoing bullish retracement is approaching 76% of the Fibonacci retracement tool in preparation for bearish momentum.
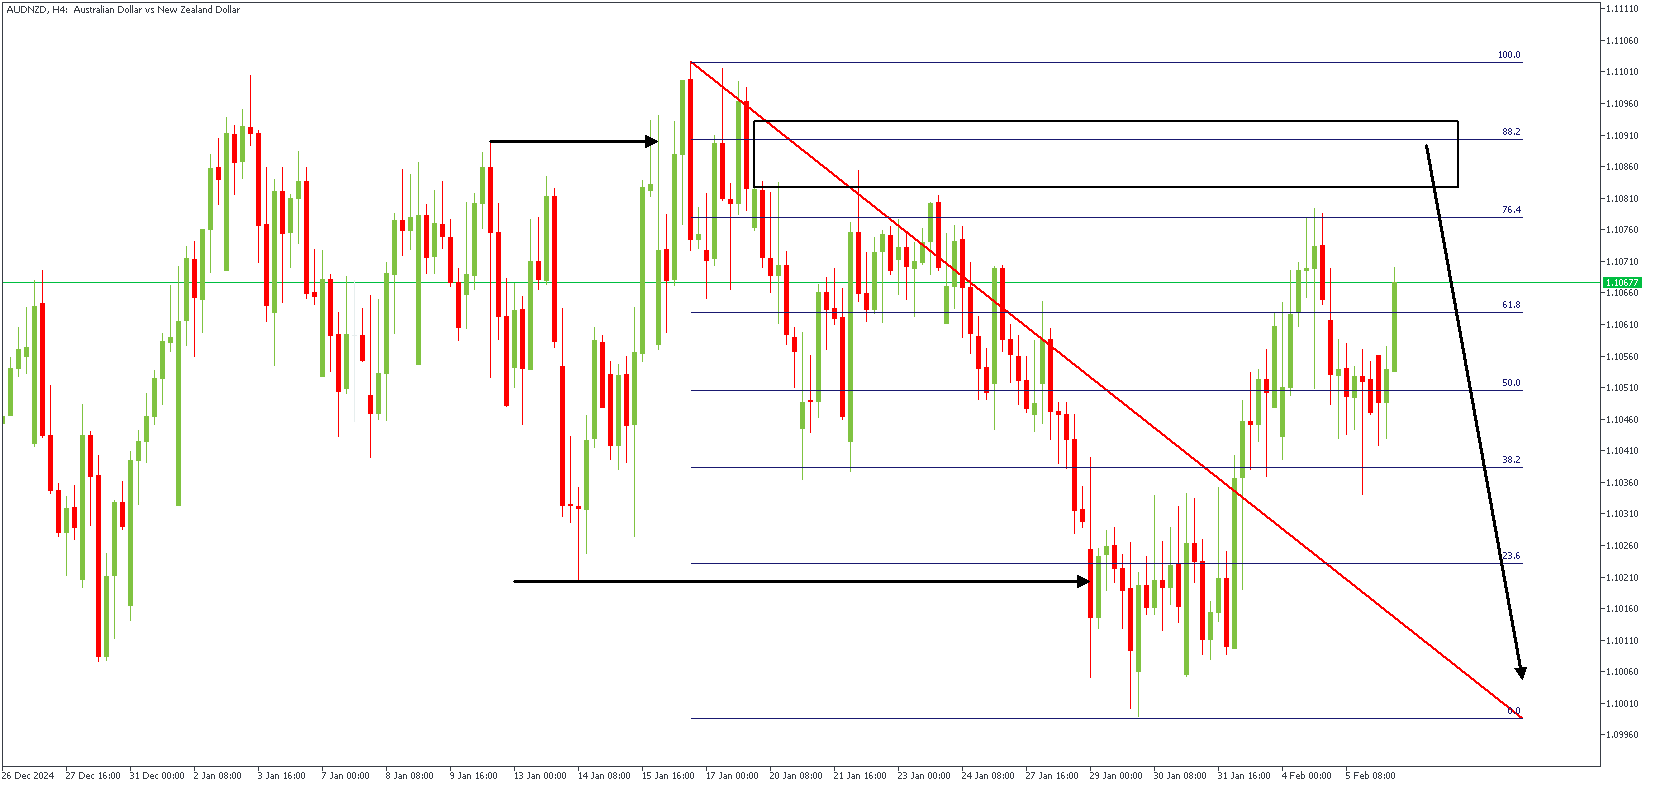
AUDNZD – H4 Timeframe
On the 4-hour timeframe chart of AUDNZD, we see the drop-base-drop supply zone near the tip of the SBR pattern overlapping the 88% Fibonacci retracement level, with an area of liquidity sitting nearby. The expectation from all these confluences is a bearish outcome.
Analyst’s Expectations:
- Direction: Bearish
- Target: 1.10154
- Invalidation: 1.11046


