
Key Highlights
- WTI Crude Oil prices started a major decline from the $78.50 zone.
- It traded below a key bullish trend line with support at $71.50 on the 4-hour chart.
- Gold prices are facing hurdles near the $3,400 resistance.
- EUR/USD regained traction and managed to clear the 1.1550 resistance zone.
WTI Crude Oil Price Technical Analysis
WTI Crude Oil price failed to continue higher above $78.50 against the US Dollar. There was a strong bearish reaction below the $75.00 and $72.00 levels.
Looking at the 4-hour chart of XTI/USD, the price settled below the $70.00 level and the 100 simple moving average (red, 4-hour). It also traded below a key bullish trend line with support at $71.50.
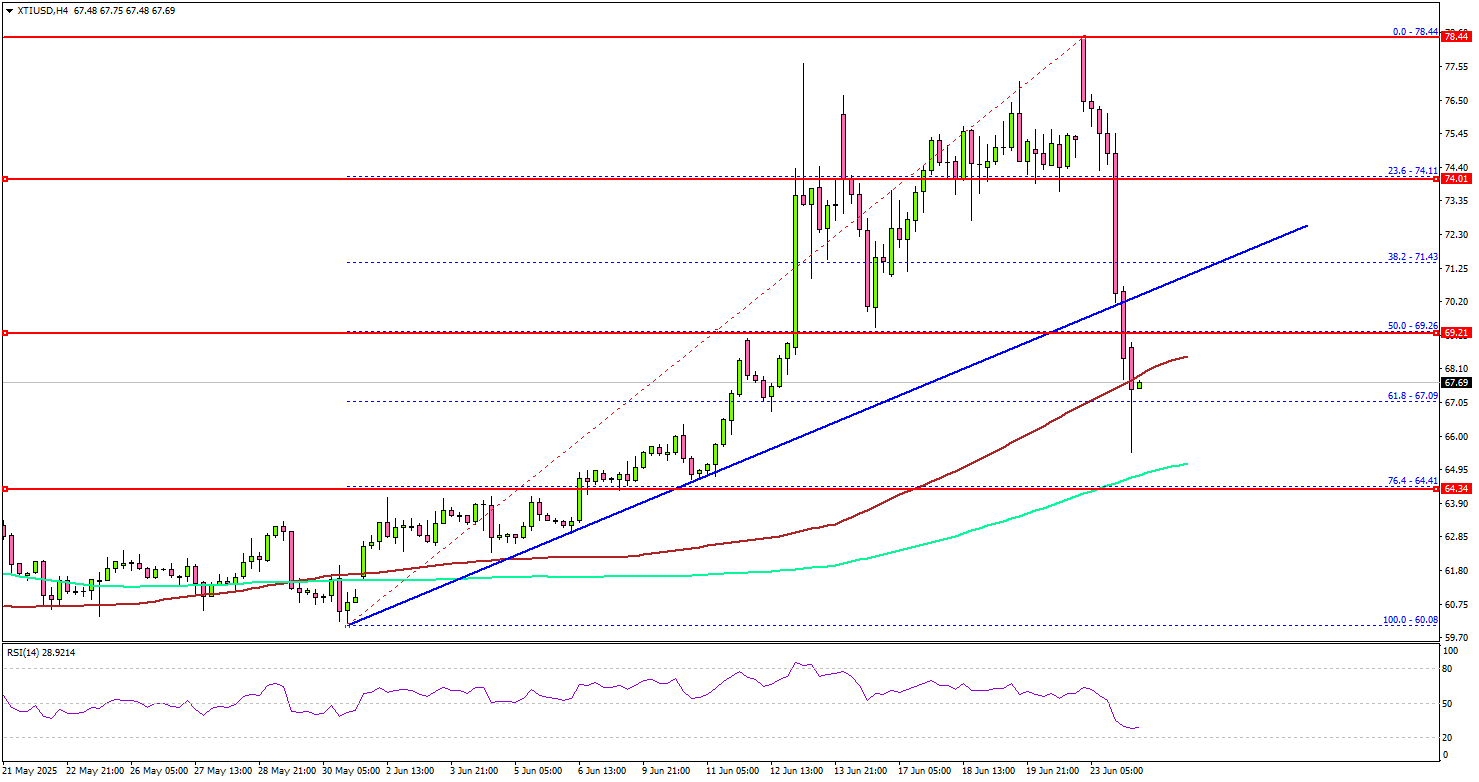
Finally, the price spiked toward the $66.000 level and traded close to the 200 simple moving average (green, 4-hour). On the downside, the first major support sits near the $66.50 zone. The next support could be $65.50.
A daily close below $65.50 could open the doors for a larger decline. The next major support is $64.40. Any more losses might send oil prices toward $60.00 in the coming days.
On the upside, immediate resistance is near the $68.50 level. The first key resistance sits near the $70.00 level. The main hurdle is now near the $72.00 zone, above which the price may perhaps accelerate higher. In the stated case, it could even visit the $75.00 resistance. Any more gains might call for a test of the $78.00 resistance zone in the near term.
Looking at Gold, the bears are active below the $3,400 level, and they might aim for a drop toward the $3,300 level.
Economic Releases to Watch Today
- Fed’s Chair Powell testifies.
- BoE’s Breeden speech.
- Fed’s Williams speech.


