
- The technical picture has turned “decidedly optimistic” as EUR/USD has reclaimed its 50, 100, and 200-day Moving Averages (MAs).
- Momentum oscillators on the H4 chart, with RSI at 70.5, suggest the move is overextended.
- Bulls must secure an hourly close above the 1.1800 psychological level to maintain control.
- If the pair fails at 1.1800 and slips below the intraday pivot at 1.1780, it could lead to a correction toward the 1.1750 zone.
EUR/USD finds itself at another crossroad after recent developments have seen the pair test a multi year pivot level of 1.1450. Since then EUR/USD has attempted to grind its way higher but further upside is facing a few hurdles.
Daily Chart: Structural Shift Underway
Looking at the daily timeframe, the technical picture has shifted from cautiously bearish to decidedly optimistic. After finding significant demand at the Multi-Year Pivot near 1.1450, the pair has embarked on a sustained rally.
The most significant development on the daily chart is the price action surrounding the MA cluster. EUR/USD has managed to reclaim the 50, 100, and 200-day Moving Averages (MAs), which are currently converging around the 1.1670 – 1.1690 zone (highlighted by the red box). This area now shifts from a major resistance ceiling to a foundational support floor.
With the RSI currently at 64.4, there is still space before reaching extreme overbought conditions, suggesting that the path of least resistance remains to the upside toward the 1.1867 resistance level.
EUR/USD Daily Chart, April 15, 2026
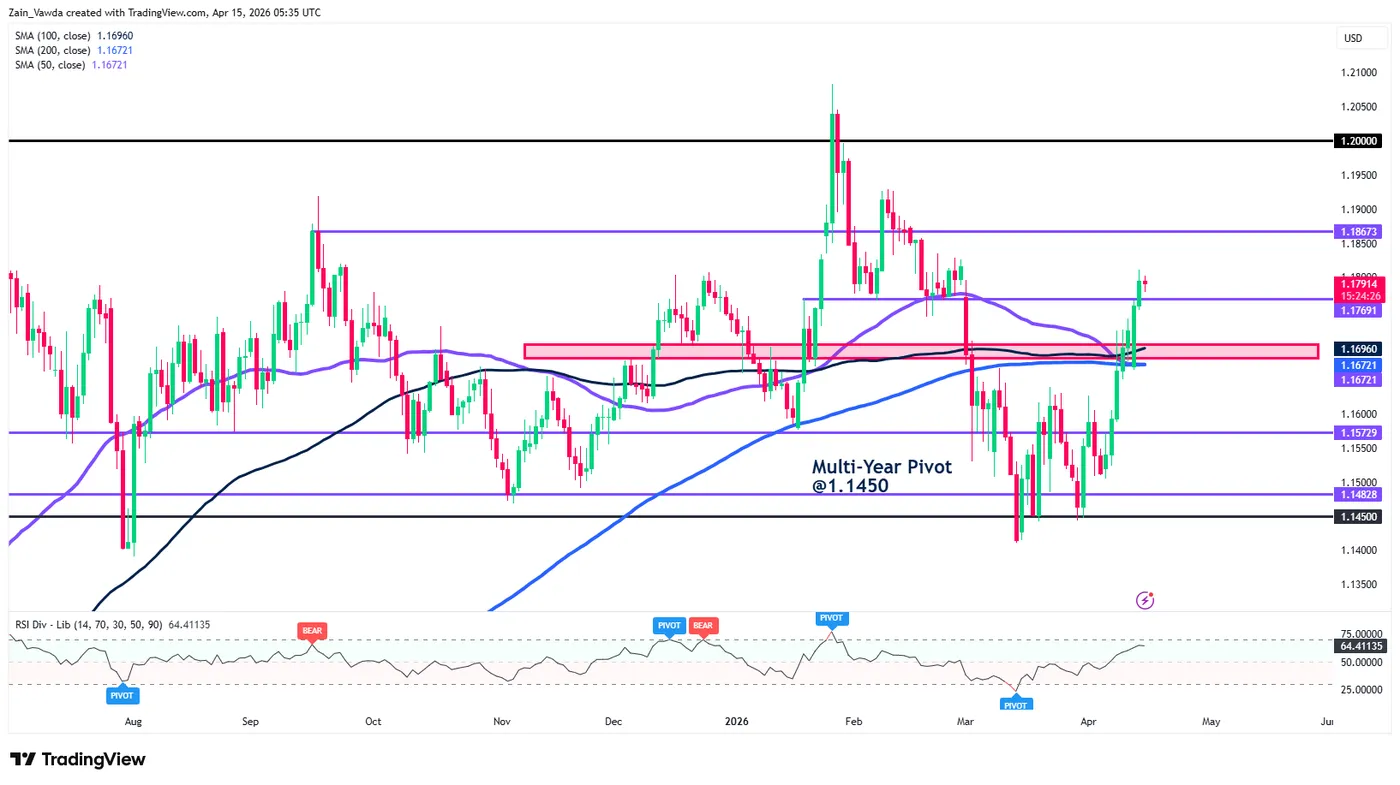
Source:TradingView.com
H4 Chart: Momentum Oscillators Hint at Exhaustion
On the H4 timeframe, the “Golden Cross” and the steep ascending slope of the 50 MA (purple line) underscore the strength of the recent move. The pair recently sliced through the 1.1721 and 1.1769 horizontal hurdles with relative ease.
However, a note of caution is warranted. The RSI on the H4 is currently printing at 70.5, having recently flagged several “BEAR” pivot warnings. This indicates that while the trend is bullish, the move is becoming overextended in the short term.
We often see a period of consolidation or a “retest” of previous breakout levels when the H4 RSI hits these extremes, which could see the pair gravitate back toward 1.1769 before the next leg higher.
EUR/USD Four-Hour Chart, April 15, 2026
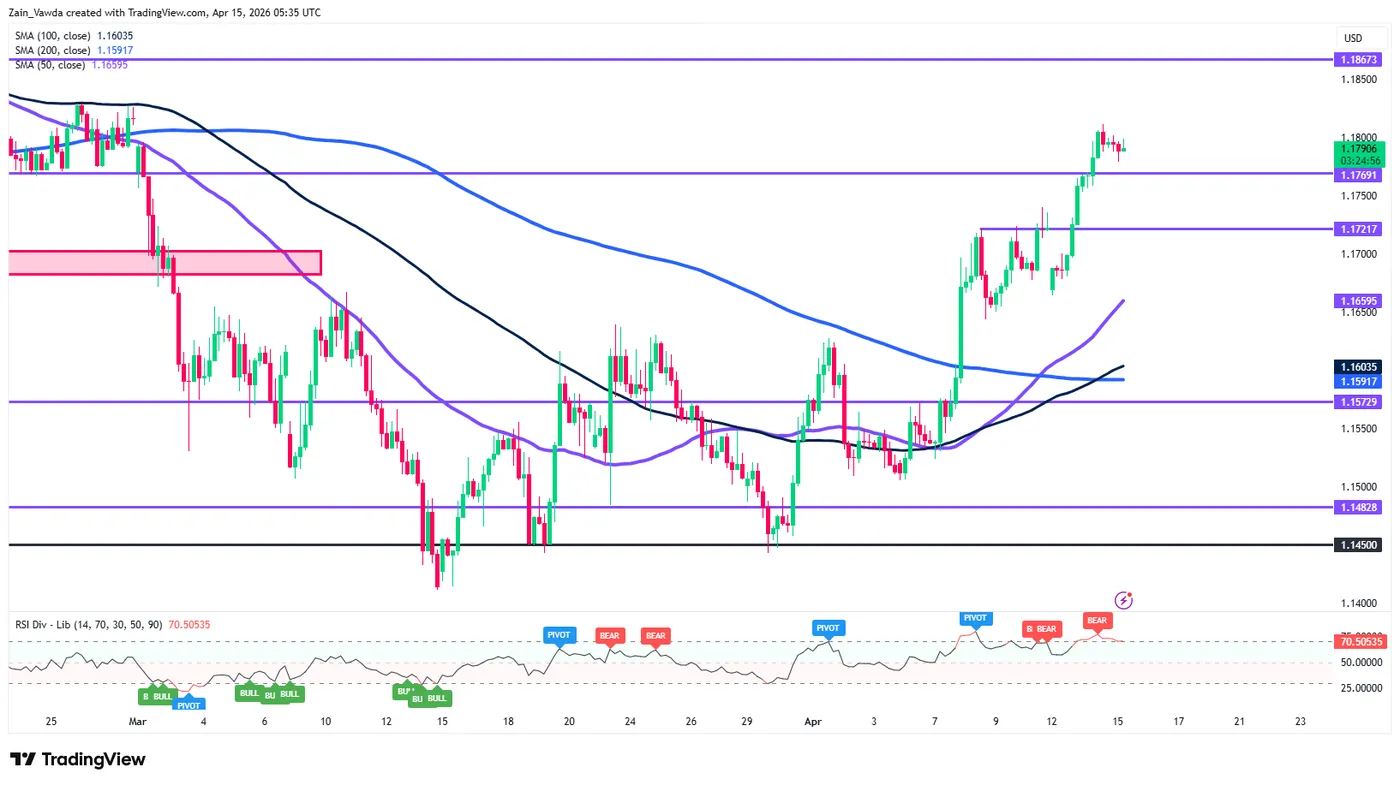
Source:TradingView.com
H1 Chart: European Session Scenarios
The hourly chart provides a clear roadmap for the day ahead. Price action is currently consolidating just below the 1.1800 handle, which will be the primary battleground for the European session.
The Bullish Scenario
For the bulls to maintain control, we need to see a clean hourly close above the 1.1800 psychological level. If buying pressure persists, the next logical target is the 1.1867 area. Traders should watch for a “bull flag” formation on the H1; as long as the pair holds above the 1.1769 support, the intraday bias remains firmly long.
The Bearish Scenario
The bearish case relies on the RSI divergence and the “BEAR” labels currently populating the H1 peaks. If EUR/USD fails to clear 1.1800 and slips below the intraday pivot at 1.1780, we could see a move toward the 1.1750 zone, where the 50 MA (H1) is currently rising to meet price.
A deeper correction toward the 1.1726 level cannot be ruled out if the US Dollar finds a haven bid during the session.
Key Levels to Watch:
- Resistance: 1.1800, 1.1867, 1.2000
- Support: 1.1769, 1.1726, 1.1696 (Major)
EUR/USD One-Hour Chart, April 15, 2026
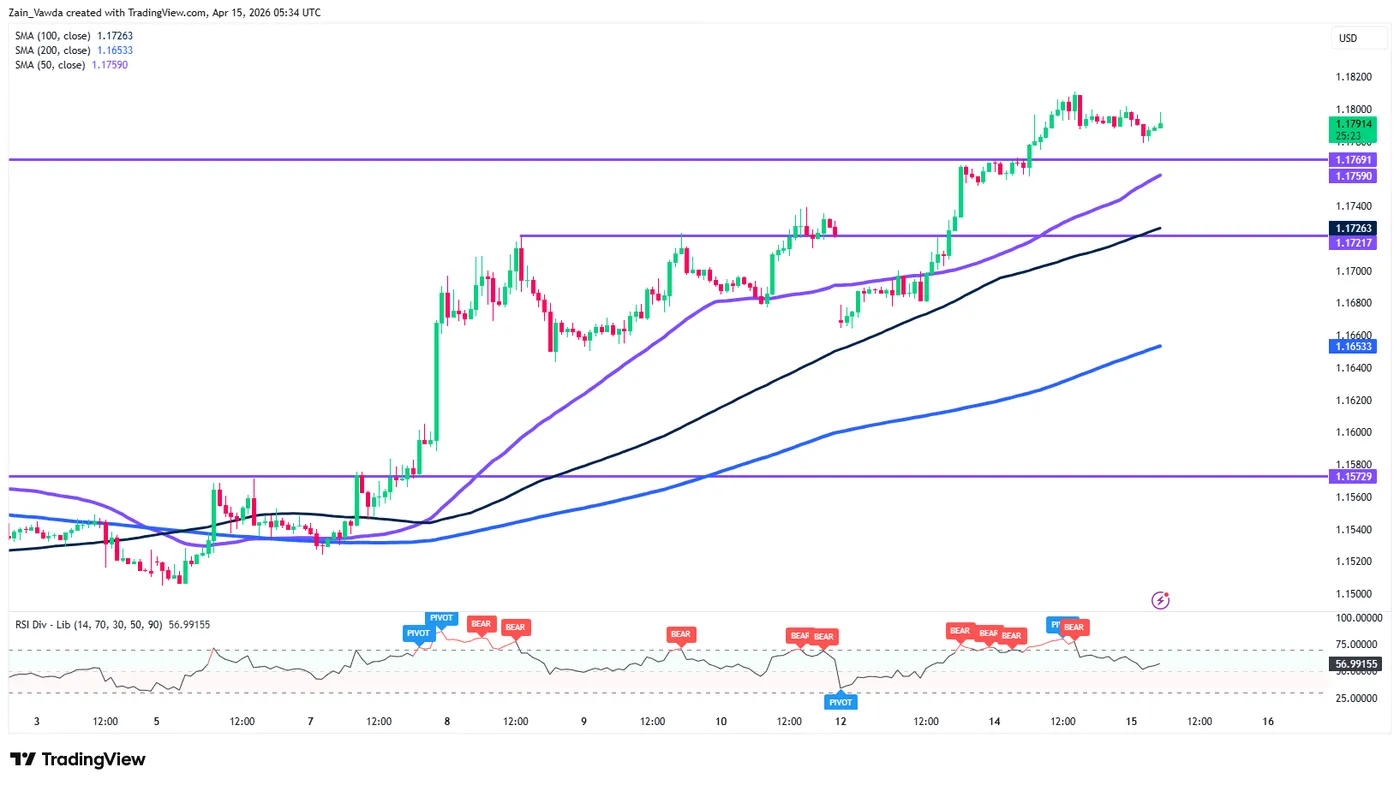
Source:TradingView.com
EUR/USD is enjoying a “bullish honeymoon” after reclaiming its major daily moving averages. While the H4 and H1 oscillators suggest a temporary breather might be healthy, the structural breakout suggests that dips are likely to be bought.


