
- WTI oil corrected strongly yesterday on Trump’s announcement that a deal is close, but the reality could be less optimistic.
- Traders are preparing for a rocky path to peace, as oil rallies back above $100 with the situation still uncertain.
- Exploring an in-depth technical analysis of crude oil.
WTI crude oil corrected strongly yesterday following President Trump’s optimistic announcement that a diplomatic deal was in its final stages, but the geopolitical reality is proving to be much less straightforward.
As the market quickly learned this morning, sometimes headlines are not enough, especially when Trump is posting a dozen each day.
Ayatollah Mojtaba Khamenei has reportedly announced that the nation insists on keeping its near-weapons-grade enriched uranium stockpile within its borders.
This condition remains an absolute dealbreaker for the United States, so this could prove to be another barrier to a longer-run deal.
Despite yesterday’s massive wave of diplomatic enthusiasm, it is now clear that the proposed agreement still harbors severe, contentious roadblocks that must be navigated before any true resolution is reached.
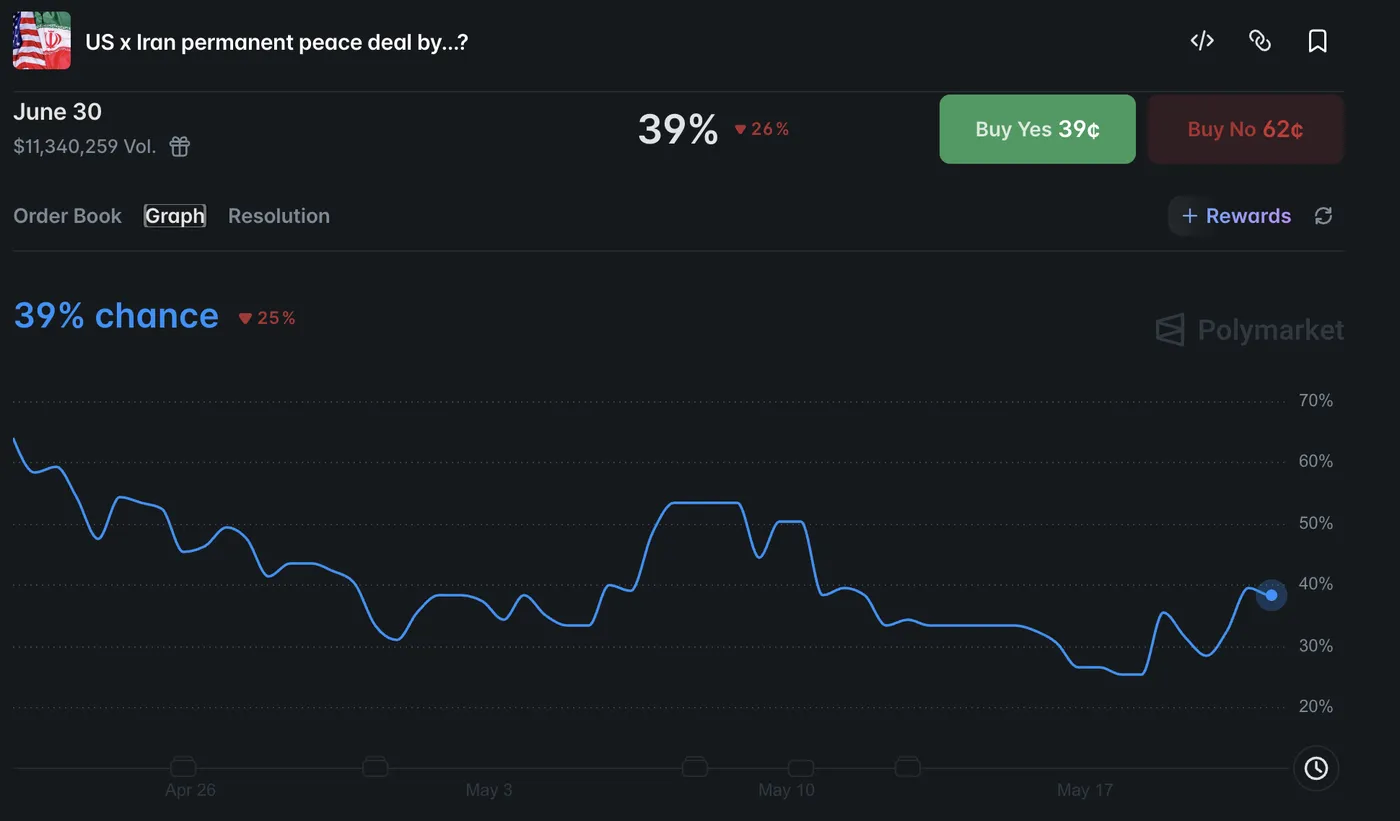
Peace deal odds for June 30. Source: Polymarket, May 21, 2026.
Consequently, traders are actively preparing for a highly rocky and volatile path to peace.
With the immediate diplomatic situation once again steeped in heavy uncertainty, the geopolitical risk premium is aggressively flooding right back into energy markets, sending WTI violently rallying back above the $100 psychological handle today.
Now, let’s take a closer look at the technical analysis for WTI crude to see if prices can remain above $100 for long.
US Oil Intraday Timeframe Analysis
WTI 4H Chart and Technical Levels
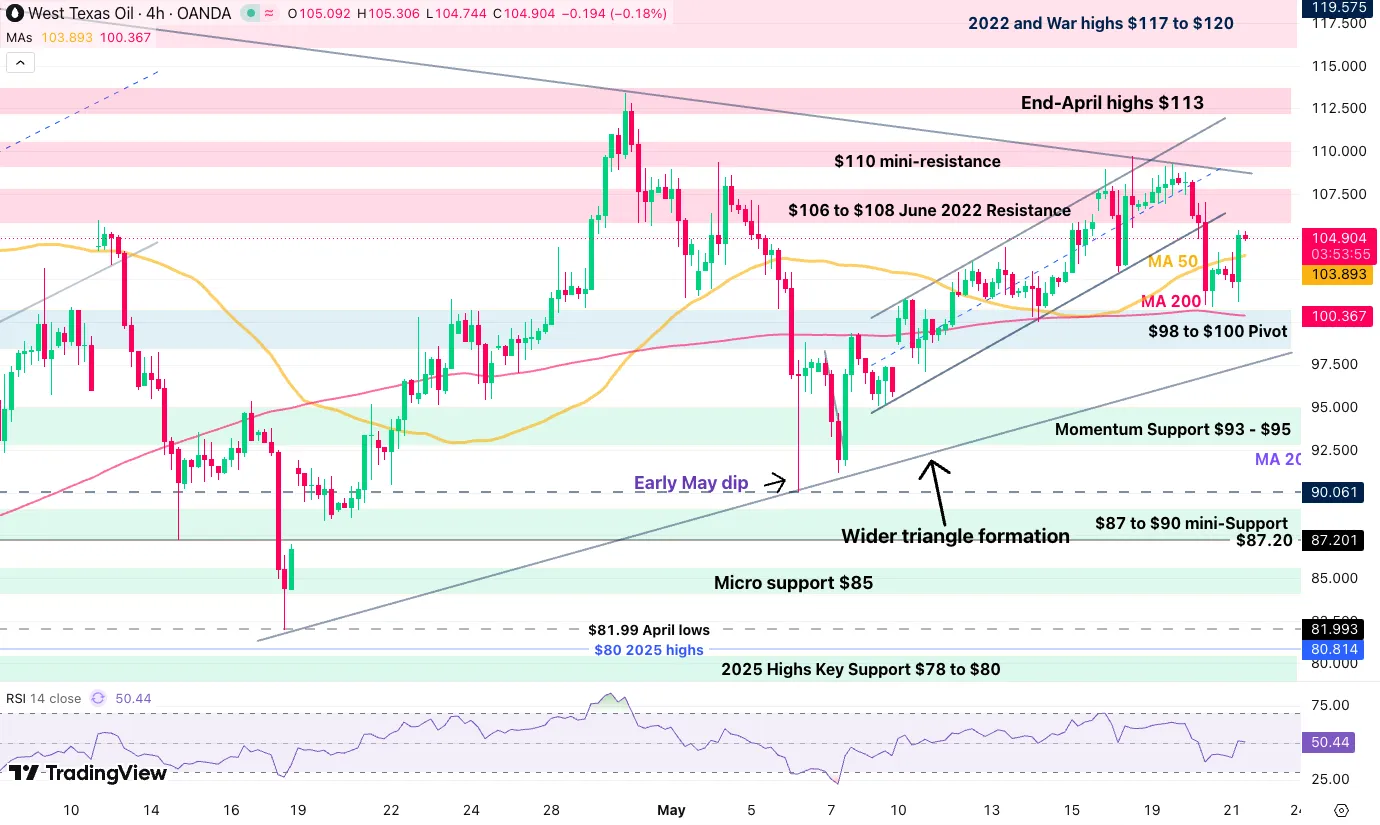
WTI Oil 4H chart. Source: TradingView, May 20, 2026.
WTI crude is stuck in a large triangle formation, currently consolidating between $110 and $98, a key development to watch.
Recently rejecting its upper bound on rumors of a new deal, the commodity broke its upward channel, but this was not enough for sellers to push momentum lower.
Buyers stepped back into the commodity just shy of the 4H 200-period MA and the commodity is now back 5% higher since. Check out reactions within the $106 to $108 resistance zone as the action gets back there.
WTI Technical Levels:
Resistance Levels
- $106.50 broken channel lows
- $106 to $108 June 2022 resistance
- $109 triangle resistance
- 2022 and Monday highs $117 to $120, larger channel top
Support Levels
- $98 to $100 pivot, 4H 200-period MA, short-term bearish below
- Momentum support $93 to $95
- $90 psychological level and past session’s lows
- $87 to $90 mini-support
- $82 Friday 17 lows
- 2025 highs key support $78 to $80
1H Chart and Action Levels
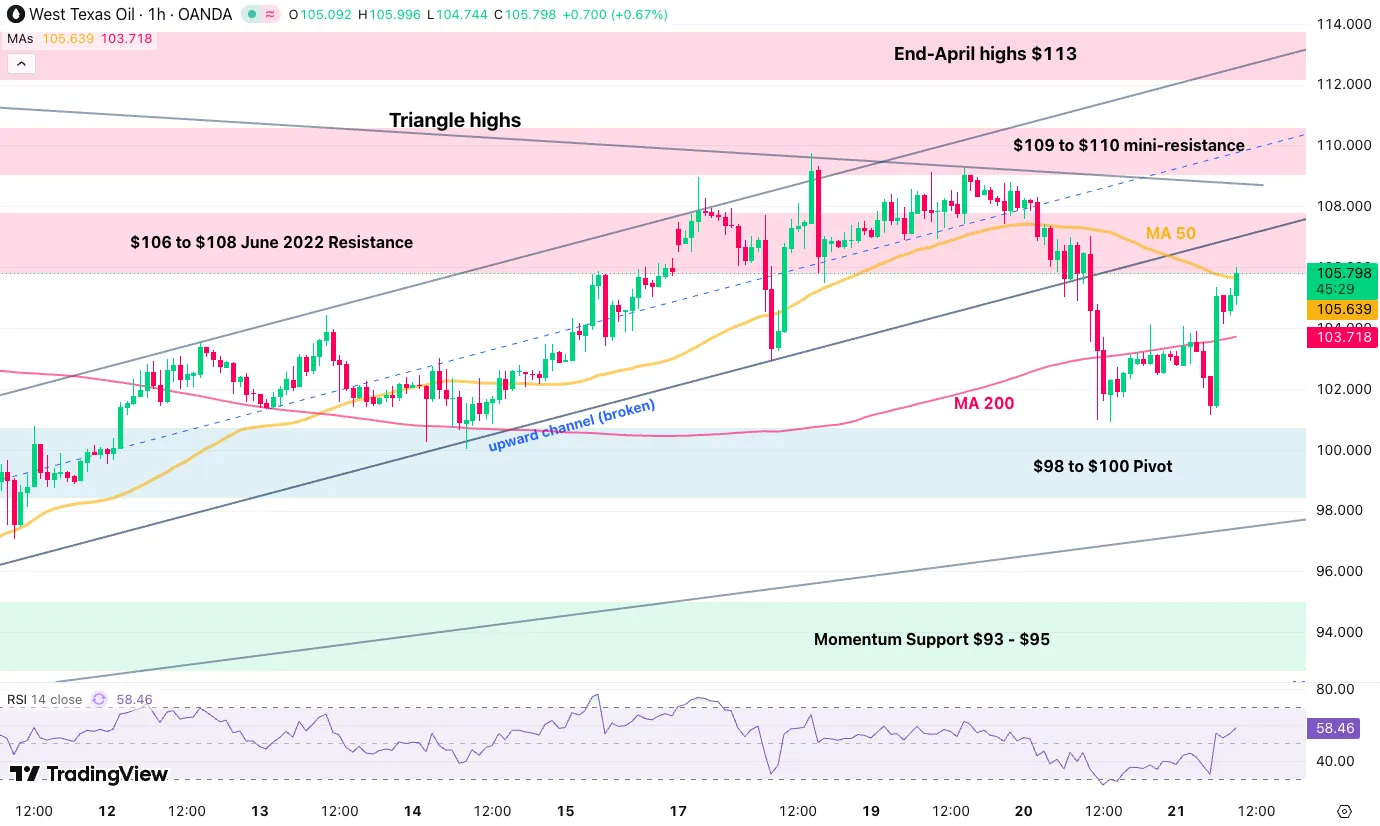
WTI Oil 1H chart. Source: TradingView, May 20, 2026.
Bulls are stepping back aggressively, as the narrative of a compromised deal continues to fuel intraday rallies.
The 50-hour MA has just been breached, but it could still weigh on the price action, hence traders will want to keep a close eye on it, with a 4H close for confirmation.
Mean-reversion traders will want to see either rejection here or at the upper resistance lines drawn from the triangle and broken channel formations.
Safe trades and keep your eyes on the news.


